image

Core Material Market Report Scope & Overview:

Core Material Market Revenue Analysis

Get E-PDF Sample Report on Core Material Market - Request Sample Report

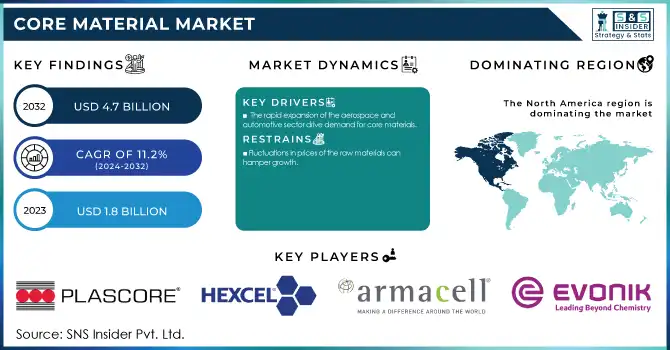
The Core Material Market Size was valued at USD 1.80 Billion in 2023 and is expected to reach USD 4.66 Billion by 2032, growing at a CAGR of 11.15% over the forecast period of 2024-2032.

The Core Material Market is expanding rapidly, driven by rising demand in aerospace, wind energy, and automotive industries. Our report offers a detailed pricing analysis, covering historical trends, regional variations, and cost drivers. A thorough supply chain analysis highlights key suppliers, production challenges, and logistics dynamics. Import-export data examines trade flows, tariff impacts, and emerging market shifts. The regulatory and compliance framework explores industry standards, sustainability mandates, and safety regulations shaping product development. Additionally, investment and funding trends provide insights into mergers, acquisitions, and venture capital driving innovation. Our report delivers a comprehensive market outlook, equipping stakeholders with actionable intelligence to navigate growth opportunities and industry disruptions in the core material landscape.

Market Dynamics

Drivers

  • Expanding Wind Energy Sector with Increased Installation of Wind Turbine Blades Drives the Core Material Market Growth

The rising adoption of renewable energy sources, particularly wind power, is a significant driver for the core material market. Wind turbine blades require durable, lightweight materials to enhance energy efficiency and structural performance. Core materials such as balsa wood, honeycombs, and foam composites provide the necessary strength-to-weight ratio, ensuring optimal blade performance under extreme weather conditions. Government incentives and global commitments to carbon neutrality are further accelerating wind energy investments, leading to an increased demand for core materials. Additionally, advancements in material technology, such as hybrid cores and bio-based composites, are driving innovations in blade manufacturing. As wind farms expand across regions, the market for core materials in wind energy applications is poised for substantial growth.

Restraints

  • Stringent Environmental Regulations and Compliance Requirements Pose Challenges for Core Material Manufacturers

Regulatory frameworks governing emissions, waste management, and sustainability impact the production and application of core materials. Governments worldwide are enforcing stricter environmental policies to reduce carbon footprints, compelling manufacturers to adopt eco-friendly alternatives. Compliance with regulations such as REACH, RoHS, and EPA standards requires significant investments in sustainable raw materials and cleaner production technologies. Additionally, the disposal and recycling of composite materials present challenges due to limited infrastructure and high processing costs. Failure to comply with evolving environmental mandates can result in legal penalties, operational restrictions, and reputational damage. As regulatory frameworks continue to evolve, core material manufacturers must navigate complex compliance landscapes to maintain market presence.

Opportunities

  • Growing Adoption of Sustainable and Recyclable Core Materials Creates New Market Opportunities in Various Industrial Applications

The increasing focus on sustainability is driving the demand for recyclable and bio-based core materials. Industries such as aerospace, automotive, and wind energy are exploring alternatives that reduce environmental impact while maintaining high-performance standards. Manufacturers are investing in biodegradable foam cores, natural fiber composites, and recycled honeycombs to align with sustainability goals. The shift toward circular economy principles presents opportunities for material recovery, reuse, and cost-efficient production. Additionally, government incentives and consumer preferences for green materials further enhance market potential. Companies that innovate in sustainable core materials can gain a competitive edge and capitalize on emerging market trends.

Challenge

  • Limited Awareness and Adoption of Core Materials in Emerging Economies Restrict Market Expansion

Despite growing industrialization, many emerging economies exhibit low awareness and adoption of core materials. The lack of technical expertise, infrastructure, and market knowledge limits the penetration of high-performance composites in developing regions. Traditional construction and manufacturing practices dominate, reducing the uptake of advanced core materials. Additionally, cost considerations and limited access to raw materials hinder adoption in price-sensitive markets. Educational initiatives, industry collaborations, and government support are crucial in promoting the benefits and applications of core materials. Addressing knowledge gaps can accelerate market growth and unlock opportunities in untapped regions.

Segmental Analysis

By Type         

Foam dominated the core material market in 2023, accounting for 56.2% of the market share. Among foam types, Polyethylene Terephthalate (PET) Foam emerged as the leading subsegment, holding an estimated 37.4% share within the foam category. PET foam's dominance is attributed to its lightweight nature, superior mechanical properties, and recyclability, making it a preferred choice in aerospace, wind energy, and automotive applications. The American Wind Energy Association (AWEA) and the Global Wind Energy Council (GWEC) have highlighted the increasing adoption of PET foam in wind turbine blade manufacturing due to its cost efficiency and sustainability. Additionally, major aircraft manufacturers, including Airbus and Boeing, are integrating PET foam in aircraft interiors to enhance fuel efficiency and structural performance. Government initiatives promoting sustainability and lightweight materials in transportation further drive its demand.

By Application

Sandwich panels dominated the core material market in 2023, capturing 30.5% of the market share. These panels are widely used across industries due to their exceptional strength-to-weight ratio, insulation properties, and resistance to environmental stress. The construction sector, particularly in Europe and North America, is increasingly adopting sandwich panels for prefabricated buildings and infrastructure projects, aligning with sustainability and energy efficiency mandates set by the European Commission and the U.S. Department of Energy. Additionally, leading wind energy companies like Vestas and Siemens Gamesa are incorporating sandwich panels in wind turbine nacelles and blade structures to enhance durability and aerodynamic performance. Their versatility in aerospace and marine applications further strengthens their market position, driven by regulatory frameworks promoting lightweight materials in structural components.

By End-Use Industry

Wind energy dominated the core material market in 2023, accounting for around 27.1% of the market share. The growing emphasis on renewable energy sources and increasing global wind power installations have significantly propelled the demand for core materials, especially foam and balsa, in turbine blade production. Reports from the International Energy Agency (IEA) indicate a surge in offshore wind energy projects, with China, the U.S., and Germany leading the expansion. Companies like GE Renewable Energy and Nordex Group are continuously innovating blade design with high-performance core materials to enhance efficiency and reduce maintenance costs. Additionally, government policies, such as the U.S. Inflation Reduction Act (IRA) and China's Renewable Energy Development Plan, are fostering substantial investments in wind energy infrastructure, further solidifying the dominance of this segment in the core material market.
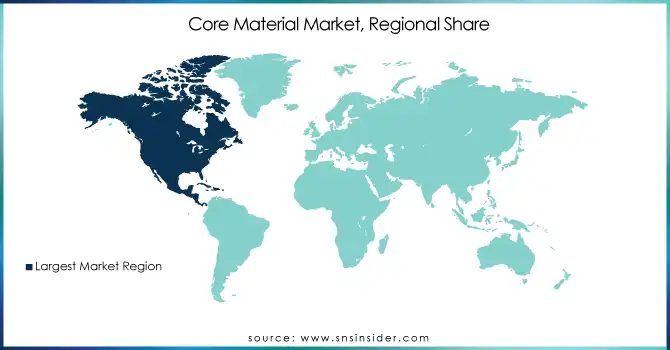
Regional Analysis

Asia Pacific dominated the core material market in 2023, accounting for 41.8% of the total market share. The region's dominance is driven by the rapid expansion of key end-use industries, including wind energy, aerospace, and automotive. China is the leading contributor, with significant investments in wind power infrastructure, as reported by the Global Wind Energy Council (GWEC), which states that China installed over 65 GW of new wind capacity in 2023 alone. The Chinese government’s aggressive push for renewable energy under its 14th Five-Year Plan has accelerated the demand for high-performance core materials in turbine blades. India follows as another strong market, with the Indian Wind Energy Association (IWEA) highlighting the country’s goal of achieving 140 GW of wind energy capacity by 2030, significantly driving the demand for core materials. Japan and South Korea are also key players, leveraging advanced composite materials in aerospace and marine applications, supported by investments from companies like Toray Industries and Mitsubishi Chemical Corporation. The rapid growth of electric vehicle (EV) manufacturing in these nations, driven by companies such as BYD, Toyota, and Hyundai, has further fueled the adoption of lightweight core materials to enhance vehicle efficiency. Additionally, government regulations in China and India mandating energy-efficient construction have boosted the use of core materials in sandwich panels for sustainable infrastructure projects.

Moreover, North America emerged as the fastest-growing region in the core material market during the forecast period, with a significant growth rate during the forecast period. This growth is fueled by increasing investments in renewable energy, aerospace advancements, and the growing adoption of lightweight materials in transportation. The United States leads the region, with the U.S. Department of Energy allocating substantial funding for wind energy projects, particularly offshore wind farms. Reports from the American Clean Power Association (ACP) indicate that the U.S. installed over 10 GW of new wind capacity in 2023, significantly driving demand for foam and honeycomb core materials in turbine blades. The aerospace sector also plays a crucial role, with Boeing and Lockheed Martin incorporating advanced composite core materials in next-generation aircraft to enhance fuel efficiency. Canada is another key contributor, with the government investing CAD 964 million in green energy projects, further propelling the demand for core materials. Mexico, with its booming automotive industry, led by manufacturers such as Tesla and Ford, is adopting lightweight core materials for EV production to comply with stringent fuel efficiency standards under the United States-Mexico-Canada Agreement (USMCA). Additionally, North America's stringent regulatory framework on carbon emissions, particularly in the construction and automotive industries, is pushing manufacturers to adopt core materials in sandwich panels and lightweight components, reinforcing the region’s rapid market expansion.

Core-Material-Market-Regional-Share

Get Customized Report as Per Your Business Requirement - Request For Customized Report

Key Players

  • Evonik Industries AG (ROHACELL, VESTAMID)

  • Armacell International S.A. (ArmaPET, ArmaFORM)

  • Plascore Incorporated (Nomex Honeycomb, Aluminum Honeycomb)

  • Diab Group (Divinycell, ProBalsa)

  • 3A Composites (AIREX, BALTEK)

  • Gurit Holding AG (Corecell, Kerdyn)

  • Hexcel Corporation (HexWeb Honeycomb, HexPly)

  • Euro-Composites S.A. (ECM Honeycomb, ECORCELL)

  • The Gill Corporation (Gillcore, Gillfab)

  • Toray Industries, Inc. (Torayca, Nomex Honeycomb)

  • Changzhou Tiansheng New Materials Co., Ltd. (Tiansheng PMI Foam, Tiansheng PET Foam)

  • Corelite (Corelite Board, Corelite PET)

  • Sicomin (GreenPoxy, PB 250)

  • I-Core Composites (I-Core PET, I-Core Balsa)

  • Maricell Core Composites (Maricell PVC Foam, Maricell SAN Foam)

  • Showa Aircraft Industry Co. Ltd. (Showa Honeycomb, Showa Composite Panels)

  • TCCore Applied Honeycomb Technology Co. Ltd. (TCCore Aluminum Honeycomb, TCCore Nomex Honeycomb)

  • Saertex GmbH & Co. KG (Saerfoam, Saerfix)

  • Relcore Composites Inc. (Relcore Aluminum Honeycomb, Relcore Nomex Honeycomb)

  • EconCore (ThermHex, Fynocore)

Core Material Market Report Scope:

Report Attributes Details
Market Size in 2023 USD 1.80 Billion
Market Size by 2032 USD 4.66 Billion
CAGR CAGR of 11.15% From 2024 to 2032
Base Year 2023
Forecast Period 2024-2032
Historical Data 2020-2022
Report Scope & Coverage Market Size, Segments Analysis, Competitive  Landscape, Regional Analysis, DROC & SWOT Analysis, Forecast Outlook
Key Segments •By Type (Foam [Polyethylene Terephthalate (PET) Foam, Polyvinyl Chloride (PVC) Foam, Styrene-Acrylonitrile (SAN) Foam, Polymethacrylimide (PMI) Foam, Polyetherimide (PEI) Foam], Honeycomb [Aluminum Honeycomb, Aramid Honeycomb, Thermoplastic Honeycomb, Balsa]
•By Application (Sandwich Panels, Wind Turbine Blades, Aerospace Structures, Marine Components, Automotive Parts, Others)
•By End-Use Industry (Automotive & Transportation, Wind Energy, Aerospace & Defense, Marine, Construction, Others)
Regional Analysis/Coverage North America (US, Canada, Mexico), Europe (Eastern Europe [Poland, Romania, Hungary, Turkey, Rest of Eastern Europe] Western Europe] Germany, France, UK, Italy, Spain, Netherlands, Switzerland, Austria, Rest of Western Europe]), Asia Pacific (China, India, Japan, South Korea, Vietnam, Singapore, Australia, Rest of Asia Pacific), Middle East & Africa (Middle East [UAE, Egypt, Saudi Arabia, Qatar, Rest of Middle East], Africa [Nigeria, South Africa, Rest of Africa], Latin America (Brazil, Argentina, Colombia, Rest of Latin America)
Company Profiles Evonik Industries AG, Armacell International S.A., Plascore Incorporated, Diab Group, 3A Composites, Gurit Holding AG, Hexcel Corporation, Euro-Composites S.A., The Gill Corporation, Toray Industries, Inc. and other key players


Frequently Asked Questions

Ans: The Core Material Market was valued at USD 1.80 billion in 2023.

Ans: The Core Material Market is projected to reach USD 4.66 billion by 2032, growing at a CAGR of 11.15%.

Ans: The Core Material Market is driven by aerospace, wind energy, and automotive industries.

Ans: Sandwich panels dominated the Core Material Market in 2023, holding a 30.5% share.

Ans: Major companies in the Core Material Market include Evonik Industries, Armacell International, Hexcel Corporation, and Diab Group.

Table of Contents

1. Introduction

1.1 Market Definition

1.2 Scope (Inclusion and Exclusions)

1.3 Research Assumptions

2. Executive Summary

2.1 Market Overview

2.2 Regional Synopsis

2.3 Competitive Summary

3. Research Methodology

3.1 Top-Down Approach

3.2 Bottom-up Approach

3.3. Data Validation

3.4 Primary Interviews

4. Market Dynamics Impact Analysis

4.1 Market Driving Factors Analysis

4.1.1 Drivers

4.1.2 Restraints

4.1.3 Opportunities

4.1.4 Challenges

4.2 PESTLE Analysis

4.3 Porter’s Five Forces Model

5. Statistical Insights and Trends Reporting

5.1 Pricing Analysis

5.2 Supply Chain Analysis

5.3 Import-Export Data

5.4 Regulatory and Compliance Framework

5.5 Investment and Funding Trends

6. Competitive Landscape

6.1 List of Major Companies, By Region

6.2 Market Share Analysis, By Region

6.3 Product Benchmarking

6.3.1 Product specifications and features

6.3.2 Pricing

6.4 Strategic Initiatives

6.4.1 Marketing and promotional activities

6.4.2 Distribution and supply chain strategies

6.4.3 Expansion plans and new product launches

6.4.4 Strategic partnerships and collaborations

6.5 Technological Advancements

6.6 Market Positioning and Branding

7. Core Material Market Segmentation, by Type

7.1 Chapter Overview

7.2 Foam

7.2.1 Foam Market Trends Analysis (2020-2032)

7.2.2 Foam Market Size Estimates and Forecasts to 2032 (USD Billion)

7.2.3 Polyethylene Terephthalate (PET) Foam

7.2.3.1 Polyethylene Terephthalate (PET) Foam Market Trends Analysis (2020-2032)

7.2.3.2 Polyethylene Terephthalate (PET) Foam Market Size Estimates and Forecasts to 2032 (USD Billion)

7.2.4 Polyvinyl Chloride (PVC) Foam

7.2.4.1 Polyvinyl Chloride (PVC) Foam Market Trends Analysis (2020-2032)

7.2.4.2 Polyvinyl Chloride (PVC) Foam Market Size Estimates and Forecasts to 2032 (USD Billion)

7.2.5 Styrene-Acrylonitrile (SAN) Foam

7.2.5.1 Styrene-Acrylonitrile (SAN) Foam Market Trends Analysis (2020-2032)

7.2.5.2 Styrene-Acrylonitrile (SAN) Foam Market Size Estimates and Forecasts to 2032 (USD Billion)

7.2.6 Polymethacrylimide (PMI) Foam

7.2.6.1 Polymethacrylimide (PMI) Foam Market Trends Analysis (2020-2032)

7.2.6.2 Polymethacrylimide (PMI) Foam Market Size Estimates and Forecasts to 2032 (USD Billion)

7.2.7 Polyetherimide (PEI) Foam

7.2.7.1 Polyetherimide (PEI) Foam Market Trends Analysis (2020-2032)

7.2.7.2 Polyetherimide (PEI) Foam Market Size Estimates and Forecasts to 2032 (USD Billion)

7.3 Honeycomb

7.3.1 Honeycomb Market Trends Analysis (2020-2032)

7.3.2 Honeycomb Market Size Estimates and Forecasts to 2032 (USD Billion)

7.3.3 Aluminum Honeycomb

7.3.3.1 Aluminum Honeycomb Market Trends Analysis (2020-2032)

7.3.3.2 Aluminum Honeycomb Market Size Estimates and Forecasts to 2032 (USD Billion)

7.3.4 Aramid Honeycomb

7.3.4.1 Aramid Honeycomb Market Trends Analysis (2020-2032)

7.3.4.2 Aramid Honeycomb Market Size Estimates and Forecasts to 2032 (USD Billion)

7.3.5 Thermoplastic Honeycomb

7.3.5.1 Thermoplastic Honeycomb Market Trends Analysis (2020-2032)

7.3.5.2 Thermoplastic Honeycomb Market Size Estimates and Forecasts to 2032 (USD Billion)

7.3.6 Balsa

7.3.6.1 Balsa Market Trends Analysis (2020-2032)

7.3.6.2 Balsa Market Size Estimates and Forecasts to 2032 (USD Billion)

8. Core Material Market Segmentation, by Application

8.1 Chapter Overview

8.2 Sandwich Panels

8.2.1 Sandwich Panels Market Trends Analysis (2020-2032)

8.2.2 Sandwich Panels Market Size Estimates and Forecasts to 2032 (USD Billion)

8.3 Wind Turbine Blades

8.3.1 Wind Turbine Blades Market Trends Analysis (2020-2032)

8.3.2 Wind Turbine Blades Market Size Estimates and Forecasts to 2032 (USD Billion)

8.4 Aerospace Structures

8.4.1 Aerospace Structures Market Trends Analysis (2020-2032)

8.4.2 Aerospace Structures Market Size Estimates and Forecasts to 2032 (USD Billion)

8.5 Marine Components

8.5.1 Marine Components Market Trends Analysis (2020-2032)

8.5.2 Marine Components Market Size Estimates and Forecasts to 2032 (USD Billion)

8.6 Automotive Parts

8.6.1 Automotive Parts Market Trends Analysis (2020-2032)

8.6.2 Automotive Parts Market Size Estimates and Forecasts to 2032 (USD Billion)

8.7 Others

8.7.1 Others Market Trends Analysis (2020-2032)

8.7.2 Others Market Size Estimates and Forecasts to 2032 (USD Billion)

9. Core Material Market Segmentation, by End-Use Industry

9.1 Chapter Overview

9.2 Automotive & Transportation

9.2.1 Automotive & Transportation Market Trends Analysis (2020-2032)

9.2.2 Automotive & Transportation Market Size Estimates and Forecasts to 2032 (USD Billion)

9.3 Wind Energy

9.3.1 Wind Energy Market Trends Analysis (2020-2032)

9.3.2 Wind Energy Market Size Estimates and Forecasts to 2032 (USD Billion)

9.4 Aerospace & Defense

               9.4.1 Aerospace & Defense Market Trends Analysis (2020-2032)

9.4.2 Aerospace & Defense Market Size Estimates and Forecasts to 2032 (USD Billion)

9.5 Marine

9.5.1 Marine Market Trends Analysis (2020-2032)

9.5.2 Marine Market Size Estimates and Forecasts to 2032 (USD Billion)

9.6 Construction

9.6.1 Construction Market Trends Analysis (2020-2032)

9.6.2 Construction Market Size Estimates and Forecasts to 2032 (USD Billion)

9.7 Others

9.7.1 Others Market Trends Analysis (2020-2032)

9.7.2 Others Market Size Estimates and Forecasts to 2032 (USD Billion)

10. Regional Analysis

10.1 Chapter Overview

10.2 North America

10.2.1 Trends Analysis

10.2.2 North America Core Material Market Estimates and Forecasts, by Country (2020-2032) (USD Billion)

10.2.3 North America Core Material Market Estimates and Forecasts, by Type (2020-2032) (USD Billion) 

10.2.4 North America Core Material Market Estimates and Forecasts, by Application (2020-2032) (USD Billion)

10.2.5 North America Core Material Market Estimates and Forecasts, by End-Use Industry (2020-2032) (USD Billion)

10.2.6 USA

10.2.6.1 USA Core Material Market Estimates and Forecasts, by Type (2020-2032) (USD Billion)

10.2.6.2 USA Core Material Market Estimates and Forecasts, by Application (2020-2032) (USD Billion)

10.2.6.3 USA Core Material Market Estimates and Forecasts, by End-Use Industry (2020-2032) (USD Billion)

10.2.7 Canada

10.2.7.1 Canada Core Material Market Estimates and Forecasts, by Type (2020-2032) (USD Billion)

10.2.7.2 Canada Core Material Market Estimates and Forecasts, by Application (2020-2032) (USD Billion)

10.2.7.3 Canada Core Material Market Estimates and Forecasts, by End-Use Industry (2020-2032) (USD Billion)

10.2.8 Mexico

10.2.8.1 Mexico Core Material Market Estimates and Forecasts, by Type (2020-2032) (USD Billion)

10.2.8.2 Mexico Core Material Market Estimates and Forecasts, by Application (2020-2032) (USD Billion)

10.2.8.3 Mexico Core Material Market Estimates and Forecasts, by End-Use Industry (2020-2032) (USD Billion)

10.3 Europe

10.3.1 Eastern Europe

10.3.1.1 Trends Analysis

10.3.1.2 Eastern Europe Core Material Market Estimates and Forecasts, by Country (2020-2032) (USD Billion)

10.3.1.3 Eastern Europe Core Material Market Estimates and Forecasts, by Type (2020-2032) (USD Billion) 

10.3.1.4 Eastern Europe Core Material Market Estimates and Forecasts, by Application (2020-2032) (USD Billion)

10.3.1.5 Eastern Europe Core Material Market Estimates and Forecasts, by End-Use Industry (2020-2032) (USD Billion)

10.3.1.6 Poland

10.3.1.6.1 Poland Core Material Market Estimates and Forecasts, by Type (2020-2032) (USD Billion)

10.3.1.6.2 Poland Core Material Market Estimates and Forecasts, by Application (2020-2032) (USD Billion)

10.3.1.6.3 Poland Core Material Market Estimates and Forecasts, by End-Use Industry (2020-2032) (USD Billion)

10.3.1.7 Romania

10.3.1.7.1 Romania Core Material Market Estimates and Forecasts, by Type (2020-2032) (USD Billion)

10.3.1.7.2 Romania Core Material Market Estimates and Forecasts, by Application (2020-2032) (USD Billion)

10.3.1.7.3 Romania Core Material Market Estimates and Forecasts, by End-Use Industry (2020-2032) (USD Billion)

10.3.1.8 Hungary

10.3.1.8.1 Hungary Core Material Market Estimates and Forecasts, by Type (2020-2032) (USD Billion)

10.3.1.8.2 Hungary Core Material Market Estimates and Forecasts, by Application (2020-2032) (USD Billion)

10.3.1.8.3 Hungary Core Material Market Estimates and Forecasts, by End-Use Industry (2020-2032) (USD Billion)

10.3.1.9 Turkey

10.3.1.9.1 Turkey Core Material Market Estimates and Forecasts, by Type (2020-2032) (USD Billion)

10.3.1.9.2 Turkey Core Material Market Estimates and Forecasts, by Application (2020-2032) (USD Billion)

10.3.1.9.3 Turkey Core Material Market Estimates and Forecasts, by End-Use Industry (2020-2032) (USD Billion)

10.3.1.10 Rest of Eastern Europe

10.3.1.10.1 Rest of Eastern Europe Core Material Market Estimates and Forecasts, by Type (2020-2032) (USD Billion)

10.3.1.10.2 Rest of Eastern Europe Core Material Market Estimates and Forecasts, by Application (2020-2032) (USD Billion)

10.3.1.10.3 Rest of Eastern Europe Core Material Market Estimates and Forecasts, by End-Use Industry (2020-2032) (USD Billion)

10.3.2 Western Europe

10.3.2.1 Trends Analysis

10.3.2.2 Western Europe Core Material Market Estimates and Forecasts, by Country (2020-2032) (USD Billion)

10.3.2.3 Western Europe Core Material Market Estimates and Forecasts, by Type (2020-2032) (USD Billion) 

10.3.2.4 Western Europe Core Material Market Estimates and Forecasts, by Application (2020-2032) (USD Billion)

10.3.2.5 Western Europe Core Material Market Estimates and Forecasts, by End-Use Industry (2020-2032) (USD Billion)

10.3.2.6 Germany

10.3.2.6.1 Germany Core Material Market Estimates and Forecasts, by Type (2020-2032) (USD Billion)

10.3.2.6.2 Germany Core Material Market Estimates and Forecasts, by Application (2020-2032) (USD Billion)

10.3.2.6.3 Germany Core Material Market Estimates and Forecasts, by End-Use Industry (2020-2032) (USD Billion)

10.3.2.7 France

10.3.2.7.1 France Core Material Market Estimates and Forecasts, by Type (2020-2032) (USD Billion)

10.3.2.7.2 France Core Material Market Estimates and Forecasts, by Application (2020-2032) (USD Billion)

10.3.2.7.3 France Core Material Market Estimates and Forecasts, by End-Use Industry (2020-2032) (USD Billion)

10.3.2.8 UK

10.3.2.8.1 UK Core Material Market Estimates and Forecasts, by Type (2020-2032) (USD Billion)

10.3.2.8.2 UK Core Material Market Estimates and Forecasts, by Application (2020-2032) (USD Billion)

10.3.2.8.3 UK Core Material Market Estimates and Forecasts, by End-Use Industry (2020-2032) (USD Billion)

10.3.2.9 Italy

10.3.2.9.1 Italy Core Material Market Estimates and Forecasts, by Type (2020-2032) (USD Billion)

10.3.2.9.2 Italy Core Material Market Estimates and Forecasts, by Application (2020-2032) (USD Billion)

10.3.2.9.3 Italy Core Material Market Estimates and Forecasts, by End-Use Industry (2020-2032) (USD Billion)

10.3.2.10 Spain

10.3.2.10.1 Spain Core Material Market Estimates and Forecasts, by Type (2020-2032) (USD Billion)

10.3.2.10.2 Spain Core Material Market Estimates and Forecasts, by Application (2020-2032) (USD Billion)

10.3.2.10.3 Spain Core Material Market Estimates and Forecasts, by End-Use Industry (2020-2032) (USD Billion)

10.3.2.11 Netherlands

10.3.2.11.1 Netherlands Core Material Market Estimates and Forecasts, by Type (2020-2032) (USD Billion)

10.3.2.11.2 Netherlands Core Material Market Estimates and Forecasts, by Application (2020-2032) (USD Billion)

10.3.2.11.3 Netherlands Core Material Market Estimates and Forecasts, by End-Use Industry (2020-2032) (USD Billion)

10.3.2.12 Switzerland

10.3.2.12.1 Switzerland Core Material Market Estimates and Forecasts, by Type (2020-2032) (USD Billion)

10.3.2.12.2 Switzerland Core Material Market Estimates and Forecasts, by Application (2020-2032) (USD Billion)

10.3.2.12.3 Switzerland Core Material Market Estimates and Forecasts, by End-Use Industry (2020-2032) (USD Billion)

10.3.2.13 Austria

10.3.2.13.1 Austria Core Material Market Estimates and Forecasts, by Type (2020-2032) (USD Billion)

10.3.2.13.2 Austria Core Material Market Estimates and Forecasts, by Application (2020-2032) (USD Billion)

10.3.2.13.3 Austria Core Material Market Estimates and Forecasts, by End-Use Industry (2020-2032) (USD Billion)

10.3.2.14 Rest of Western Europe

10.3.2.14.1 Rest of Western Europe Core Material Market Estimates and Forecasts, by Type (2020-2032) (USD Billion)

10.3.2.14.2 Rest of Western Europe Core Material Market Estimates and Forecasts, by Application (2020-2032) (USD Billion)

10.3.2.14.3 Rest of Western Europe Core Material Market Estimates and Forecasts, by End-Use Industry (2020-2032) (USD Billion)

10.4 Asia Pacific

10.4.1 Trends Analysis

10.4.2 Asia Pacific Core Material Market Estimates and Forecasts, by Country (2020-2032) (USD Billion)

10.4.3 Asia Pacific Core Material Market Estimates and Forecasts, by Type (2020-2032) (USD Billion) 

10.4.4 Asia Pacific Core Material Market Estimates and Forecasts, by Application (2020-2032) (USD Billion)

10.4.5 Asia Pacific Core Material Market Estimates and Forecasts, by End-Use Industry (2020-2032) (USD Billion)

10.4.6 China

10.4.6.1 China Core Material Market Estimates and Forecasts, by Type (2020-2032) (USD Billion)

10.4.6.2 China Core Material Market Estimates and Forecasts, by Application (2020-2032) (USD Billion)

10.4.6.3 China Core Material Market Estimates and Forecasts, by End-Use Industry (2020-2032) (USD Billion)

10.4.7 India

10.4.7.1 India Core Material Market Estimates and Forecasts, by Type (2020-2032) (USD Billion)

10.4.7.2 India Core Material Market Estimates and Forecasts, by Application (2020-2032) (USD Billion)

10.4.7.3 India Core Material Market Estimates and Forecasts, by End-Use Industry (2020-2032) (USD Billion)

10.4.8 Japan

10.4.8.1 Japan Core Material Market Estimates and Forecasts, by Type (2020-2032) (USD Billion)

10.4.8.2 Japan Core Material Market Estimates and Forecasts, by Application (2020-2032) (USD Billion)

10.4.8.3 Japan Core Material Market Estimates and Forecasts, by End-Use Industry (2020-2032) (USD Billion)

10.4.9 South Korea

10.4.9.1 South Korea Core Material Market Estimates and Forecasts, by Type (2020-2032) (USD Billion)

10.4.9.2 South Korea Core Material Market Estimates and Forecasts, by Application (2020-2032) (USD Billion)

10.4.9.3 South Korea Core Material Market Estimates and Forecasts, by End-Use Industry (2020-2032) (USD Billion)

10.4.10 Vietnam

10.4.10.1 Vietnam Core Material Market Estimates and Forecasts, by Type (2020-2032) (USD Billion)

10.4.10.2 Vietnam Core Material Market Estimates and Forecasts, by Application (2020-2032) (USD Billion)

10.4.10.3 Vietnam Core Material Market Estimates and Forecasts, by End-Use Industry (2020-2032) (USD Billion)

10.4.11 Singapore

10.4.11.1 Singapore Core Material Market Estimates and Forecasts, by Type (2020-2032) (USD Billion)

10.4.11.2 Singapore Core Material Market Estimates and Forecasts, by Application (2020-2032) (USD Billion)

10.4.11.3 Singapore Core Material Market Estimates and Forecasts, by End-Use Industry (2020-2032) (USD Billion)

10.4.12 Australia

10.4.12.1 Australia Core Material Market Estimates and Forecasts, by Type (2020-2032) (USD Billion)

10.4.12.2 Australia Core Material Market Estimates and Forecasts, by Application (2020-2032) (USD Billion)

10.4.12.3 Australia Core Material Market Estimates and Forecasts, by End-Use Industry (2020-2032) (USD Billion)

10.4.13 Rest of Asia Pacific

10.4.13.1 Rest of Asia Pacific Core Material Market Estimates and Forecasts, by Type (2020-2032) (USD Billion)

10.4.13.2 Rest of Asia Pacific Core Material Market Estimates and Forecasts, by Application (2020-2032) (USD Billion)

10.4.13.3 Rest of Asia Pacific Core Material Market Estimates and Forecasts, by End-Use Industry (2020-2032) (USD Billion)

10.5 Middle East and Africa

10.5.1 Middle East

10.5.1.1 Trends Analysis

10.5.1.2 Middle East Core Material Market Estimates and Forecasts, by Country (2020-2032) (USD Billion)

10.5.1.3 Middle East Core Material Market Estimates and Forecasts, by Type (2020-2032) (USD Billion) 

10.5.1.4 Middle East Core Material Market Estimates and Forecasts, by Application (2020-2032) (USD Billion)

10.5.1.5 Middle East Core Material Market Estimates and Forecasts, by End-Use Industry (2020-2032) (USD Billion)

10.5.1.6 UAE

10.5.1.6.1 UAE Core Material Market Estimates and Forecasts, by Type (2020-2032) (USD Billion)

10.5.1.6.2 UAE Core Material Market Estimates and Forecasts, by Application (2020-2032) (USD Billion)

10.5.1.6.3 UAE Core Material Market Estimates and Forecasts, by End-Use Industry (2020-2032) (USD Billion)

10.5.1.7 Egypt

10.5.1.7.1 Egypt Core Material Market Estimates and Forecasts, by Type (2020-2032) (USD Billion)

10.5.1.7.2 Egypt Core Material Market Estimates and Forecasts, by Application (2020-2032) (USD Billion)

10.5.1.7.3 Egypt Core Material Market Estimates and Forecasts, by End-Use Industry (2020-2032) (USD Billion)

10.5.1.8 Saudi Arabia

10.5.1.8.1 Saudi Arabia Core Material Market Estimates and Forecasts, by Type (2020-2032) (USD Billion)

10.5.1.8.2 Saudi Arabia Core Material Market Estimates and Forecasts, by Application (2020-2032) (USD Billion)

10.5.1.8.3 Saudi Arabia Core Material Market Estimates and Forecasts, by End-Use Industry (2020-2032) (USD Billion)

10.5.1.9 Qatar

10.5.1.9.1 Qatar Core Material Market Estimates and Forecasts, by Type (2020-2032) (USD Billion)

10.5.1.9.2 Qatar Core Material Market Estimates and Forecasts, by Application (2020-2032) (USD Billion)

10.5.1.9.3 Qatar Core Material Market Estimates and Forecasts, by End-Use Industry (2020-2032) (USD Billion)

10.5.1.10 Rest of Middle East

10.5.1.10.1 Rest of Middle East Core Material Market Estimates and Forecasts, by Type (2020-2032) (USD Billion)

10.5.1.10.2 Rest of Middle East Core Material Market Estimates and Forecasts, by Application (2020-2032) (USD Billion)

10.5.1.10.3 Rest of Middle East Core Material Market Estimates and Forecasts, by End-Use Industry (2020-2032) (USD Billion)

10.5.2 Africa

10.5.2.1 Trends Analysis

10.5.2.2 Africa Core Material Market Estimates and Forecasts, by Country (2020-2032) (USD Billion)

10.5.2.3 Africa Core Material Market Estimates and Forecasts, by Type (2020-2032) (USD Billion) 

10.5.2.4 Africa Core Material Market Estimates and Forecasts, by Application (2020-2032) (USD Billion)

10.5.2.5 Africa Core Material Market Estimates and Forecasts, by End-Use Industry (2020-2032) (USD Billion)

10.5.2.6 South Africa

10.5.2.6.1 South Africa Core Material Market Estimates and Forecasts, by Type (2020-2032) (USD Billion)

10.5.2.6.2 South Africa Core Material Market Estimates and Forecasts, by Application (2020-2032) (USD Billion)

10.5.2.6.3 South Africa Core Material Market Estimates and Forecasts, by End-Use Industry (2020-2032) (USD Billion)

10.5.2.7 Nigeria

10.5.2.7.1 Nigeria Core Material Market Estimates and Forecasts, by Type (2020-2032) (USD Billion)

10.5.2.7.2 Nigeria Core Material Market Estimates and Forecasts, by Application (2020-2032) (USD Billion)

10.5.2.7.3 Nigeria Core Material Market Estimates and Forecasts, by End-Use Industry (2020-2032) (USD Billion)

10.5.2.8 Rest of Africa

10.5.2.8.1 Rest of Africa Core Material Market Estimates and Forecasts, by Type (2020-2032) (USD Billion)

10.5.2.8.2 Rest of Africa Core Material Market Estimates and Forecasts, by Application (2020-2032) (USD Billion)

10.5.2.8.3 Rest of Africa Core Material Market Estimates and Forecasts, by End-Use Industry (2020-2032) (USD Billion)

10.6 Latin America

10.6.1 Trends Analysis

10.6.2 Latin America Core Material Market Estimates and Forecasts, by Country (2020-2032) (USD Billion)

10.6.3 Latin America Core Material Market Estimates and Forecasts, by Type (2020-2032) (USD Billion) 

10.6.4 Latin America Core Material Market Estimates and Forecasts, by Application (2020-2032) (USD Billion)

10.6.5 Latin America Core Material Market Estimates and Forecasts, by End-Use Industry (2020-2032) (USD Billion)

10.6.6 Brazil

10.6.6.1 Brazil Core Material Market Estimates and Forecasts, by Type (2020-2032) (USD Billion)

10.6.6.2 Brazil Core Material Market Estimates and Forecasts, by Application (2020-2032) (USD Billion)

10.6.6.3 Brazil Core Material Market Estimates and Forecasts, by End-Use Industry (2020-2032) (USD Billion)

10.6.7 Argentina

10.6.7.1 Argentina Core Material Market Estimates and Forecasts, by Type (2020-2032) (USD Billion)

10.6.7.2 Argentina Core Material Market Estimates and Forecasts, by Application (2020-2032) (USD Billion)

10.6.7.3 Argentina Core Material Market Estimates and Forecasts, by End-Use Industry (2020-2032) (USD Billion)

10.6.8 Colombia

10.6.8.1 Colombia Core Material Market Estimates and Forecasts, by Type (2020-2032) (USD Billion)

10.6.8.2 Colombia Core Material Market Estimates and Forecasts, by Application (2020-2032) (USD Billion)

10.6.8.3 Colombia Core Material Market Estimates and Forecasts, by End-Use Industry (2020-2032) (USD Billion)

10.6.9 Rest of Latin America

10.6.9.1 Rest of Latin America Core Material Market Estimates and Forecasts, by Type (2020-2032) (USD Billion)

10.6.9.2 Rest of Latin America Core Material Market Estimates and Forecasts, by Application (2020-2032) (USD Billion)

10.6.9.3 Rest of Latin America Core Material Market Estimates and Forecasts, by End-Use Industry (2020-2032) (USD Billion)

11. Company Profiles

11.1 Evonik Industries AG

11.1.1 Company Overview

11.1.2 Financial

11.1.3 Products/ Services Offered

11.1.4 SWOT Analysis


11.2 Armacell International S.A.

11.2.1 Company Overview

11.2.2 Financial

11.2.3 Products/ Services Offered

11.2.4 SWOT Analysis


11.3 Plascore Incorporated

11.3.1 Company Overview

11.3.2 Financial

11.3.3 Products/ Services Offered

11.3.4 SWOT Analysis


11.4 Diab Group

11.4.1 Company Overview

11.4.2 Financial

11.4.3 Products/ Services Offered

11.4.4 SWOT Analysis


11.5 3A Composites

11.5.1 Company Overview

11.5.2 Financial

11.5.3 Products/ Services Offered

11.5.4 SWOT Analysis


11.6 Gurit Holding AG

11.6.1 Company Overview

11.6.2 Financial

11.6.3 Products/ Services Offered

11.6.4 SWOT Analysis


11.7 Hexcel Corporation

11.7.1 Company Overview

11.7.2 Financial

11.7.3 Products/ Services Offered

11.7.4 SWOT Analysis


11.8 Euro-Composites S.A.

11.8.1 Company Overview

11.8.2 Financial

11.8.3 Products/ Services Offered

11.8.4 SWOT Analysis


11.9 The Gill Corporation

11.9.1 Company Overview

11.9.2 Financial

11.9.3 Products/ Services Offered

11.9.4 SWOT Analysis


11.10 Toray Industries, Inc.

11.10.1 Company Overview

11.10.2 Financial

11.10.3 Products/ Services Offered

11.10.4 SWOT Analysis


12. Use Cases and Best Practices

13. Conclusion

An accurate research report requires proper strategizing as well as implementation. There are multiple factors involved in the completion of good and accurate research report and selecting the best methodology to compete the research is the toughest part. Since the research reports we provide play a crucial role in any company’s decision-making process, therefore we at SNS Insider always believe that we should choose the best method which gives us results closer to reality. This allows us to reach at a stage wherein we can provide our clients best and accurate investment to output ratio.

Each report that we prepare takes a timeframe of 350-400 business hours for production. Starting from the selection of titles through a couple of in-depth brain storming session to the final QC process before uploading our titles on our website we dedicate around 350 working hours. The titles are selected based on their current market cap and the foreseen CAGR and growth.


The 5 steps process:

Step 1: Secondary Research:

Secondary Research or Desk Research is as the name suggests is a research process wherein, we collect data through the readily available information. In this process we use various paid and unpaid databases which our team has access to and gather data through the same. This includes examining of listed companies’ annual reports, Journals, SEC filling etc. Apart from this our team has access to various associations across the globe across different industries. Lastly, we have exchange relationships with various university as well as individual libraries.

Secondary Research

Step 2: Primary Research

When we talk about primary research, it is a type of study in which the researchers collect relevant data samples directly, rather than relying on previously collected data.  This type of research is focused on gaining content specific facts that can be sued to solve specific problems. Since the collected data is fresh and first hand therefore it makes the study more accurate and genuine.

We at SNS Insider have divided Primary Research into 2 parts.

Part 1 wherein we interview the KOLs of major players as well as the upcoming ones across various geographic regions. This allows us to have their view over the market scenario and acts as an important tool to come closer to the accurate market numbers. As many as 45 paid and unpaid primary interviews are taken from both the demand and supply side of the industry to make sure we land at an accurate judgement and analysis of the market.

This step involves the triangulation of data wherein our team analyses the interview transcripts, online survey responses and observation of on filed participants. The below mentioned chart should give a better understanding of the part 1 of the primary interview.

Primary Research

Part 2: In this part of primary research the data collected via secondary research and the part 1 of the primary research is validated with the interviews from individual consultants and subject matter experts.

Consultants are those set of people who have at least 12 years of experience and expertise within the industry whereas Subject Matter Experts are those with at least 15 years of experience behind their back within the same space. The data with the help of two main processes i.e., FGDs (Focused Group Discussions) and IDs (Individual Discussions). This gives us a 3rd party nonbiased primary view of the market scenario making it a more dependable one while collation of the data pointers.

Step 3: Data Bank Validation

Once all the information is collected via primary and secondary sources, we run that information for data validation. At our intelligence centre our research heads track a lot of information related to the market which includes the quarterly reports, the daily stock prices, and other relevant information. Our data bank server gets updated every fortnight and that is how the information which we collected using our primary and secondary information is revalidated in real time.

Data Bank Validation

Step 4: QA/QC Process

After all the data collection and validation our team does a final level of quality check and quality assurance to get rid of any unwanted or undesired mistakes. This might include but not limited to getting rid of the any typos, duplication of numbers or missing of any important information. The people involved in this process include technical content writers, research heads and graphics people. Once this process is completed the title gets uploader on our platform for our clients to read it.

Step 5: Final QC/QA Process:

This is the last process and comes when the client has ordered the study. In this process a final QA/QC is done before the study is emailed to the client. Since we believe in giving our clients a good experience of our research studies, therefore, to make sure that we do not lack at our end in any way humanly possible we do a final round of quality check and then dispatch the study to the client.

Key Segments:

By Type

  • Foam

    • Polyethylene Terephthalate (PET) Foam

    • Polyvinyl Chloride (PVC) Foam

    • Styrene-Acrylonitrile (SAN) Foam

    • Polymethacrylimide (PMI) Foam

    • Polyetherimide (PEI) Foam

  • Honeycomb

    • Aluminum Honeycomb

    • Aramid Honeycomb

    • Thermoplastic Honeycomb

    • Balsa

By Application

  • Sandwich Panels

  • Wind Turbine Blades

  • Aerospace Structures

  • Marine Components

  • Automotive Parts

  • Others

By End-Use Industry

  • Automotive & Transportation

  • Wind Energy

  • Aerospace & Defense

  • Marine

  • Construction

  • Others

Request for Segment Customization as per your Business Requirement: Segment Customization Request

Regional Coverage:

North America

  • US

  • Canada

  • Mexico

Europe

  • Eastern Europe

    • Poland

    • Romania

    • Hungary

    • Turkey

    • Rest of Eastern Europe

  • Western Europe

    • Germany

    • France

    • UK

    • Italy

    • Spain

    • Netherlands

    • Switzerland

    • Austria

    • Rest of Western Europe

Asia Pacific

  • China

  • India

  • Japan

  • South Korea

  • Vietnam

  • Singapore

  • Australia

  • Rest of Asia Pacific

Middle East & Africa

  • Middle East

    • UAE

    • Egypt

    • Saudi Arabia

    • Qatar

    • Rest of Middle East

  • Africa

    • Nigeria

    • South Africa

    • Rest of Africa

Latin America

  • Brazil

  • Argentina

  • Colombia

  • Rest of Latin America

Request for Country Level Research Report: Country Level Customization Request

Available Customization

With the given market data, SNS Insider offers customization as per the company’s specific needs. The following customization options are available for the report:

  • Detailed Volume Analysis

  • Criss-Cross segment analysis (e.g. Product X Application)

  • Competitive Product Benchmarking

  • Geographic Analysis

  • Additional countries in any of the regions

  • Customized Data Representation

  • Detailed analysis and profiling of additional market players


  •            5000 (33% Discount)


  •            8950 (40% Discount)


  •            3050 (23% Discount)

Start a Conversation

Hi! Click one of our member below to chat on Phone