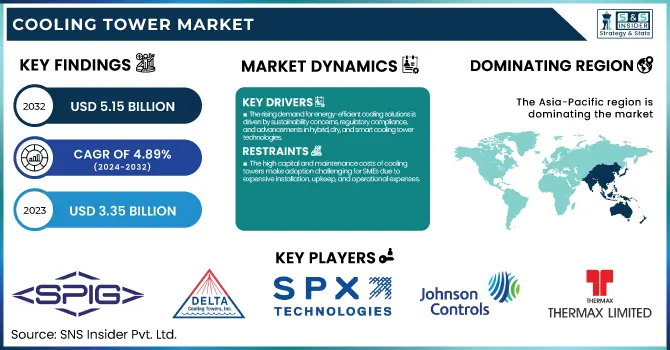
The Cooling Tower Market Size was estimated at USD 3.35 billion in 2023 and is expected to arrive at USD 5.15 billion by 2032 with a growing CAGR of 4.89% over the forecast period 2024-2032.
To get more information on Cooling Tower Market - Request Free Sample Report
This report offers a unique perspective on the Cooling Tower Market by analyzing installed capacity trends across key regions, utilization efficiency, and water consumption metrics, highlighting sustainability concerns. It provides insights on maintenance and downtime metrics, evaluating operational reliability. The study explores the adoption of advanced cooling technologies by region, tracking the shift toward energy-efficient and eco-friendly solutions. Additionally, it presents export/import trends of cooling towers and components, mapping global trade flows. Emerging trends such as AI-based predictive maintenance, hybrid cooling systems, and the impact of stricter environmental regulations further enhance this comprehensive market assessment.
Drivers
The rising demand for energy-efficient cooling solutions is driven by sustainability concerns, regulatory compliance, and advancements in hybrid, dry, and smart cooling tower technologies.
The growing demand for energy-efficient cooling solutions is transforming the cooling tower market, driven by rising awareness of energy conservation and strict government regulations on emissions and water usage. As a result, industries are moving towards energy-efficient cooling technologies to optimise operational costs and meet environmental regulations. To use less water and energy, hybrid and dry cooling towers are becoming more popular. Real-time performance optimization and predictive maintenance through IoT and AI-based monitoring systems further improves efficiency. Closed-loop and smart cooling systems are increasingly favored in the power generation, manufacturing, and HVAC sectors, following market trends. With the industries moving towards sustainability and compliance to regulation, high-efficiency cooling towers are expected to see a considerable uptake. This paradigm shift is not just fuelling technological advancements but also widening the market for sustainable and energy efficient cooling solutions, globally.
Restraint
The high capital and maintenance costs of cooling towers make adoption challenging for SMEs due to expensive installation, upkeep, and operational expenses.
The high initial investment and maintenance costs of cooling towers pose a significant challenge, especially for small and medium enterprises (SMEs). Cooling tower costs include significant capital outlay for purchase, physical system construction, and economic capital depreciation into existing infrastructures. That cost is additionally elevated by advanced cooling towers with energy-efficient designs and modern technologies. Routine maintenance is also vital for preventing scaling, corrosion, and microbial growth, all of which can affect efficiency and longevity. Operational expenses are further accumulated by the need for water treatment chemicals, periodic inspections, and components replacements. These costs can be prohibitive for SMEs with limited budgets, hence making it difficult for them to adopt new or upgrade existing cooling tower systems. In addition to this, sudden breakdowns may necessitate expensive fixes, resulting in a dip in production. In response to this crisis, organizations need to find economical resolutions and employ hybrid cooling systems and predictive maintenance solutions to boost performance and lower long-term costs.
Opportunities
The integration of IoT and AI in cooling towers enables real-time monitoring, predictive maintenance, and improved efficiency, reducing downtime and operational costs.
The adoption of smart cooling tower technologies is revolutionizing the industry by integrating IoT and AI for real-time monitoring and predictive maintenance. IoT-enabled sensors provide real-time tracking of temperature, humidity, water levels, and energy consumption, enabling operators to optimize their performance and identify problems before they arise. AI-led analytics also add efficiency in predicting maintenance, thus reducing downtime and improving overall operational reliability. Such solutions enable sectors to optimize energy use, reduce maintenance expenses, and prolong the lifespan of machinery. Also, rugged monitoring features allow monitoring operations in harsh field acting environments, plants, and factories. The further ongoing need for automation and data-driven decision-making, along with the rising requirement for energy-efficient options, is promoting the usage of smart cooling towers. Following regulatory bodies advocating for sustainable, water-efficient cooling solutions, the smart technologies are projected to be a game changer in cooling tower operations within diverse industry verticals.
Challenges
Cooling tower manufacturers face compliance challenges due to stringent global safety and environmental regulations, requiring continuous investment in eco-friendly solutions and technological advancements.
Cooling tower manufacturers must adhere to stringent national and international safety and environmental regulations, making compliance a significant challenge. Strict standards for emission, water and energy efficiency to control the environmental impact are imposed by governments and regulatory bodies. Regulations like the U.S. EPA’s Clean Water Act or OSHA’s workplace safety guidelines require environmentally safe materials, Legionella controls, and responsible wastewater treatments. Cooling towers also need to be certified in the industry standards like ASHRAE and ISO for their testing, quality control. Non-compliance could lead to significant penalties, closure of facilities, or damage to reputation. Moreover, changing regulations require ongoing investment in research, development, and technology updates to adapt to new standards. Manufacturers also have to contend with policies that differ across regions, leading to more complexity in expanding in global markets. Therefore, organizations need to invest in compliance strategies for providing winning solutions in risk management while ensuring cost-efficient quality standards in line with regulatory requirements.
By Product
The Open Circuit segment dominated with a market share of over 43% in 2023, due to its wide application in various industries, including, but not limited to, power generation, HVAC systems, oil & gas, and manufacturing. Cooling towers expose water directly to air for the efficient removal of heat. In industries where large-scale cooling is needed, they are favored as they cost less to install and operate than other types. Moreover, the open circuit cooling towers have lower maintenance costs and are also better suited for high heat applications. Due to rising demand for all kinds of energy-efficient cooling solutions, the adoption of cross flow cooling towers remains particularly steadfast, especially in the regions undergoing rapid industrialization and infrastructure development, thereby highlighting their dominance in the global cooling tower market.
By Material
The FRP (Fiber-Reinforced Plastic) segment dominated with a market share of over 32% in 2023, owing to its excellent corrosion resistance, lightweight construction, durability, and cost-effectiveness. FRP resists chemical exposure and environmental factors much more than conventional materials like steel and concrete, which make them preferable across industries such as power generation, HVAC, petrochemical and manufacturing. This is a major contributing factor to its widespread adoption, as well as its easy installation, low maintenance requirement, and long service life. Moreover, FRP cooling towers enable better thermal efficiency and structural integrity, which will lower operational cost for end users. As industries continue to focus on energy efficiency and sustainability, the need for FRP cooling towers will likely be robust, cementing its position as the dominant material in the market.
By Application
The Industrial segment dominated with a market share of over 34% in 2023, due to its widespread use in industries such as chemicals, food & beverage, and manufacturing. Efficient heat dissipation is crucial in these industries to maintain optimal working conditions, enhance energy efficiency, and extend the life of the equipment. Cooling towers are a temporary solution used for achieving process temperature control, avoiding thermal stress, improving productivity. Besides, strict environmental regulations and demand for energy-efficient cooling solutions, in the industrial segment, further fuel demand for energy-efficient cooling solutions. The increasing demand for reliable cooling systems is due to rapid industrialization, especially in the case of developing economies. Consequently, the industrial segment accounts for the largest share in driving the growth of the market, coming on the heels of continuous upgrades in the cooling tower technologies and sustainable cooling solutions.
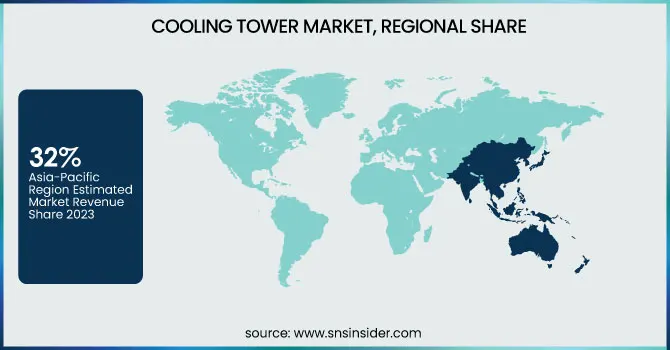
Asia-Pacific region dominated with a market share of over 32% in 2023, primarily due to rapid industrialization and increasing energy demand across countries like China, India, and Japan. Power Plants, Chemical Processing, and Manufacturing facilities are all expanding quickly in the region, which will require cooling solutions. Around the world, the growing rate of urbanization and rapid infrastructure development has greatly contributed to the increase of HVAC systems, thereby aiding market expansion. Dominance in the market is also supported by government initiatives promoting industrial expansion and sustainable cooling technologies. The factors such as the presence of major market players and innovative cooling tower designs for efficiency and minimum environmental impact reiterate the Asia-Pacific market share in the cooling tower market. The economy will continue growing, and technology will continue to advance, cementing the region's position as the most prominent in the world.
North America is emerging as the fastest-growing region in the cooling tower market due to rising investments in power generation and industrial expansion. Rising need for energy efficient cooling solutions in oil & gas, chemical processing, and manufacturing industries is supporting the market growth. Moreover, there are various developments in HVAC systems in commercial and residential sectors in the region, which in turn, is driving demand. U.S. Environmental Protection Agency (EPA) agencies have implemented increasingly stringent environmental regulations, promoting the adoption of sustainable and water-efficient technologies for cooling solutions. The increasing emphasis on carbon reduction and energy efficiency, as well as advances in cooling tower technology, are driving market growth across North America.
Get Customized Report as per Your Business Requirement - Enquiry Now
SPIG S.p.A (Field-Erected Cooling Towers, Modular Cooling Towers)
Absolute Cooling Tower Services Ltd. (Cooling Tower Maintenance, Repair & Components)
ESINDUS S.A (Hamon Group) (Natural Draft Cooling Towers, Induced Draft Cooling Towers)
Paharpur Cooling Towers Limited (Crossflow Cooling Towers, Counterflow Cooling Towers)
FANS a.s. (Evaporative Cooling Towers, Dry Cooling Towers)
LIANG CHI INDUSTRY (THAILAND) CO., LTD. (FRP Cooling Towers, Closed Circuit Cooling Towers)
Delta Cooling Towers, Inc. (HDPE Cooling Towers, Factory-Assembled Cooling Towers)
SPX Corporation (Cooling Tower Systems, Parts & Components)
Cooling Tower Depot, Inc. (Field-Erected Cooling Towers, Cooling Tower Parts)
Superchill Australia Pty Ltd. (Industrial Cooling Towers, Energy-Efficient Cooling Towers)
Baltimore Aircoil Company (Hybrid Cooling Towers, Closed-Circuit Cooling Towers)
EVAPCO, Inc. (Wet Cooling Towers, Adiabatic Cooling Systems)
Babcock & Wilcox Enterprises, Inc. (Large Industrial Cooling Towers, Dry Cooling Systems)
Marley Cooling Technologies (SPX Cooling Technologies, Inc.) (Crossflow Cooling Towers, Counterflow Cooling Towers)
Enexio Water Technologies GmbH (Wet & Dry Cooling Towers, Cooling Tower Fill Media)
Hamon & Cie (International) S.A. (Air-Cooled Condensers, Induced Draft Cooling Towers)
Johnson Controls (HVAC Cooling Towers, Industrial Cooling Towers)
Thermax Limited (Natural Draft Cooling Towers, Field Erected Cooling Towers)
Yuan Chang Tsay Industry Co., Ltd. (FRP Cooling Towers, Modular Cooling Towers)
Artech Cooling Towers Pvt. Ltd. (Wooden Cooling Towers, Concrete Cooling Towers)
Suppliers for the Cooling Tower Market
SPX Cooling Technologies
Evapco
Baltimore Aircoil Company
Hamon Group
Paharpur Cooling Towers
Delta Cooling Towers
Enexio
Marley Cooling Towers
Mesan Cooling Towers
DONGGUAN CARNO MACHINERY CO., LTD.
| Report Attributes | Details |
|---|---|
| Market Size in 2023 | USD 3.35 Billion |
| Market Size by 2032 | USD 5.15 Billion |
| CAGR | CAGR of 4.89% From 2024 to 2032 |
| Base Year | 2023 |
| Forecast Period | 2024-2032 |
| Historical Data | 2020-2022 |
| Report Scope & Coverage | Market Size, Segments Analysis, Competitive Landscape, Regional Analysis, DROC & SWOT Analysis, Forecast Outlook |
| Key Segments | • By Product (Open circuit, Closed circuit, Hybrid) • By Material (FRP, Steel, Concrete, Wood, HDPE) • By Application (HVAC, Power Generation, Oil & Gas, Industrial) |
| Regional Analysis/Coverage | North America (US, Canada, Mexico), Europe (Eastern Europe [Poland, Romania, Hungary, Turkey, Rest of Eastern Europe] Western Europe] Germany, France, UK, Italy, Spain, Netherlands, Switzerland, Austria, Rest of Western Europe]), Asia Pacific (China, India, Japan, South Korea, Vietnam, Singapore, Australia, Rest of Asia Pacific), Middle East & Africa (Middle East [UAE, Egypt, Saudi Arabia, Qatar, Rest of Middle East], Africa [Nigeria, South Africa, Rest of Africa], Latin America (Brazil, Argentina, Colombia, Rest of Latin America) |
| Company Profiles | SPIG S.p.A, Absolute Cooling Tower Services Ltd., ESINDUS S.A (Hamon Group), Paharpur Cooling Towers Limited, FANS a.s., LIANG CHI INDUSTRY (THAILAND) CO., LTD., Delta Cooling Towers, Inc., SPX Corporation, Cooling Tower Depot, Inc., Superchill Australia Pty Ltd., Baltimore Aircoil Company, EVAPCO, Inc., Babcock & Wilcox Enterprises, Inc., Marley Cooling Technologies (SPX Cooling Technologies, Inc.), Enexio Water Technologies GmbH, Hamon & Cie (International) S.A., Johnson Controls, Thermax Limited, Yuan Chang Tsay Industry Co., Ltd., Artech Cooling Towers Pvt. Ltd. |
Ans: The Cooling Tower Market is expected to grow at a CAGR of 4.89% during 2024-2032.
Ans: The Cooling Tower Market was USD 5.15 billion in 2023 and is expected to reach USD 3.35 billion by 2032.
Ans: The rising demand for energy-efficient cooling solutions is driven by sustainability concerns, regulatory compliance, and advancements in hybrid, dry, and smart cooling tower technologies.
Ans: The “Open circuit” segment dominated the Cooling Tower Market.
Ans: Asia-Pacific dominated the Cooling Tower Market in 2023.
1. Introduction
1.1 Market Definition
1.2 Scope (Inclusion and Exclusions)
1.3 Research Assumptions
2. Executive Summary
2.1 Market Overview
2.2 Regional Synopsis
2.3 Competitive Summary
3. Research Methodology
3.1 Top-Down Approach
3.2 Bottom-up Approach
3.3. Data Validation
3.4 Primary Interviews
4. Market Dynamics
4.1 Market Analysis
4.1.1 Drivers
4.1.2 Restraints
4.1.3 Opportunities
4.1.4 Challenges
4.2 PESTLE Analysis
4.3 Porter’s Five Forces Model
5. Statistical Insights and Trend Reporting
5.1 Installed Cooling Tower Capacity, by Region (2020-2023)
5.2 Utilization Efficiency & Water Consumption, by Region (2020-2023)
5.3 Maintenance & Downtime Metrics for Cooling Towers
5.4 Adoption of Advanced Cooling Technologies, by Region
5.5 Export/Import Data of Cooling Towers & Components, by Region (2023)
6. Competitive Landscape
6.1 List of Major Companies, By Region
6.2 Market Share Analysis, By Region
6.3 Product Benchmarking
6.3.1 Product specifications and features
6.3.2 Pricing
6.4 Strategic Initiatives
6.4.1 Marketing and promotional activities
6.4.2 Distribution and Supply Chain Strategies
6.4.3 Expansion plans and new product launches
6.4.4 Strategic partnerships and collaborations
6.5 Technological Advancements
6.6 Market Positioning and Branding
7. Cooling Tower Market Segmentation, By Product
7.1 Chapter Overview
7.2 Open circuit
7.2.1 Open circuit Market Trends Analysis (2020-2032)
7.2.2 Open circuit Market Size Estimates and Forecasts to 2032 (USD Billion)
7.3 Closed circuit
7.3.1 Closed circuit Market Trends Analysis (2020-2032)
7.3.2 Closed circuit Market Size Estimates and Forecasts to 2032 (USD Billion)
7.4 Hybrid
7.4.1 Hybrid Market Trends Analysis (2020-2032)
7.4.2 Hybrid Market Size Estimates and Forecasts to 2032 (USD Billion)
8. Cooling Tower Market Segmentation, By Material
8.1 Chapter Overview
8.2 FRP
8.2.1 FRP Market Trends Analysis (2020-2032)
8.2.2 FRP Market Size Estimates and Forecasts to 2032 (USD Billion)
8.3 Steel
8.3.1 Steel Market Trends Analysis (2020-2032)
8.3.2 Steel Market Size Estimates and Forecasts to 2032 (USD Billion)
8.4 Concrete
8.4.1 Concrete Market Trends Analysis (2020-2032)
8.4.2 Concrete Market Size Estimates and Forecasts to 2032 (USD Billion)
8.5 Wood
8.5.1 Wood Market Trends Analysis (2020-2032)
8.5.2 Wood Market Size Estimates and Forecasts to 2032 (USD Billion)
8.6 HDPE
8.6.1 HDPE Market Trends Analysis (2020-2032)
8.6.2 HDPE Market Size Estimates and Forecasts to 2032 (USD Billion)
9. Cooling Tower Market Segmentation, By Application
9.1 Chapter Overview
9.2 HVAC
9.2.1 HVAC Market Trends Analysis (2020-2032)
9.2.2 HVAC Market Size Estimates and Forecasts to 2032 (USD Billion)
9.3 Power Generation
9.3.1 Power Generation Market Trends Analysis (2020-2032)
9.3.2 Power Generation Market Size Estimates and Forecasts to 2032 (USD Billion)
9.4 Oil & Gas
9.4.1 Oil & Gas Market Trends Analysis (2020-2032)
9.4.2 Oil & Gas Market Size Estimates and Forecasts to 2032 (USD Billion)
9.5 Industrial
9.5.1 Industrial Market Trends Analysis (2020-2032)
9.5.2 Industrial Market Size Estimates and Forecasts to 2032 (USD Billion)
10. Regional Analysis
10.1 Chapter Overview
10.2 North America
10.2.1 Trends Analysis
10.2.2 North America Cooling Tower Market Estimates and Forecasts, by Country (2020-2032) (USD Billion)
10.2.3 North America Cooling Tower Market Estimates and Forecasts, By Product (2020-2032) (USD Billion)
10.2.4 North America Cooling Tower Market Estimates and Forecasts, By Material (2020-2032) (USD Billion)
10.2.5 North America Cooling Tower Market Estimates and Forecasts, By Application (2020-2032) (USD Billion)
10.2.6 USA
10.2.6.1 USA Cooling Tower Market Estimates and Forecasts, By Product (2020-2032) (USD Billion)
10.2.6.2 USA Cooling Tower Market Estimates and Forecasts, By Material (2020-2032) (USD Billion)
10.2.6.3 USA Cooling Tower Market Estimates and Forecasts, By Application (2020-2032) (USD Billion)
10.2.7 Canada
10.2.7.1 Canada Cooling Tower Market Estimates and Forecasts, By Product (2020-2032) (USD Billion)
10.2.7.2 Canada Cooling Tower Market Estimates and Forecasts, By Material (2020-2032) (USD Billion)
10.2.7.3 Canada Cooling Tower Market Estimates and Forecasts, By Application (2020-2032) (USD Billion)
10.2.8 Mexico
10.2.8.1 Mexico Cooling Tower Market Estimates and Forecasts, By Product (2020-2032) (USD Billion)
10.2.8.2 Mexico Cooling Tower Market Estimates and Forecasts, By Material (2020-2032) (USD Billion)
10.2.8.3 Mexico Cooling Tower Market Estimates and Forecasts, By Application (2020-2032) (USD Billion)
10.3 Europe
10.3.1 Eastern Europe
10.3.1.1 Trends Analysis
10.3.1.2 Eastern Europe Cooling Tower Market Estimates and Forecasts, by Country (2020-2032) (USD Billion)
10.3.1.3 Eastern Europe Cooling Tower Market Estimates and Forecasts, By Product (2020-2032) (USD Billion)
10.3.1.4 Eastern Europe Cooling Tower Market Estimates and Forecasts, By Material (2020-2032) (USD Billion)
10.3.1.5 Eastern Europe Cooling Tower Market Estimates and Forecasts, By Application (2020-2032) (USD Billion)
10.3.1.6 Poland
10.3.1.6.1 Poland Cooling Tower Market Estimates and Forecasts, By Product (2020-2032) (USD Billion)
10.3.1.6.2 Poland Cooling Tower Market Estimates and Forecasts, By Material (2020-2032) (USD Billion)
10.3.1.6.3 Poland Cooling Tower Market Estimates and Forecasts, By Application (2020-2032) (USD Billion)
10.3.1.7 Romania
10.3.1.7.1 Romania Cooling Tower Market Estimates and Forecasts, By Product (2020-2032) (USD Billion)
10.3.1.7.2 Romania Cooling Tower Market Estimates and Forecasts, By Material (2020-2032) (USD Billion)
10.3.1.7.3 Romania Cooling Tower Market Estimates and Forecasts, By Application (2020-2032) (USD Billion)
10.3.1.8 Hungary
10.3.1.8.1 Hungary Cooling Tower Market Estimates and Forecasts, By Product (2020-2032) (USD Billion)
10.3.1.8.2 Hungary Cooling Tower Market Estimates and Forecasts, By Material (2020-2032) (USD Billion)
10.3.1.8.3 Hungary Cooling Tower Market Estimates and Forecasts, By Application (2020-2032) (USD Billion)
10.3.1.9 Turkey
10.3.1.9.1 Turkey Cooling Tower Market Estimates and Forecasts, By Product (2020-2032) (USD Billion)
10.3.1.9.2 Turkey Cooling Tower Market Estimates and Forecasts, By Material (2020-2032) (USD Billion)
10.3.1.9.3 Turkey Cooling Tower Market Estimates and Forecasts, By Application (2020-2032) (USD Billion)
10.3.1.10 Rest of Eastern Europe
10.3.1.10.1 Rest of Eastern Europe Cooling Tower Market Estimates and Forecasts, By Product (2020-2032) (USD Billion)
10.3.1.10.2 Rest of Eastern Europe Cooling Tower Market Estimates and Forecasts, By Material (2020-2032) (USD Billion)
10.3.1.10.3 Rest of Eastern Europe Cooling Tower Market Estimates and Forecasts, By Application (2020-2032) (USD Billion)
10.3.2 Western Europe
10.3.2.1 Trends Analysis
10.3.2.2 Western Europe Cooling Tower Market Estimates and Forecasts, by Country (2020-2032) (USD Billion)
10.3.2.3 Western Europe Cooling Tower Market Estimates and Forecasts, By Product (2020-2032) (USD Billion)
10.3.2.4 Western Europe Cooling Tower Market Estimates and Forecasts, By Material (2020-2032) (USD Billion)
10.3.2.5 Western Europe Cooling Tower Market Estimates and Forecasts, By Application (2020-2032) (USD Billion)
10.3.2.6 Germany
10.3.2.6.1 Germany Cooling Tower Market Estimates and Forecasts, By Product (2020-2032) (USD Billion)
10.3.2.6.2 Germany Cooling Tower Market Estimates and Forecasts, By Material (2020-2032) (USD Billion)
10.3.2.6.3 Germany Cooling Tower Market Estimates and Forecasts, By Application (2020-2032) (USD Billion)
10.3.2.7 France
10.3.2.7.1 France Cooling Tower Market Estimates and Forecasts, By Product (2020-2032) (USD Billion)
10.3.2.7.2 France Cooling Tower Market Estimates and Forecasts, By Material (2020-2032) (USD Billion)
10.3.2.7.3 France Cooling Tower Market Estimates and Forecasts, By Application (2020-2032) (USD Billion)
10.3.2.8 UK
10.3.2.8.1 UK Cooling Tower Market Estimates and Forecasts, By Product (2020-2032) (USD Billion)
10.3.2.8.2 UK Cooling Tower Market Estimates and Forecasts, By Material (2020-2032) (USD Billion)
10.3.2.8.3 UK Cooling Tower Market Estimates and Forecasts, By Application (2020-2032) (USD Billion)
10.3.2.9 Italy
10.3.2.9.1 Italy Cooling Tower Market Estimates and Forecasts, By Product (2020-2032) (USD Billion)
10.3.2.9.2 Italy Cooling Tower Market Estimates and Forecasts, By Material (2020-2032) (USD Billion)
10.3.2.9.3 Italy Cooling Tower Market Estimates and Forecasts, By Application (2020-2032) (USD Billion)
10.3.2.10 Spain
10.3.2.10.1 Spain Cooling Tower Market Estimates and Forecasts, By Product (2020-2032) (USD Billion)
10.3.2.10.2 Spain Cooling Tower Market Estimates and Forecasts, By Material (2020-2032) (USD Billion)
10.3.2.10.3 Spain Cooling Tower Market Estimates and Forecasts, By Application (2020-2032) (USD Billion)
10.3.2.11 Netherlands
10.3.2.11.1 Netherlands Cooling Tower Market Estimates and Forecasts, By Product (2020-2032) (USD Billion)
10.3.2.11.2 Netherlands Cooling Tower Market Estimates and Forecasts, By Material (2020-2032) (USD Billion)
10.3.2.11.3 Netherlands Cooling Tower Market Estimates and Forecasts, By Application (2020-2032) (USD Billion)
10.3.2.12 Switzerland
10.3.2.12.1 Switzerland Cooling Tower Market Estimates and Forecasts, By Product (2020-2032) (USD Billion)
10.3.2.12.2 Switzerland Cooling Tower Market Estimates and Forecasts, By Material (2020-2032) (USD Billion)
10.3.2.12.3 Switzerland Cooling Tower Market Estimates and Forecasts, By Application (2020-2032) (USD Billion)
10.3.2.13 Austria
10.3.2.13.1 Austria Cooling Tower Market Estimates and Forecasts, By Product (2020-2032) (USD Billion)
10.3.2.13.2 Austria Cooling Tower Market Estimates and Forecasts, By Material (2020-2032) (USD Billion)
10.3.2.13.3 Austria Cooling Tower Market Estimates and Forecasts, By Application (2020-2032) (USD Billion)
10.3.2.14 Rest of Western Europe
10.3.2.14.1 Rest of Western Europe Cooling Tower Market Estimates and Forecasts, By Product (2020-2032) (USD Billion)
10.3.2.14.2 Rest of Western Europe Cooling Tower Market Estimates and Forecasts, By Material (2020-2032) (USD Billion)
10.3.2.14.3 Rest of Western Europe Cooling Tower Market Estimates and Forecasts, By Application (2020-2032) (USD Billion)
10.4 Asia-Pacific
10.4.1 Trends Analysis
10.4.2 Asia-Pacific Cooling Tower Market Estimates and Forecasts, by Country (2020-2032) (USD Billion)
10.4.3 Asia-Pacific Cooling Tower Market Estimates and Forecasts, By Product (2020-2032) (USD Billion)
10.4.4 Asia-Pacific Cooling Tower Market Estimates and Forecasts, By Material (2020-2032) (USD Billion)
10.4.5 Asia-Pacific Cooling Tower Market Estimates and Forecasts, By Application (2020-2032) (USD Billion)
10.4.6 China
10.4.6.1 China Cooling Tower Market Estimates and Forecasts, By Product (2020-2032) (USD Billion)
10.4.6.2 China Cooling Tower Market Estimates and Forecasts, By Material (2020-2032) (USD Billion)
10.4.6.3 China Cooling Tower Market Estimates and Forecasts, By Application (2020-2032) (USD Billion)
10.4.7 India
10.4.7.1 India Cooling Tower Market Estimates and Forecasts, By Product (2020-2032) (USD Billion)
10.4.7.2 India Cooling Tower Market Estimates and Forecasts, By Material (2020-2032) (USD Billion)
10.4.7.3 India Cooling Tower Market Estimates and Forecasts, By Application (2020-2032) (USD Billion)
10.4.8 Japan
10.4.8.1 Japan Cooling Tower Market Estimates and Forecasts, By Product (2020-2032) (USD Billion)
10.4.8.2 Japan Cooling Tower Market Estimates and Forecasts, By Material (2020-2032) (USD Billion)
10.4.8.3 Japan Cooling Tower Market Estimates and Forecasts, By Application (2020-2032) (USD Billion)
10.4.9 South Korea
10.4.9.1 South Korea Cooling Tower Market Estimates and Forecasts, By Product (2020-2032) (USD Billion)
10.4.9.2 South Korea Cooling Tower Market Estimates and Forecasts, By Material (2020-2032) (USD Billion)
10.4.9.3 South Korea Cooling Tower Market Estimates and Forecasts, By Application (2020-2032) (USD Billion)
10.4.10 Vietnam
10.4.10.1 Vietnam Cooling Tower Market Estimates and Forecasts, By Product (2020-2032) (USD Billion)
10.4.10.2 Vietnam Cooling Tower Market Estimates and Forecasts, By Material (2020-2032) (USD Billion)
10.4.10.3 Vietnam Cooling Tower Market Estimates and Forecasts, By Application (2020-2032) (USD Billion)
10.4.11 Singapore
10.4.11.1 Singapore Cooling Tower Market Estimates and Forecasts, By Product (2020-2032) (USD Billion)
10.4.11.2 Singapore Cooling Tower Market Estimates and Forecasts, By Material (2020-2032) (USD Billion)
10.4.11.3 Singapore Cooling Tower Market Estimates and Forecasts, By Application (2020-2032) (USD Billion)
10.4.12 Australia
10.4.12.1 Australia Cooling Tower Market Estimates and Forecasts, By Product (2020-2032) (USD Billion)
10.4.12.2 Australia Cooling Tower Market Estimates and Forecasts, By Material (2020-2032) (USD Billion)
10.4.12.3 Australia Cooling Tower Market Estimates and Forecasts, By Application (2020-2032) (USD Billion)
10.4.13 Rest of Asia-Pacific
10.4.13.1 Rest of Asia-Pacific Cooling Tower Market Estimates and Forecasts, By Product (2020-2032) (USD Billion)
10.4.13.2 Rest of Asia-Pacific Cooling Tower Market Estimates and Forecasts, By Material (2020-2032) (USD Billion)
10.4.13.3 Rest of Asia-Pacific Cooling Tower Market Estimates and Forecasts, By Application (2020-2032) (USD Billion)
10.5 Middle East and Africa
10.5.1 Middle East
10.5.1.1 Trends Analysis
10.5.1.2 Middle East Cooling Tower Market Estimates and Forecasts, by Country (2020-2032) (USD Billion)
10.5.1.3 Middle East Cooling Tower Market Estimates and Forecasts, By Product (2020-2032) (USD Billion)
10.5.1.4 Middle East Cooling Tower Market Estimates and Forecasts, By Material (2020-2032) (USD Billion)
10.5.1.5 Middle East Cooling Tower Market Estimates and Forecasts, By Application (2020-2032) (USD Billion)
10.5.1.6 UAE
10.5.1.6.1 UAE Cooling Tower Market Estimates and Forecasts, By Product (2020-2032) (USD Billion)
10.5.1.6.2 UAE Cooling Tower Market Estimates and Forecasts, By Material (2020-2032) (USD Billion)
10.5.1.6.3 UAE Cooling Tower Market Estimates and Forecasts, By Application (2020-2032) (USD Billion)
10.5.1.7 Egypt
10.5.1.7.1 Egypt Cooling Tower Market Estimates and Forecasts, By Product (2020-2032) (USD Billion)
10.5.1.7.2 Egypt Cooling Tower Market Estimates and Forecasts, By Material (2020-2032) (USD Billion)
10.5.1.7.3 Egypt Cooling Tower Market Estimates and Forecasts, By Application (2020-2032) (USD Billion)
10.5.1.8 Saudi Arabia
10.5.1.8.1 Saudi Arabia Cooling Tower Market Estimates and Forecasts, By Product (2020-2032) (USD Billion)
10.5.1.8.2 Saudi Arabia Cooling Tower Market Estimates and Forecasts, By Material (2020-2032) (USD Billion)
10.5.1.8.3 Saudi Arabia Cooling Tower Market Estimates and Forecasts, By Application (2020-2032) (USD Billion)
10.5.1.9 Qatar
10.5.1.9.1 Qatar Cooling Tower Market Estimates and Forecasts, By Product (2020-2032) (USD Billion)
10.5.1.9.2 Qatar Cooling Tower Market Estimates and Forecasts, By Material (2020-2032) (USD Billion)
10.5.1.9.3 Qatar Cooling Tower Market Estimates and Forecasts, By Application (2020-2032) (USD Billion)
10.5.1.10 Rest of Middle East
10.5.1.10.1 Rest of Middle East Cooling Tower Market Estimates and Forecasts, By Product (2020-2032) (USD Billion)
10.5.1.10.2 Rest of Middle East Cooling Tower Market Estimates and Forecasts, By Material (2020-2032) (USD Billion)
10.5.1.10.3 Rest of Middle East Cooling Tower Market Estimates and Forecasts, By Application (2020-2032) (USD Billion)
10.5.2 Africa
10.5.2.1 Trends Analysis
10.5.2.2 Africa Cooling Tower Market Estimates and Forecasts, by Country (2020-2032) (USD Billion)
10.5.2.3 Africa Cooling Tower Market Estimates and Forecasts, By Product (2020-2032) (USD Billion)
10.5.2.4 Africa Cooling Tower Market Estimates and Forecasts, By Material (2020-2032) (USD Billion)
10.5.2.5 Africa Cooling Tower Market Estimates and Forecasts, By Application (2020-2032) (USD Billion)
10.5.2.6 South Africa
10.5.2.6.1 South Africa Cooling Tower Market Estimates and Forecasts, By Product (2020-2032) (USD Billion)
10.5.2.6.2 South Africa Cooling Tower Market Estimates and Forecasts, By Material (2020-2032) (USD Billion)
10.5.2.6.3 South Africa Cooling Tower Market Estimates and Forecasts, By Application (2020-2032) (USD Billion)
10.5.2.7 Nigeria
10.5.2.7.1 Nigeria Cooling Tower Market Estimates and Forecasts, By Product (2020-2032) (USD Billion)
10.5.2.7.2 Nigeria Cooling Tower Market Estimates and Forecasts, By Material (2020-2032) (USD Billion)
10.5.2.7.3 Nigeria Cooling Tower Market Estimates and Forecasts, By Application (2020-2032) (USD Billion)
10.5.2.8 Rest of Africa
10.5.2.8.1 Rest of Africa Cooling Tower Market Estimates and Forecasts, By Product (2020-2032) (USD Billion)
10.5.2.8.2 Rest of Africa Cooling Tower Market Estimates and Forecasts, By Material (2020-2032) (USD Billion)
10.5.2.8.3 Rest of Africa Cooling Tower Market Estimates and Forecasts, By Application (2020-2032) (USD Billion)
10.6 Latin America
10.6.1 Trends Analysis
10.6.2 Latin America Cooling Tower Market Estimates and Forecasts, by Country (2020-2032) (USD Billion)
10.6.3 Latin America Cooling Tower Market Estimates and Forecasts, By Product (2020-2032) (USD Billion)
10.6.4 Latin America Cooling Tower Market Estimates and Forecasts, By Material (2020-2032) (USD Billion)
10.6.5 Latin America Cooling Tower Market Estimates and Forecasts, By Application (2020-2032) (USD Billion)
10.6.6 Brazil
10.6.6.1 Brazil Cooling Tower Market Estimates and Forecasts, By Product (2020-2032) (USD Billion)
10.6.6.2 Brazil Cooling Tower Market Estimates and Forecasts, By Material (2020-2032) (USD Billion)
10.6.6.3 Brazil Cooling Tower Market Estimates and Forecasts, By Application (2020-2032) (USD Billion)
10.6.7 Argentina
10.6.7.1 Argentina Cooling Tower Market Estimates and Forecasts, By Product (2020-2032) (USD Billion)
10.6.7.2 Argentina Cooling Tower Market Estimates and Forecasts, By Material (2020-2032) (USD Billion)
10.6.7.3 Argentina Cooling Tower Market Estimates and Forecasts, By Application (2020-2032) (USD Billion)
10.6.8 Colombia
10.6.8.1 Colombia Cooling Tower Market Estimates and Forecasts, By Product (2020-2032) (USD Billion)
10.6.8.2 Colombia Cooling Tower Market Estimates and Forecasts, By Material (2020-2032) (USD Billion)
10.6.8.3 Colombia Cooling Tower Market Estimates and Forecasts, By Application (2020-2032) (USD Billion)
10.6.9 Rest of Latin America
10.6.9.1 Rest of Latin America Cooling Tower Market Estimates and Forecasts, By Product (2020-2032) (USD Billion)
10.6.9.2 Rest of Latin America Cooling Tower Market Estimates and Forecasts, By Material (2020-2032) (USD Billion)
10.6.9.3 Rest of Latin America Cooling Tower Market Estimates and Forecasts, By Application (2020-2032) (USD Billion)
11. Company Profiles
11.1 SPIG S.p.A
11.1.1 Company Overview
11.1.2 Financial
11.1.3 Products/ Services Offered
11.1.4 SWOT Analysis
11.2 Absolute Cooling Tower Services Ltd.
11.2.1 Company Overview
11.2.2 Financial
11.2.3 Products/ Services Offered
11.2.4 SWOT Analysis
11.3 ESINDUS S.A (Hamon Group)
11.3.1 Company Overview
11.3.2 Financial
11.3.3 Products/ Services Offered
11.3.4 SWOT Analysis
11.4 Paharpur Cooling Towers Limited
11.4.1 Company Overview
11.4.2 Financial
11.4.3 Products/ Services Offered
11.4.4 SWOT Analysis
11.5 FANS a.s.
11.5.1 Company Overview
11.5.2 Financial
11.5.3 Products/ Services Offered
11.5.4 SWOT Analysis
11.6 LIANG CHI INDUSTRY (THAILAND) CO., LTD.
11.6.1 Company Overview
11.6.2 Financial
11.6.3 Products/ Services Offered
11.6.4 SWOT Analysis
11.7 Delta Cooling Towers, Inc.
11.7.1 Company Overview
11.7.2 Financial
11.7.3 Products/ Services Offered
11.7.4 SWOT Analysis
11.8 SPX Corporation
11.8.1 Company Overview
11.8.2 Financial
11.8.3 Products/ Services Offered
11.8.4 SWOT Analysis
11.9 Cooling Tower Depot, Inc.
11.9.1 Company Overview
11.9.2 Financial
11.9.3 Products/ Services Offered
11.9.4 SWOT Analysis
11.10 Superchill Australia Pty Ltd
11.10.1 Company Overview
11.10.2 Financial
11.10.3 Products/ Services Offered
11.10.4 SWOT Analysis
12. Use Cases and Best Practices
13. Conclusion
An accurate research report requires proper strategizing as well as implementation. There are multiple factors involved in the completion of good and accurate research report and selecting the best methodology to compete the research is the toughest part. Since the research reports we provide play a crucial role in any company’s decision-making process, therefore we at SNS Insider always believe that we should choose the best method which gives us results closer to reality. This allows us to reach at a stage wherein we can provide our clients best and accurate investment to output ratio.
Each report that we prepare takes a timeframe of 350-400 business hours for production. Starting from the selection of titles through a couple of in-depth brain storming session to the final QC process before uploading our titles on our website we dedicate around 350 working hours. The titles are selected based on their current market cap and the foreseen CAGR and growth.
The 5 steps process:
Step 1: Secondary Research:
Secondary Research or Desk Research is as the name suggests is a research process wherein, we collect data through the readily available information. In this process we use various paid and unpaid databases which our team has access to and gather data through the same. This includes examining of listed companies’ annual reports, Journals, SEC filling etc. Apart from this our team has access to various associations across the globe across different industries. Lastly, we have exchange relationships with various university as well as individual libraries.

Step 2: Primary Research
When we talk about primary research, it is a type of study in which the researchers collect relevant data samples directly, rather than relying on previously collected data. This type of research is focused on gaining content specific facts that can be sued to solve specific problems. Since the collected data is fresh and first hand therefore it makes the study more accurate and genuine.
We at SNS Insider have divided Primary Research into 2 parts.
Part 1 wherein we interview the KOLs of major players as well as the upcoming ones across various geographic regions. This allows us to have their view over the market scenario and acts as an important tool to come closer to the accurate market numbers. As many as 45 paid and unpaid primary interviews are taken from both the demand and supply side of the industry to make sure we land at an accurate judgement and analysis of the market.
This step involves the triangulation of data wherein our team analyses the interview transcripts, online survey responses and observation of on filed participants. The below mentioned chart should give a better understanding of the part 1 of the primary interview.

Part 2: In this part of primary research the data collected via secondary research and the part 1 of the primary research is validated with the interviews from individual consultants and subject matter experts.
Consultants are those set of people who have at least 12 years of experience and expertise within the industry whereas Subject Matter Experts are those with at least 15 years of experience behind their back within the same space. The data with the help of two main processes i.e., FGDs (Focused Group Discussions) and IDs (Individual Discussions). This gives us a 3rd party nonbiased primary view of the market scenario making it a more dependable one while collation of the data pointers.
Step 3: Data Bank Validation
Once all the information is collected via primary and secondary sources, we run that information for data validation. At our intelligence centre our research heads track a lot of information related to the market which includes the quarterly reports, the daily stock prices, and other relevant information. Our data bank server gets updated every fortnight and that is how the information which we collected using our primary and secondary information is revalidated in real time.

Step 4: QA/QC Process
After all the data collection and validation our team does a final level of quality check and quality assurance to get rid of any unwanted or undesired mistakes. This might include but not limited to getting rid of the any typos, duplication of numbers or missing of any important information. The people involved in this process include technical content writers, research heads and graphics people. Once this process is completed the title gets uploader on our platform for our clients to read it.
Step 5: Final QC/QA Process:
This is the last process and comes when the client has ordered the study. In this process a final QA/QC is done before the study is emailed to the client. Since we believe in giving our clients a good experience of our research studies, therefore, to make sure that we do not lack at our end in any way humanly possible we do a final round of quality check and then dispatch the study to the client.
By Product
Open circuit
Closed circuit
Hybrid
By Material
FRP
Steel
Concrete
Wood
HDPE
By Application
HVAC
Power Generation
Oil & Gas
Industrial
Request for Segment Customization as per your Business Requirement: Segment Customization Request
North America
US
Canada
Mexico
Europe
Eastern Europe
Poland
Romania
Hungary
Turkey
Rest of Eastern Europe
Western Europe
Germany
France
UK
Italy
Spain
Netherlands
Switzerland
Austria
Rest of Western Europe
Asia Pacific
China
India
Japan
South Korea
Vietnam
Singapore
Australia
Rest of Asia Pacific
Middle East & Africa
Middle East
UAE
Egypt
Saudi Arabia
Qatar
Rest of Middle East
Africa
Nigeria
South Africa
Rest of Africa
Latin America
Brazil
Argentina
Colombia
Rest of Latin America
Request for Country Level Research Report: Country Level Customization Request
Available Customization
With the given market data, SNS Insider offers customization as per the company’s specific needs. The following customization options are available for the report:
Detailed Volume Analysis
Criss-Cross segment analysis (e.g. Product X Application)
Competitive Product Benchmarking
Geographic Analysis
Additional countries in any of the regions
Customized Data Representation
Detailed analysis and profiling of additional market players
The Subsea Pumps Market size was valued at USD 2.35 Billion in 2023 and is now anticipated to grow to USD 5.66 Billion by 2032, displaying a compound annual growth rate (CAGR) of 10.26% during the forecast Period 2024-2032.
The Smart Elevator Market size was estimated at USD 14.75 billion in 2023 and is expected to reach USD 32.58 billion by 2032 at a CAGR of 9.21% during the forecast period of 2024-2032.
Shape Memory Alloys Market was estimated at USD 13.90 billion in 2023 and is supposed to reach USD 40.61 billion by 2032, at a CAGR of 12.65% from 2024-2032.
The Brake Lathe Machine Market Size was estimated at USD 3.08 billion in 2023 and is expected to arrive at USD 4.66 billion by 2032 with a growing CAGR of 4.7% over the forecast period 2024-2032.
The Powered Agriculture Equipment Market Size was USD 123.9 billion in 2023 and will reach USD 209.1 billion by 2032 and grow at a CAGR of 6.0 % Over the Forecast period of 2024-2032.
The Smart Air Purifier Market size was valued at USD 6.97 billion in 2023 and is expected to reach USD 17.73 billion by 2032 and grow at a CAGR of 10.97% over the forecast period 2024-2032.

Hi! Click one of our member below to chat on Phone
© 2025 All Rights Reserved by SNS Insider Pvt Ltd


