image

Control Towers Market Report Scope & Overview:

Control Towers Market Revenue Analysis

To get more information on Control Towers Market - Request Free Sample Report

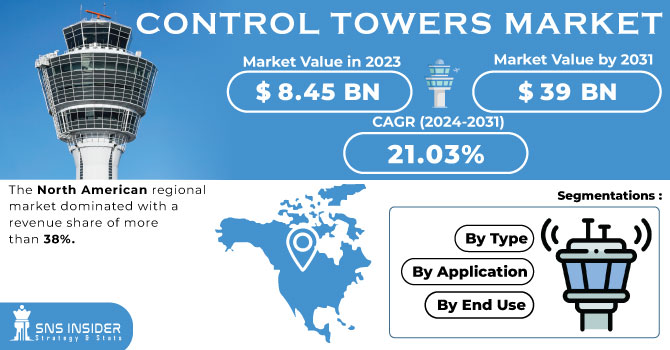
The Control Towers Market Size was esteemed at USD 8.53 billion in 2023 and is supposed to arrive at USD 51.64 billion by 2032 with a growing CAGR of 22.15% over the forecast period 2024-2032. This report offers unique insights into the Control Towers Market, focusing on key trends like the adoption of control towers, operational efficiency improvements, and technological integration across regions. It highlights the growing importance of supply chain visibility and optimization, with companies increasingly relying on advanced technologies to enhance real-time decision-making. The report also explores how organizations are leveraging control towers to reduce downtime and improve overall operational performance. By examining these trends, it provides a deeper understanding of how digital tools are transforming supply chain management for greater efficiency and responsiveness.

MARKET DYNAMICS

DRIVERS

  • The increased demand for supply chain visibility drives the control towers market by enabling businesses to track goods, monitor performance, and manage disruptions in real time.

The increased demand for supply chain visibility is a significant driver for the control towers market, as businesses strive for real-time insight into their global supply chains. As operations become more complex and interconnected, companies require tools that provide transparency and tracking power at multiple points throughout the supply chain. Control towers serve as a global dashboard for businesses to identify inventory levels, track shipments, assess supplier performance, and evaluate potential disruptions, allowing for advance action. With end-to-end visibility and real-time access to every link in the supply chain, businesses can pinpoint potential bottlenecks, and anticipate and rectify problems before they become serious. Enhanced visibility enables organizations to streamline processes, make faster decisions, and reduce risks to better serve customers. In a world of global sourcing and fast-moving markets, it has become essential to maintain visibility in the supply chain to ensure operational efficiency, delivery timelines, and a competitive edge.

RESTRAINT

  • High initial implementation costs of control tower solutions, including software, infrastructure, and training, can be a significant barrier for SMEs with limited budgets.

The high initial implementation costs of control tower solutions can be a significant barrier, especially for small and medium-sized enterprises (SMEs). Many of these solutions come with a high cost associated with the software, infrastructure, and technology platforms, ranging from cloud solutions to analytics solutions, as well as hardware to manage the next generation of data. Training staff to use these systems also incurs costs, and potentially also consultants' fees for system integration and customization. For SMEs with narrow budgets, it can be prohibitive in the beginning to invest in the same, especially when the long-term benefits like operational efficiency and risk management are not clear and crystal. Consequently, many smaller organizations are likely to defer or not adopt control tower solutions at all in favor of lower-end, lower-cost alternatives. This financial barrier may preclude them from attaining the competitive advantages that increased supply chain visibility and automation can deliver.

OPPORTUNITIES

  • Advancements in AI, machine learning, and predictive analytics enable control towers to provide proactive decision-making, optimizing supply chain operations.

Advancements in AI, machine learning, and predictive analytics are revolutionizing control tower solutions by enabling more sophisticated decision-making and supply chain optimization. These technologies enable control towers to process large volumes of real-time data, identify trends, and forecast potential disruptions allowing businesses to gain a proactive edge. With machine learning algorithms, forecasts can improve in accuracy over time, optimizing elements like transportation routes, demand planning, and inventory levels. Another aspect of AI is giving businesses tools to better leverage actionable insights. Consequently, businesses can improve their operating efficiency, cut costs, and address risks before they become more significant issues. Moreover, predictive analytics facilitates real-time supply chain activity monitoring so that potential problems can be detected and resolved before they become serious. By harnessing the power of historical data, these intelligent technologies offer an adaptive, predictive control tower solution that promotes not only smarter decision-making but more agile supply chains as well.

CHALLENGES

  • Customization of control tower solutions is costly and time-consuming due to the need to address unique supply chain requirements across industries.

Customization needs in the control tower market arise because every organization and industry operates with distinct supply chain complexities. Unique considerations for product types, regional logistics, suppliers, and regulatory requirements per sector make a one-size-fits-all approach impractical. If off-the-shelf control tower solutions provide some standard features, they simply do not address these operational specifics. Customizing a solution to an organization’s needs requires considerable time and resource investment. It means getting familiar with the client’s functions, integrating with systems that already exist, and making the software flexible for particular workflows. This customization process requires further training, support, and system testing and increases costs. This level of tailored solution is even more vital when it comes to industries with extremely specific requirements, such as pharmaceuticals or aerospace. Therefore, while customization offers improved alignment with business goals, it can be both time-consuming and costly, posing challenges for many businesses.

SEGMENTATION ANALYSIS

By Type

The Operational segment dominated with a market share of over 81% in 2023, because it enables real-time decision-making, which is crucial for efficient supply chain management. Operational control towers provide an end-to-end view of all the contractual commitments between a business and its suppliers, with real-time information that enables a company to track goods in transit, as well as monitor and manage its inventories and logistics. This enables organizations to promptly detect and address issues like delays, stockouts, or disruptions, and make necessary adjustments to plans. For businesses wishing to enhance supply chain performance, reduce costs, and improve customer satisfaction, the ability to manage day-to-day activities efficiently is essential. As such, many industries have widely deployed operational control towers to ensure their supply chains run seamlessly, efficiently, and responsively.

By Application

The Supply Chain segment dominated with a market share of over 68% in 2023, due to the increasing need for businesses to achieve end-to-end visibility and optimize complex supply chain operations. In the face of these challenges and the necessity for organizations to optimize their global networks, manage inventory better, forecast demand accurately, and collaborate seamlessly with suppliers, control tower solutions are the answer. They come with real-time information, predictive analytics, and proactive decision-making capabilities that help companies quickly respond to disruptions, cutting down costs, and enhancing customer satisfaction. Supply Chain application soared to the top of the list as one of the most in-control data solutions as supply chains become more complicated and global, as everyone ensures that every part of the supply chain can be fully accounted for by to end customer. This trend is expected to continue as companies prioritize efficiency and resilience in their supply chain strategies.

By End Use

The Healthcare segment dominated with a market share of over 38% in 2023, due to its reliance on efficient and real-time supply chain visibility to ensure the timely delivery of medical supplies, pharmaceuticals, and equipment. The supply chain is particularly opaque due to factors such as strict government regulations, temperature-sensitive logistics, and the requirement to monitor the flow of paramount materials. Control towers empower healthcare organizations to keep track of inventory levels, transportation, and disruptions that could compromise patient safety or regulatory compliance. The growing demand for healthcare, coupled with the complex global landscape of the pharmaceutical supply chain, propels the deployment of these control tower solutions to improve operations, prevent waste, and foster real-time decision-making. As such, healthcare is an important industry for the development of control tower technology.

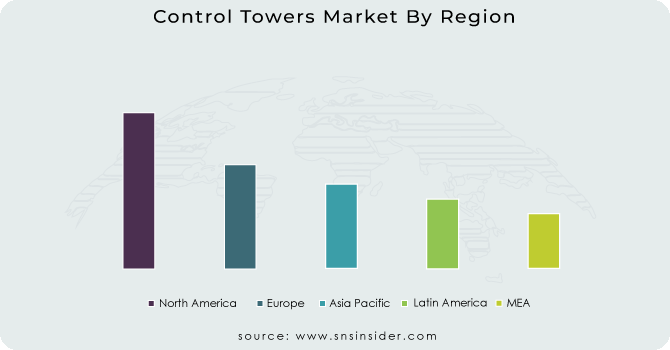
KEY REGIONAL ANALYSIS

North America region dominated with a market share of over 38% in 2023, primarily due to the region's advanced technological infrastructure, high adoption of digital solutions, and the presence of key players in supply chain management. North America has witnessed a surge in companies adopting control tower solutions to improve visibility, streamline operations, and make better decisions. Dynamics of industries like retail, manufacturing, and healthcare are also boosting market growth for risk management, regulatory compliance, and logistics efficiency. And with a mature e-commerce segment in the region, there is an increasing demand for integrated supply chain solutions. Emphasis on innovation and automation in the U.S. and Canada has helped North America maintain its commanding position in the market.

The Asia-Pacific region is the fastest-growing market for control towers, primarily due to rapid digital transformation and evolving supply chain complexities. The demand for supply chain transparency will grow, especially as countries like China and India, as well as Southeast Asian nations, industrialize rapidly and urbanize. What the Control Tower solutions do is address these challenges and present real-time tracking, predictive analytics, and optimization tools that enhance decision-making. Moreover, the evolution of technology trends, such as the rise of e-commerce, the increase in artificial intelligence (AI), the Internet of Things (IoT), and cloud computing is also driving up the demand for control tower solutions. With the region growing both in terms of manufacturing and trade, organizations are turning to control towers to better navigate the increasingly complex multi-tier supply chain and gain a competitive advantage.

Control-Towers-Market-By-Region

Need any customization research on Control Towers Market - Enquiry Now

Some of the major key players in the Control Towers Market

  • Elementum (Supply Chain Orchestration Platform)
  • Blue Yonder Group (Luminate Control Tower)
  • INFOR (Infor Nexus Control Center)
  • DiLX (LogiControl Tower)
  • One Network Enterprises (Real Time Value Network)
  • ORTEC (ORTEC Control Tower)
  • KINAXIS (RapidResponse Control Tower)
  • Viewlocity Technologies Pty Ltd (Viewlocity Control Tower Solutions)
  • Coupa Software Inc. (Coupa Supply Chain Control Tower)
  • o9 Solutions (o9 Digital Brain)
  • E2open (E2open Control Tower)
  • SAP SE (SAP Logistics Business Network Control Tower)
  • PearlChain (PearlChain Control Tower)
  • IBM (IBM Sterling Supply Chain Control Tower)
  • Oracle (Oracle Transportation Management Control Tower)
  • Manhattan Associates (Manhattan Active Supply Chain Control Tower)
  • Cisco Systems (Cisco IoT Control Center)
  • GE Digital (Predix Supply Chain Control Tower)
  • Tata Consultancy Services (TCS) (TCS Digital Supply Chain Control Tower)
  • Descartes Systems Group (Descartes Macropoint Control Tower)

Suppliers for (AI-driven supply chain solutions, offering predictive analytics and real-time decision-making) on Control Towers Market

  • Blue Yonder Group, Inc.
  • SAP SE
  • E2open, LLC
  • Coupa Software Inc.
  • Kinaxis Inc.
  • Infor, Inc.
  • o9 Solutions, Inc.
  • Manhattan Associates, Inc.
  • One Network Enterprises
  • Oracle Corporation

Elementum-Company Financial Analysis

Company Landscape Analysis


RECENT DEVELOPMENT

In February 12, 2025: Cisco’s AI solutions, like N9300 Smart Switches and Hybrid Mesh Firewall, align with market control towers by enhancing visibility, security, and decision-making. Cisco’s focus on AI skilling helps businesses manage AI-driven environments, similar to control tower optimization in dynamic markets.

In August 1, 2024: Blue Yonder's acquisition of One Network Enterprises enhanced its supply chain solutions by offering real-time, multi-enterprise collaboration and AI-powered insights. This aligns with the market trend of increasing demand for digital control towers to improve supply chain visibility, agility, and decision-making.

Control Towers Market Report Scope:

Report Attributes Details
Market Size in 2023 USD 8.53 Billion
Market Size by 2032 USD 51.64 Billion
CAGR CAGR of 22.15%  From 2024 to 2032
Base Year 2023
Forecast Period 2024-2032
Historical Data 2020-2022
Report Scope & Coverage Market Size, Segments Analysis, Competitive  Landscape, Regional Analysis, DROC & SWOT Analysis, Forecast Outlook
Key Segments • By Type (Analytical, Operational)
• By Application (Supply Chain, Transportation)
• By End Use (Aerospace & Defense, Chemicals, Retail & Consumer Goods, Healthcare, Manufacturing, High Technology Products, Others)
Regional Analysis/Coverage North America (US, Canada, Mexico), Europe (Eastern Europe [Poland, Romania, Hungary, Turkey, Rest of Eastern Europe] Western Europe] Germany, France, UK, Italy, Spain, Netherlands, Switzerland, Austria, Rest of Western Europe]), Asia Pacific (China, India, Japan, South Korea, Vietnam, Singapore, Australia, Rest of Asia Pacific), Middle East & Africa (Middle East [UAE, Egypt, Saudi Arabia, Qatar, Rest of Middle East], Africa [Nigeria, South Africa, Rest of Africa], Latin America (Brazil, Argentina, Colombia, Rest of Latin America)
Company Profiles Elementum, Blue Yonder Group, INFOR, DiLX, One Network Enterprises, ORTEC, KINAXIS, Viewlocity Technologies Pty Ltd, Coupa Software Inc., o9 Solutions, E2open, SAP SE, PearlChain, IBM, Oracle, Manhattan Associates, Cisco Systems, GE Digital, Tata Consultancy Services (TCS), Descartes Systems Group.


Frequently Asked Questions

 Ans: North America dominated the Control Towers Market in 2023

Ans: The “Operational” segment dominated the Control Towers Market.

Ans: The increased demand for supply chain visibility drives the control towers market by enabling businesses to track goods, monitor performance, and manage disruptions in real time.

Ans: The Control Towers Market was USD 8.53 billion in 2023 and is expected to Reach USD 51.64 billion by 2032.

 Ans:  The Control Towers Market is expected to grow at a CAGR of 22.15% during 2024-2032.

TABLE OF CONTENT

1. Introduction

1.1 Market Definition

1.2 Scope (Inclusion and Exclusions)

1.3 Research Assumptions

2. Executive Summary

2.1 Market Overview

2.2 Regional Synopsis

2.3 Competitive Summary

3. Research Methodology

3.1 Top-Down Approach

3.2 Bottom-up Approach

3.3. Data Validation

3.4 Primary Interviews

4. Market Dynamics

4.1 Market Analysis

4.1.1 Drivers

4.1.2 Restraints

4.1.3 Opportunities

4.1.4 Challenges

4.2 PESTLE Analysis

4.3 Porter’s Five Forces Model

5. Statistical Insights and Trends Reporting

5.1 Market Size & Growth, by Region (2020-2023)

5.2 Control Tower Adoption Rates, by Region (2020-2023)

5.3 Supply Chain Visibility & Optimization Metrics

5.4 Operational Efficiency & Downtime Trends

5.5 Technological Integration in Control Towers, by Region

6. Competitive Landscape

6.1 List of Major Companies, By Region

6.2 Market Share Analysis, By Region

6.3 Product Benchmarking

6.3.1 Product specifications and features

6.3.2 Pricing

6.4 Strategic Initiatives

6.4.1 Marketing and promotional activities

6.4.2 Distribution and Supply Chain Strategies

6.4.3 Expansion plans and new product launches

6.4.4 Strategic partnerships and collaborations

6.5 Technological Advancements

6.6 Market Positioning and Branding

7. Control Towers Market Segmentation, By Type

7.1 Chapter Overview

7.2 Analytical

7.2.1 Analytical Market Trends Analysis (2020-2032)

7.2.2 Analytical Market Size Estimates and Forecasts to 2032 (USD Billion)

7.3 Operational

7.3.1 Operational Market Trends Analysis (2020-2032)

7.3.2 Operational Market Size Estimates and Forecasts to 2032 (USD Billion)

8. Control Towers Market Segmentation, By Application

8.1 Chapter Overview

8.2 Supply Chain

8.2.1 Supply Chain Market Trends Analysis (2020-2032)

8.2.2 Supply Chain Market Size Estimates and Forecasts to 2032 (USD Billion)

8.3 Transportation

8.3.1 Transportation Market Trends Analysis (2020-2032)

8.3.2 Transportation Market Size Estimates and Forecasts to 2032 (USD Billion)

9. Control Towers Market Segmentation, By End Use

9.1 Chapter Overview

9.2 Aerospace & Defense

9.2.1 Aerospace & Defense Market Trends Analysis (2020-2032)

9.2.2 Aerospace & Defense Market Size Estimates and Forecasts to 2032 (USD Billion)

9.3 Chemicals

9.3.1 Chemicals Market Trends Analysis (2020-2032)

9.3.2 Chemicals Market Size Estimates and Forecasts to 2032 (USD Billion)

9.4 Retail & Consumer Goods

9.4.1 Retail & Consumer Goods Market Trends Analysis (2020-2032)

9.4.2 Retail & Consumer Goods Market Size Estimates and Forecasts to 2032 (USD Billion)

9.5 Healthcare

9.5.1 Healthcare Market Trends Analysis (2020-2032)

9.5.2 Healthcare Market Size Estimates and Forecasts to 2032 (USD Billion)

9.6 Manufacturing

9.6.1 Manufacturing Market Trends Analysis (2020-2032)

9.6.2 Manufacturing Market Size Estimates and Forecasts to 2032 (USD Billion)

9.7 High Technology Products

9.7.1 High Technology Products Market Trends Analysis (2020-2032)

9.7.2 High Technology Products Market Size Estimates and Forecasts to 2032 (USD Billion)

9.8 Others

9.8.1 Others Market Trends Analysis (2020-2032)

9.8.2 Others Market Size Estimates and Forecasts to 2032 (USD Billion)

10. Regional Analysis

10.1 Chapter Overview

10.2 North America

10.2.1 Trends Analysis

10.2.2 North America Control Towers Market Estimates and Forecasts, by Country (2020-2032) (USD Billion)

10.2.3 North America Control Towers Market Estimates and Forecasts, By Type (2020-2032) (USD Billion) 

10.2.4 North America Control Towers Market Estimates and Forecasts, By Application (2020-2032) (USD Billion)

10.2.5 North America Control Towers Market Estimates and Forecasts, By End Use (2020-2032) (USD Billion)

10.2.6 USA

10.2.6.1 USA Control Towers Market Estimates and Forecasts, By Type (2020-2032) (USD Billion)

10.2.6.2 USA Control Towers Market Estimates and Forecasts, By Application (2020-2032) (USD Billion)

10.2.6.3 USA Control Towers Market Estimates and Forecasts, By End Use (2020-2032) (USD Billion)

10.2.7 Canada

10.2.7.1 Canada Control Towers Market Estimates and Forecasts, By Type (2020-2032) (USD Billion)

10.2.7.2 Canada Control Towers Market Estimates and Forecasts, By Application (2020-2032) (USD Billion)

10.2.7.3 Canada Control Towers Market Estimates and Forecasts, By End Use (2020-2032) (USD Billion)

10.2.8 Mexico

10.2.8.1 Mexico Control Towers Market Estimates and Forecasts, By Type (2020-2032) (USD Billion)

10.2.8.2 Mexico Control Towers Market Estimates and Forecasts, By Application (2020-2032) (USD Billion)

10.2.8.3 Mexico Control Towers Market Estimates and Forecasts, By End Use (2020-2032) (USD Billion)

10.3 Europe

10.3.1 Eastern Europe

10.3.1.1 Trends Analysis

10.3.1.2 Eastern Europe Control Towers Market Estimates and Forecasts, by Country (2020-2032) (USD Billion)

10.3.1.3 Eastern Europe Control Towers Market Estimates and Forecasts, By Type (2020-2032) (USD Billion) 

10.3.1.4 Eastern Europe Control Towers Market Estimates and Forecasts, By Application (2020-2032) (USD Billion)

10.3.1.5 Eastern Europe Control Towers Market Estimates and Forecasts, By End Use (2020-2032) (USD Billion)

10.3.1.6 Poland

10.3.1.6.1 Poland Control Towers Market Estimates and Forecasts, By Type (2020-2032) (USD Billion)

10.3.1.6.2 Poland Control Towers Market Estimates and Forecasts, By Application (2020-2032) (USD Billion)

10.3.1.6.3 Poland Control Towers Market Estimates and Forecasts, By End Use (2020-2032) (USD Billion)

10.3.1.7 Romania

10.3.1.7.1 Romania Control Towers Market Estimates and Forecasts, By Type (2020-2032) (USD Billion)

10.3.1.7.2 Romania Control Towers Market Estimates and Forecasts, By Application (2020-2032) (USD Billion)

10.3.1.7.3 Romania Control Towers Market Estimates and Forecasts, By End Use (2020-2032) (USD Billion)

10.3.1.8 Hungary

10.3.1.8.1 Hungary Control Towers Market Estimates and Forecasts, By Type (2020-2032) (USD Billion)

10.3.1.8.2 Hungary Control Towers Market Estimates and Forecasts, By Application (2020-2032) (USD Billion)

10.3.1.8.3 Hungary Control Towers Market Estimates and Forecasts, By End Use (2020-2032) (USD Billion)

10.3.1.9 Turkey

10.3.1.9.1 Turkey Control Towers Market Estimates and Forecasts, By Type (2020-2032) (USD Billion)

10.3.1.9.2 Turkey Control Towers Market Estimates and Forecasts, By Application (2020-2032) (USD Billion)

10.3.1.9.3 Turkey Control Towers Market Estimates and Forecasts, By End Use (2020-2032) (USD Billion)

10.3.1.10 Rest of Eastern Europe

10.3.1.10.1 Rest of Eastern Europe Control Towers Market Estimates and Forecasts, By Type (2020-2032) (USD Billion)

10.3.1.10.2 Rest of Eastern Europe Control Towers Market Estimates and Forecasts, By Application (2020-2032) (USD Billion)

10.3.1.10.3 Rest of Eastern Europe Control Towers Market Estimates and Forecasts, By End Use (2020-2032) (USD Billion)

10.3.2 Western Europe

10.3.2.1 Trends Analysis

10.3.2.2 Western Europe Control Towers Market Estimates and Forecasts, by Country (2020-2032) (USD Billion)

10.3.2.3 Western Europe Control Towers Market Estimates and Forecasts, By Type (2020-2032) (USD Billion) 

10.3.2.4 Western Europe Control Towers Market Estimates and Forecasts, By Application (2020-2032) (USD Billion)

10.3.2.5 Western Europe Control Towers Market Estimates and Forecasts, By End Use (2020-2032) (USD Billion)

10.3.2.6 Germany

10.3.2.6.1 Germany Control Towers Market Estimates and Forecasts, By Type (2020-2032) (USD Billion)

10.3.2.6.2 Germany Control Towers Market Estimates and Forecasts, By Application (2020-2032) (USD Billion)

10.3.2.6.3 Germany Control Towers Market Estimates and Forecasts, By End Use (2020-2032) (USD Billion)

10.3.2.7 France

10.3.2.7.1 France Control Towers Market Estimates and Forecasts, By Type (2020-2032) (USD Billion)

10.3.2.7.2 France Control Towers Market Estimates and Forecasts, By Application (2020-2032) (USD Billion)

10.3.2.7.3 France Control Towers Market Estimates and Forecasts, By End Use (2020-2032) (USD Billion)

10.3.2.8 UK

10.3.2.8.1 UK Control Towers Market Estimates and Forecasts, By Type (2020-2032) (USD Billion)

10.3.2.8.2 UK Control Towers Market Estimates and Forecasts, By Application (2020-2032) (USD Billion)

10.3.2.8.3 UK Control Towers Market Estimates and Forecasts, By End Use (2020-2032) (USD Billion)

10.3.2.9 Italy

10.3.2.9.1 Italy Control Towers Market Estimates and Forecasts, By Type (2020-2032) (USD Billion)

10.3.2.9.2 Italy Control Towers Market Estimates and Forecasts, By Application (2020-2032) (USD Billion)

10.3.2.9.3 Italy Control Towers Market Estimates and Forecasts, By End Use (2020-2032) (USD Billion)

10.3.2.10 Spain

10.3.2.10.1 Spain Control Towers Market Estimates and Forecasts, By Type (2020-2032) (USD Billion)

10.3.2.10.2 Spain Control Towers Market Estimates and Forecasts, By Application (2020-2032) (USD Billion)

10.3.2.10.3 Spain Control Towers Market Estimates and Forecasts, By End Use (2020-2032) (USD Billion)

10.3.2.11 Netherlands

10.3.2.11.1 Netherlands Control Towers Market Estimates and Forecasts, By Type (2020-2032) (USD Billion)

10.3.2.11.2 Netherlands Control Towers Market Estimates and Forecasts, By Application (2020-2032) (USD Billion)

10.3.2.11.3 Netherlands Control Towers Market Estimates and Forecasts, By End Use (2020-2032) (USD Billion)

10.3.2.12 Switzerland

10.3.2.12.1 Switzerland Control Towers Market Estimates and Forecasts, By Type (2020-2032) (USD Billion)

10.3.2.12.2 Switzerland Control Towers Market Estimates and Forecasts, By Application (2020-2032) (USD Billion)

10.3.2.12.3 Switzerland Control Towers Market Estimates and Forecasts, By End Use (2020-2032) (USD Billion)

10.3.2.13 Austria

10.3.2.13.1 Austria Control Towers Market Estimates and Forecasts, By Type (2020-2032) (USD Billion)

10.3.2.13.2 Austria Control Towers Market Estimates and Forecasts, By Application (2020-2032) (USD Billion)

10.3.2.13.3 Austria Control Towers Market Estimates and Forecasts, By End Use (2020-2032) (USD Billion)

10.3.2.14 Rest of Western Europe

10.3.2.14.1 Rest of Western Europe Control Towers Market Estimates and Forecasts, By Type (2020-2032) (USD Billion)

10.3.2.14.2 Rest of Western Europe Control Towers Market Estimates and Forecasts, By Application (2020-2032) (USD Billion)

10.3.2.14.3 Rest of Western Europe Control Towers Market Estimates and Forecasts, By End Use (2020-2032) (USD Billion)

10.4 Asia-Pacific

10.4.1 Trends Analysis

10.4.2 Asia-Pacific Control Towers Market Estimates and Forecasts, by Country (2020-2032) (USD Billion)

10.4.3 Asia-Pacific Control Towers Market Estimates and Forecasts, By Type (2020-2032) (USD Billion) 

10.4.4 Asia-Pacific Control Towers Market Estimates and Forecasts, By Application (2020-2032) (USD Billion)

10.4.5 Asia-Pacific Control Towers Market Estimates and Forecasts, By End Use (2020-2032) (USD Billion)

10.4.6 China

10.4.6.1 China Control Towers Market Estimates and Forecasts, By Type (2020-2032) (USD Billion)

10.4.6.2 China Control Towers Market Estimates and Forecasts, By Application (2020-2032) (USD Billion)

10.4.6.3 China Control Towers Market Estimates and Forecasts, By End Use (2020-2032) (USD Billion)

10.4.7 India

10.4.7.1 India Control Towers Market Estimates and Forecasts, By Type (2020-2032) (USD Billion)

10.4.7.2 India Control Towers Market Estimates and Forecasts, By Application (2020-2032) (USD Billion)

10.4.7.3 India Control Towers Market Estimates and Forecasts, By End Use (2020-2032) (USD Billion)

10.4.8 Japan

10.4.8.1 Japan Control Towers Market Estimates and Forecasts, By Type (2020-2032) (USD Billion)

10.4.8.2 Japan Control Towers Market Estimates and Forecasts, By Application (2020-2032) (USD Billion)

10.4.8.3 Japan Control Towers Market Estimates and Forecasts, By End Use (2020-2032) (USD Billion)

10.4.9 South Korea

10.4.9.1 South Korea Control Towers Market Estimates and Forecasts, By Type (2020-2032) (USD Billion)

10.4.9.2 South Korea Control Towers Market Estimates and Forecasts, By Application (2020-2032) (USD Billion)

10.4.9.3 South Korea Control Towers Market Estimates and Forecasts, By End Use (2020-2032) (USD Billion)

10.4.10 Vietnam

10.4.10.1 Vietnam Control Towers Market Estimates and Forecasts, By Type (2020-2032) (USD Billion)

10.4.10.2 Vietnam Control Towers Market Estimates and Forecasts, By Application (2020-2032) (USD Billion)

10.4.10.3 Vietnam Control Towers Market Estimates and Forecasts, By End Use (2020-2032) (USD Billion)

10.4.11 Singapore

10.4.11.1 Singapore Control Towers Market Estimates and Forecasts, By Type (2020-2032) (USD Billion)

10.4.11.2 Singapore Control Towers Market Estimates and Forecasts, By Application (2020-2032) (USD Billion)

10.4.11.3 Singapore Control Towers Market Estimates and Forecasts, By End Use (2020-2032) (USD Billion)

10.4.12 Australia

10.4.12.1 Australia Control Towers Market Estimates and Forecasts, By Type (2020-2032) (USD Billion)

10.4.12.2 Australia Control Towers Market Estimates and Forecasts, By Application (2020-2032) (USD Billion)

10.4.12.3 Australia Control Towers Market Estimates and Forecasts, By End Use (2020-2032) (USD Billion)

10.4.13 Rest of Asia-Pacific

10.4.13.1 Rest of Asia-Pacific Control Towers Market Estimates and Forecasts, By Type (2020-2032) (USD Billion)

10.4.13.2 Rest of Asia-Pacific Control Towers Market Estimates and Forecasts, By Application (2020-2032) (USD Billion)

10.4.13.3 Rest of Asia-Pacific Control Towers Market Estimates and Forecasts, By End Use (2020-2032) (USD Billion)

10.5 Middle East and Africa

10.5.1 Middle East

10.5.1.1 Trends Analysis

10.5.1.2 Middle East Control Towers Market Estimates and Forecasts, by Country (2020-2032) (USD Billion)

10.5.1.3 Middle East Control Towers Market Estimates and Forecasts, By Type (2020-2032) (USD Billion) 

10.5.1.4 Middle East Control Towers Market Estimates and Forecasts, By Application (2020-2032) (USD Billion)

10.5.1.5 Middle East Control Towers Market Estimates and Forecasts, By End Use (2020-2032) (USD Billion)

10.5.1.6 UAE

10.5.1.6.1 UAE Control Towers Market Estimates and Forecasts, By Type (2020-2032) (USD Billion)

10.5.1.6.2 UAE Control Towers Market Estimates and Forecasts, By Application (2020-2032) (USD Billion)

10.5.1.6.3 UAE Control Towers Market Estimates and Forecasts, By End Use (2020-2032) (USD Billion)

10.5.1.7 Egypt

10.5.1.7.1 Egypt Control Towers Market Estimates and Forecasts, By Type (2020-2032) (USD Billion)

10.5.1.7.2 Egypt Control Towers Market Estimates and Forecasts, By Application (2020-2032) (USD Billion)

10.5.1.7.3 Egypt Control Towers Market Estimates and Forecasts, By End Use (2020-2032) (USD Billion)

10.5.1.8 Saudi Arabia

10.5.1.8.1 Saudi Arabia Control Towers Market Estimates and Forecasts, By Type (2020-2032) (USD Billion)

10.5.1.8.2 Saudi Arabia Control Towers Market Estimates and Forecasts, By Application (2020-2032) (USD Billion)

10.5.1.8.3 Saudi Arabia Control Towers Market Estimates and Forecasts, By End Use (2020-2032) (USD Billion)

10.5.1.9 Qatar

10.5.1.9.1 Qatar Control Towers Market Estimates and Forecasts, By Type (2020-2032) (USD Billion)

10.5.1.9.2 Qatar Control Towers Market Estimates and Forecasts, By Application (2020-2032) (USD Billion)

10.5.1.9.3 Qatar Control Towers Market Estimates and Forecasts, By End Use (2020-2032) (USD Billion)

10.5.1.10 Rest of Middle East

10.5.1.10.1 Rest of Middle East Control Towers Market Estimates and Forecasts, By Type (2020-2032) (USD Billion)

10.5.1.10.2 Rest of Middle East Control Towers Market Estimates and Forecasts, By Application (2020-2032) (USD Billion)

10.5.1.10.3 Rest of Middle East Control Towers Market Estimates and Forecasts, By End Use (2020-2032) (USD Billion)

10.5.2 Africa

10.5.2.1 Trends Analysis

10.5.2.2 Africa Control Towers Market Estimates and Forecasts, by Country (2020-2032) (USD Billion)

10.5.2.3 Africa Control Towers Market Estimates and Forecasts, By Type (2020-2032) (USD Billion) 

10.5.2.4 Africa Control Towers Market Estimates and Forecasts, By Application (2020-2032) (USD Billion)

10.5.2.5 Africa Control Towers Market Estimates and Forecasts, By End Use (2020-2032) (USD Billion)

10.5.2.6 South Africa

10.5.2.6.1 South Africa Control Towers Market Estimates and Forecasts, By Type (2020-2032) (USD Billion)

10.5.2.6.2 South Africa Control Towers Market Estimates and Forecasts, By Application (2020-2032) (USD Billion)

10.5.2.6.3 South Africa Control Towers Market Estimates and Forecasts, By End Use (2020-2032) (USD Billion)

10.5.2.7 Nigeria

10.5.2.7.1 Nigeria Control Towers Market Estimates and Forecasts, By Type (2020-2032) (USD Billion)

10.5.2.7.2 Nigeria Control Towers Market Estimates and Forecasts, By Application (2020-2032) (USD Billion)

10.5.2.7.3 Nigeria Control Towers Market Estimates and Forecasts, By End Use (2020-2032) (USD Billion)

10.5.2.8 Rest of Africa

10.5.2.8.1 Rest of Africa Control Towers Market Estimates and Forecasts, By Type (2020-2032) (USD Billion)

10.5.2.8.2 Rest of Africa Control Towers Market Estimates and Forecasts, By Application (2020-2032) (USD Billion)

10.5.2.8.3 Rest of Africa Control Towers Market Estimates and Forecasts, By End Use (2020-2032) (USD Billion)

10.6 Latin America

10.6.1 Trends Analysis

10.6.2 Latin America Control Towers Market Estimates and Forecasts, by Country (2020-2032) (USD Billion)

10.6.3 Latin America Control Towers Market Estimates and Forecasts, By Type (2020-2032) (USD Billion) 

10.6.4 Latin America Control Towers Market Estimates and Forecasts, By Application (2020-2032) (USD Billion)

10.6.5 Latin America Control Towers Market Estimates and Forecasts, By End Use (2020-2032) (USD Billion)

10.6.6 Brazil

10.6.6.1 Brazil Control Towers Market Estimates and Forecasts, By Type (2020-2032) (USD Billion)

10.6.6.2 Brazil Control Towers Market Estimates and Forecasts, By Application (2020-2032) (USD Billion)

10.6.6.3 Brazil Control Towers Market Estimates and Forecasts, By End Use (2020-2032) (USD Billion)

10.6.7 Argentina

10.6.7.1 Argentina Control Towers Market Estimates and Forecasts, By Type (2020-2032) (USD Billion)

10.6.7.2 Argentina Control Towers Market Estimates and Forecasts, By Application (2020-2032) (USD Billion)

10.6.7.3 Argentina Control Towers Market Estimates and Forecasts, By End Use (2020-2032) (USD Billion)

10.6.8 Colombia

10.6.8.1 Colombia Control Towers Market Estimates and Forecasts, By Type (2020-2032) (USD Billion)

10.6.8.2 Colombia Control Towers Market Estimates and Forecasts, By Application (2020-2032) (USD Billion)

10.6.8.3 Colombia Control Towers Market Estimates and Forecasts, By End Use (2020-2032) (USD Billion)

10.6.9 Rest of Latin America

10.6.9.1 Rest of Latin America Control Towers Market Estimates and Forecasts, By Type (2020-2032) (USD Billion)

10.6.9.2 Rest of Latin America Control Towers Market Estimates and Forecasts, By Application (2020-2032) (USD Billion)

10.6.9.3 Rest of Latin America Control Towers Market Estimates and Forecasts, By End Use (2020-2032) (USD Billion)

11. Company Profiles

11.1 One Network Enterprises

11.1.1 Company Overview

11.1.2 Financial

11.1.3 Products/ Services Offered

11.1.4 SWOT Analysis

11.2 Kinaxis

             11.2.1 Company Overview

11.2.2 Financial

11.2.3 Products/ Services Offered

11.2.4 SWOT Analysis

11.3 Viewlocity Technologies Pty Ltd.

11.3.1 Company Overview

11.3.2 Financial

11.3.3 Products/ Services Offered

11.3.4 SWOT Analysis

11.4 E2open, LLC

11.4.1 Company Overview

11.4.2 Financial

11.4.3 Products/ Services Offered

11.4.4 SWOT Analysis

11.5 Llamasoft

11.5.1 Company Overview

11.5.2 Financial

11.5.3 Products/ Services Offered

11.5.4 SWOT Analysis

11.6 Elementum

11.6.1 Company Overview

11.6.2 Financial

11.6.3 Products/ Services Offered

11.6.4 SWOT Analysis

11.7 LSAP SE

             11.7.1 Company Overview

11.7.2 Financial

11.7.3 Products/ Services Offered

11.7.4 SWOT Analysis

11.8 Infor

11.8.1 Company Overview

11.8.2 Financial

11.8.3 Products/ Services Offered

11.8.4 SWOT Analysis

11.9 PearlChain

             11.9.1 Company Overview

11.9.2 Financial

11.9.3 Products/ Services Offered

11.9.4 SWOT Analysis

11.10 Blue Yonder Group, Inc.

11.10.1 Company Overview

11.10.2 Financial

11.10.3 Products/ Services Offered

11.10.4 SWOT Analysis

12. Use Cases and Best Practices

13. Conclusion

An accurate research report requires proper strategizing as well as implementation. There are multiple factors involved in the completion of good and accurate research report and selecting the best methodology to compete the research is the toughest part. Since the research reports we provide play a crucial role in any company’s decision-making process, therefore we at SNS Insider always believe that we should choose the best method which gives us results closer to reality. This allows us to reach at a stage wherein we can provide our clients best and accurate investment to output ratio.

Each report that we prepare takes a timeframe of 350-400 business hours for production. Starting from the selection of titles through a couple of in-depth brain storming session to the final QC process before uploading our titles on our website we dedicate around 350 working hours. The titles are selected based on their current market cap and the foreseen CAGR and growth.


The 5 steps process:

Step 1: Secondary Research:

Secondary Research or Desk Research is as the name suggests is a research process wherein, we collect data through the readily available information. In this process we use various paid and unpaid databases which our team has access to and gather data through the same. This includes examining of listed companies’ annual reports, Journals, SEC filling etc. Apart from this our team has access to various associations across the globe across different industries. Lastly, we have exchange relationships with various university as well as individual libraries.

Secondary Research

Step 2: Primary Research

When we talk about primary research, it is a type of study in which the researchers collect relevant data samples directly, rather than relying on previously collected data.  This type of research is focused on gaining content specific facts that can be sued to solve specific problems. Since the collected data is fresh and first hand therefore it makes the study more accurate and genuine.

We at SNS Insider have divided Primary Research into 2 parts.

Part 1 wherein we interview the KOLs of major players as well as the upcoming ones across various geographic regions. This allows us to have their view over the market scenario and acts as an important tool to come closer to the accurate market numbers. As many as 45 paid and unpaid primary interviews are taken from both the demand and supply side of the industry to make sure we land at an accurate judgement and analysis of the market.

This step involves the triangulation of data wherein our team analyses the interview transcripts, online survey responses and observation of on filed participants. The below mentioned chart should give a better understanding of the part 1 of the primary interview.

Primary Research

Part 2: In this part of primary research the data collected via secondary research and the part 1 of the primary research is validated with the interviews from individual consultants and subject matter experts.

Consultants are those set of people who have at least 12 years of experience and expertise within the industry whereas Subject Matter Experts are those with at least 15 years of experience behind their back within the same space. The data with the help of two main processes i.e., FGDs (Focused Group Discussions) and IDs (Individual Discussions). This gives us a 3rd party nonbiased primary view of the market scenario making it a more dependable one while collation of the data pointers.

Step 3: Data Bank Validation

Once all the information is collected via primary and secondary sources, we run that information for data validation. At our intelligence centre our research heads track a lot of information related to the market which includes the quarterly reports, the daily stock prices, and other relevant information. Our data bank server gets updated every fortnight and that is how the information which we collected using our primary and secondary information is revalidated in real time.

Data Bank Validation

Step 4: QA/QC Process

After all the data collection and validation our team does a final level of quality check and quality assurance to get rid of any unwanted or undesired mistakes. This might include but not limited to getting rid of the any typos, duplication of numbers or missing of any important information. The people involved in this process include technical content writers, research heads and graphics people. Once this process is completed the title gets uploader on our platform for our clients to read it.

Step 5: Final QC/QA Process:

This is the last process and comes when the client has ordered the study. In this process a final QA/QC is done before the study is emailed to the client. Since we believe in giving our clients a good experience of our research studies, therefore, to make sure that we do not lack at our end in any way humanly possible we do a final round of quality check and then dispatch the study to the client.

By Type

  • Analytical

  • Operational

By Application

  • Supply Chain

  • Transportation

By End Use

  • Aerospace & Defense

  • Chemicals

  • Retail & Consumer Goods

  • Healthcare

  • Manufacturing

  • High Technology Products

  • Others

Request for Segment Customization as per your Business Requirement: Segment Customization Request

Regional Coverage: 

North America 

  • US 

  • Canada 

  • Mexico 

Europe 

  • Eastern Europe 

  • Poland 

  • Romania 

  • Hungary 

  • Turkey 

  • Rest of Eastern Europe 

  • Western Europe 

  • Germany 

  • France 

  • UK 

  • Italy 

  • Spain 

  • Netherlands 

  • Switzerland 

  • Austria 

  • Rest of Western Europe 

Asia Pacific 

  • China 

  • India 

  • Japan 

  • South Korea 

  • Vietnam 

  • Singapore 

  • Australia 

  • Rest of Asia Pacific 

Middle East & Africa 

  • Middle East 

  • UAE 

  • Egypt 

  • Saudi Arabia 

  • Qatar 

  • Rest of Middle East 

  • Africa 

  • Nigeria 

  • South Africa 

  • Rest of Africa 

Latin America 

  • Brazil 

  • Argentina 

  • Colombia 

  • Rest of Latin America 

Request for Country Level Research Report: Country Level Customization Request

Available Customization 

With the given market data, SNS Insider offers customization as per the company’s specific needs. The following customization options are available for the report: 

  • Detailed Volume Analysis 

  • Criss-Cross segment analysis (e.g. Product X Application) 

  • Competitive Product Benchmarking 

  • Geographic Analysis 

  • Additional countries in any of the regions 

  • Customized Data Representation 

Detailed analysis and profiling of additional market players


  •            5000 (33% Discount)


  •            8950 (40% Discount)


  •            3050 (23% Discount)

Start a Conversation

Hi! Click one of our member below to chat on Phone