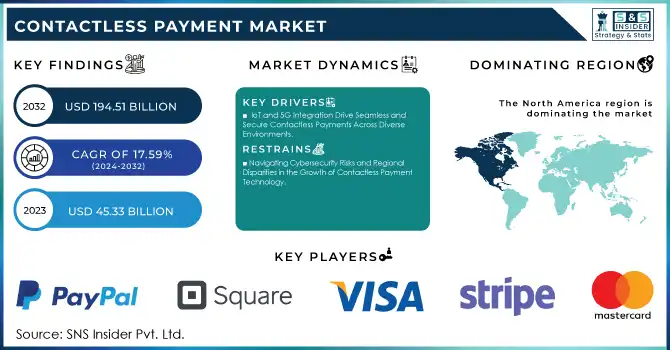
The Contactless Payment Market was valued at USD 45.33 billion in 2023 and is expected to reach USD 194.51 Billion by 2032, growing at a CAGR of 17.59 % over the forecast period 2024-2032.
Get more information on Contactless Payment Market - Request Sample Report
Increasing demand from consumers for quick, safe, and accessible payment solutions is fuelling growth in the contactless payment market. The development of technologies, like NFC and RFID, has made contactless payments much more practical and efficient. These solutions are also helping consumers by bringing down transaction timings, avoiding cash, and providing easy integration with smartphones and wearables, which is making these solutions even more popular. Moreover, the increasing penetration of digital wallets including Apple Pay, Google Pay, and Samsung Pay has boosted this market as these wallets are providing an easy platform for contactless transactions. Apple Pay leads the digital wallet market in the UK with 67%, over double the share of PayPal by 30%. Google Pay has the highest share of users surveyed for both in-store (82%) and online (80%) users in the country, as compared to any other country surveyed, in India. Brazil's instant payment system Pix logged USD 130 billion (USD 21.60 billion) worth of transactions on Black Friday 2024 that news came along with a 120.7% year-over-year spike in the value of those transactions.
The COVID-19 outbreak has increased the request for contactless payments since both businesses and consumers are more concerned about hygiene and physical contact. This move has been backed up by governments and financial institutions, raising transaction ceilings and advertising cashless payment infrastructures. Contactless payment technologies are making way for innovation in retail, transportation, and healthcare sectors, and are paving the path for the new normal by improving customer experience and operational efficiencies. Moreover, Asia-Pacific and Latin America are also growing emerging markets, supported by rising smartphone penetration and government-led initiatives towards digital financial inclusion. Increasing data security with fraud prevention creates additional security for contactless payment systems, cementing their status as a go-to for businesses and customers. This trend is indicative of a shift in payment preferences, as cash usage in the United Kingdom fell to an unprecedented low of 12% of transactions in 2023, propelled by contactless payments. Contactless payment continues to gain traction, with 94% of smartphones in the Asia-Pacific region being NFC-enabled devices. On the richer use of security procedures in contactless glass, Visa also blocked 80 million cases of fraud valued at USD 40 billion around the world.
KEY DRIVERS:
IoT-Enabling payment solutions are revolutionizing the face of contactless payment. Connected devices including smartwatches, fitness bands, and even IoT-connected home appliances are now coupled with payment facilities that are expanding the scope of payment. Such devices not only improve user convenience but also create new spaces for businesses to deliver seamless payment experiences in diverse environments including smart homes, retail outlets, and mass transit systems. The increase in the number of IOT devices and effective connectivity network that 5G provided, allows data to be transferred at a much faster and more secure rate during contactless transactions. Especially in tech-advanced parts of the world, like North America and Asia-Pacific, where IoT-based adoption is fast emerging. By the end of 2024, the number of connected IoT devices is expected to reach 18.8 billion, a 13% increase from the previous year. Global 5G connections surpassed 2 billion in Q3 2024, with 170 million new connections added during that period. These advancements in IoT and 5G significantly improve the speed, security, and reliability of contactless payments.
The major factor is the increase of biometric authentication technologies that provide greater security and confidence in contactless payments by users. Fingerprint scanning, facial recognition, and iris scanning, among other innovations, are making their way into the payment system to stop fraud and unauthorized transactions. Such solutions help alleviate consumer data security concerns, especially during critical high-value transactions. In addition, regulatory authorities worldwide are promoting the use of secure authentication methods, and the growing penetration of data protection laws is further propelling the implementation of biometrics in payment systems. Europe, for instance, has a strong customer authentication (SCA) requirement under its Payment Services Directive 2 (PSD2), which is conducive to using biometrics for better authentication. While this technological evolution reinforces consumers confidence it also opens new scopes of contactless payments in segments such as healthcare and hospitality, where secure and accurate verification is crucial. In 2024, over 60% of biometrically verified payments are conducted remotely. Additionally, 330 million new bank accounts are expected to be established digitally by 2025, up from 184 million in 2020, reflecting the growing trend of digital banking and biometric authentication adoption.
RESTRAIN:
The largest risk is the exposure to cyber threats such as data breaches and unauthorized access, which could erode consumer confidence. While encryption or tokenization technology has enhanced security, the rapidly changing upstream nature of cyberattacks creates new risks. Another challenge is the disparity in technology across regions. Developed markets have solid infrastructure for contactless payments, whereas contactless and NFC payments still need reliable infrastructure in many emerging economies, including NFC-enabled terminals and reliable Internet connectivity. Lack of penetration in certain regions combined with this digital divide restricts the amount of the market that the market can develop. Further, weakening market growth is the hesitance of consumers to switch to new technology, especially in older demographic groups or cash-dependent economies.
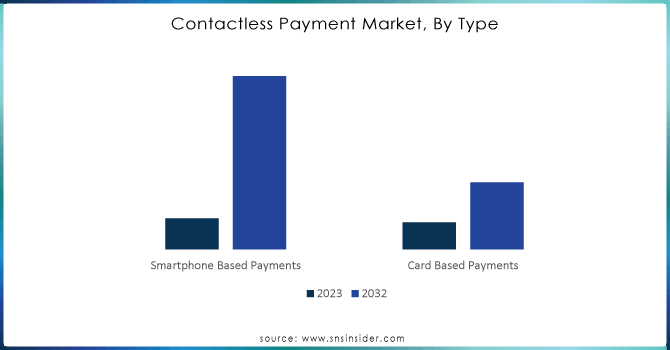
BY TYPE
Smartphone-based payments are dominant and will account for the majority of the market share at 54.7% in 2023, reflecting the broader penetration of smartphones and mobile wallets like Apple Pay, Google Pay, and Samsung Pay. Using near-field communication (NFC) technology, these platforms allow the user to make payments without using cards or cash. Furthermore, smartphones bring digital payments as the way people make purchases, pay bills, and do peer-to-peer transfers, often through mobile apps. Loyalty program integration, real-time notifications, and ease of use have all contributed to their stronghold on the market.
During the period from 2024 to 2032, card-based payments are predicted to grow at the highest CAGR as the infrastructure has developed and upgrades to contactless technology are becoming more prevalent. With the support of financial institutions and governments, the global rollout of contactless-enabled cards has resulted in more seamless and attractive card payments. The ease of simply tapping your card to complete a transaction and the rising limits for contactless transactions are prompting consumers and merchants to embrace this method. Meanwhile, areas with significant penetration of traditional cards are migrating to contactless cards, adding yet another layer between legacy payment systems and innovative digital solutions, enabling them to continue their rapid growth for the next decade.
BY APPLICATION
The retail sector held the highest share in 2023, accounting for 41.1%, due to high transaction volume and widespread adoption of contactless payment technology in retail outlets. The deployment of NFC-enabled point-of-sale (POS) terminals was driven by the need of retailers for seamless and fast checkout experiences. The convenience of having contactless payments along with loyalty programs and mobile wallets has made its usage even more frequent. Also, with the increasing consumer adoption rate of cashless payments, the retail segment is the largest cornerstone of the contactless payment service ecosystem due to its contribution to urban and technologically advanced regions.
The hospitality industry will develop at the highest CAGR for the period 2024 to 2032, due to the growing digital transformation initiatives & increasing requirements for personalized and efficient experiences for guests. To enhance productivity and customer satisfaction, hotels, restaurants, and travel operators are embracing contactless payment solutions. The hygiene concerns that arose post-pandemic have only expedited the move to contactless solutions such as mobile check-ins, QR code payments, and digital tipping. Moreover, a higher number of inbound and outbound tourist movements has led to the need for a more universal contactless payment solution, making the hospitality sector poised to adapt to this newfound technology at the fastest rate.
REGIONAL ANALYSIS
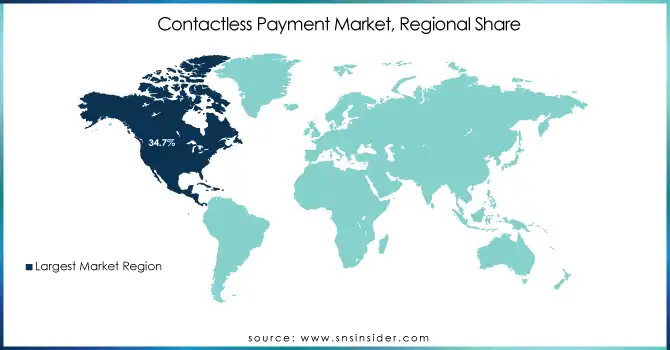
In 2023, North America held a 34.7% share of the contactless payment market and is expected to remain a dominant region throughout the forecasted period due to its sophisticated digital payment ecosystem combined with significantly high adoption rates for smartphones and digital wallets. With a high density of NFC-enabled POS terminals and cashless transaction culture, the region builds this environment high for acceptance of digital wallets. Virtually, applications to pass in travelers, such as contactless on the homes of a number of Walmart, one more mainstream retail post in the US, and Target, not to socialize with Apple Pay and Google Pay entrance of portable installment usage. Contactless credit and debit cards are a popular option in Canada thanks in large part to institutions like Interac, whereas this form of payment hasn't gained nearly as much traction in other regions of the globe, allowing the country to lead in the market.
Asia Pacific is projected to register the highest CAGR over the forecasted timeframe, as a result of fast-growing digitalization in economies, rising smartphone adoption, and governments striving for cashless ecosystems. In fact, there is examples from China, where Alipay and WeChat Pay have completely taken over with QR code and NFC payments ranging from retail purchases to transportation. In India, for example, it was the rapid scalability of the Unified Payments Interface (UPI) that led to apps such as PhonePe and Google Pay that paved the way for easy contactless payments. Similarly, the Suica and Pasmo cards used in Japan to facilitate transportation and retail highlight the growing trend towards contactless systems in the region.
Need any customization research on Contactless Payment Market - Enquiry Now
Key players
Some of the major players in the Contactless Payment Market are:
Visa (Visa Contactless Cards, Visa Tap to Pay)
MasterCard (MasterCard Contactless, MasterPass)
PayPal (PayPal Wallet, Venmo)
Square (Square Reader, Cash App)
Apple (Apple Pay, Apple Card)
Google (Google Pay, Google Wallet)
Samsung (Samsung Pay, Samsung Wallet)
Amazon (Amazon Pay, Amazon One)
Alipay (Alipay App, Alipay Wallet)
WeChat Pay (WeChat Wallet, WeChat Mini Programs)
Adyen (Adyen Payment Platform, Adyen POS Terminal)
Stripe (Stripe Terminal, Stripe Issuing)
Ingenico (Ingenico Move/5000, Ingenico AXIUM EX8000)
Worldpay (Worldpay Total, Worldpay Dashboard)
FIS (FIS Digital One, FIS RealNet)
Fiserv (Clover POS Systems, Clover Go)
NXP Semiconductors (MIFARE ICs, NFC Controllers)
Infineon Technologies (SECORA Pay, NFC Security Solutions)
IDEMIA (IDEMIA Contactless Cards, IDEMIA Digital Payment Solutions)
Thales (Thales EMV Cards, Thales Contactless Payment Solutions)
Some of the Raw Material Suppliers for Contactless Payment companies:
Gemalto (Thales Group)
Giesecke+Devrient GmbH
Samsung Electronics Co., Ltd.
Texas Instruments Incorporated
CPI Card Group Inc.
HID Global Corporation
Watchdata Technologies Ltd.
Eastcompeace Technology Co., Ltd.
Wuhan Tianyu Information Industry Co., Ltd.
CardLogix Corporation
RECENT TRENDS
In September 2024, Mastercard chosen India to pilot its Payment Passkey Service, using biometric authentication for secure, password-free online payments. The initiative aims to enhance online shopping security and streamline checkout for millions of consumers.
In September 2024, PayPal launched its PayPal Complete Payments platform in China, enabling local merchants to accept cross-border payments from global customers. The service aims to streamline international trade and enhance payment convenience for businesses.
In July 2024, Square launched Tap to Pay on iPhone in France, allowing local businesses to accept contactless payments directly on their devices. The service aims to streamline payment processes and enhance flexibility for merchants.
| Report Attributes | Details |
|---|---|
| Market Size in 2023 | USD 45.33 Billion |
| Market Size by 2032 | USD 194.51 Billion |
| CAGR | CAGR of 17.59% From 2024 to 2032 |
| Base Year | 2023 |
| Forecast Period | 2024-2032 |
| Historical Data | 2020-2022 |
| Report Scope & Coverage | Market Size, Segments Analysis, Competitive Landscape, Regional Analysis, DROC & SWOT Analysis, Forecast Outlook |
| Key Segments | • By Type (Smartphone Based Payments, Card Based Payments) • By Application (Retail, Transportation, Healthcare, Hospitality, Others) |
| Regional Analysis/Coverage | North America (US, Canada, Mexico), Europe (Eastern Europe [Poland, Romania, Hungary, Turkey, Rest of Eastern Europe] Western Europe] Germany, France, UK, Italy, Spain, Netherlands, Switzerland, Austria, Rest of Western Europe]), Asia Pacific (China, India, Japan, South Korea, Vietnam, Singapore, Australia, Rest of Asia Pacific), Middle East & Africa (Middle East [UAE, Egypt, Saudi Arabia, Qatar, Rest of Middle East], Africa [Nigeria, South Africa, Rest of Africa], Latin America (Brazil, Argentina, Colombia, Rest of Latin America) |
| Company Profiles | Visa, MasterCard, PayPal, Square, Apple, Google, Samsung, Amazon, Alipay, WeChat Pay, Adyen, Stripe, Ingenico, Worldpay, FIS, Fiserv, NXP Semiconductors, Infineon Technologies, IDEMIA, Thales |
| Key Drivers | • IoT and 5G Integration Drive Seamless and Secure Contactless Payments Across Diverse Environments • Rising Biometric Authentication Boosts Security and Expands Contactless Payments in Digital Banking and Beyond |
| RESTRAINTS | • Navigating Cybersecurity Risks and Regional Disparities in the Growth of Contactless Payment Technology |
Ans: North America dominated the Contactless Payment Market in 2023.
Ans: The Smartphone Based Payments segment dominated the Industrial battery market in 2023.
Ans: The major growth factor of the contactless payment market is the increasing consumer demand for faster, more convenient, and secure payment methods.
Ans: Contactless Payment Market size was USD 45.33 Billion in 2023 and is expected to Reach USD 194.51 Billion by 2032.
Ans: The Contactless Payment Market is expected to grow at a CAGR of 17.59% during 2024-2032.
Table of Content
1. Introduction
1.1 Market Definition
1.2 Scope (Inclusion and Exclusions)
1.3 Research Assumptions
2. Executive Summary
2.1 Market Overview
2.2 Regional Synopsis
2.3 Competitive Summary
3. Research Methodology
3.1 Top-Down Approach
3.2 Bottom-up Approach
3.3. Data Validation
3.4 Primary Interviews
4. Market Dynamics Impact Analysis
4.1 Market Driving Factors Analysis
4.1.1 Drivers
4.1.2 Restraints
4.2 PESTLE Analysis
4.3 Porter’s Five Forces Model
5. Statistical Insights and Trends Reporting
5.1 Contactless Payment Transaction Volume and Value (2023)
5.2 Contactless Payment Average Transaction Size (2023)
5.3 Contactless Payment Fraud Incidence and Security Measures
5.4 Contactless Payment Method Breakdown
6. Competitive Landscape
6.1 List of Major Companies, By Region
6.2 Market Share Analysis, By Region
6.3 Product Benchmarking
6.3.1 Product specifications and features
6.3.2 Pricing
6.4 Strategic Initiatives
6.4.1 Marketing and promotional activities
6.4.2 Distribution and Supply Chain Strategies
6.4.3 Expansion plans and new product launches
6.4.4 Strategic partnerships and collaborations
6.5 Technological Advancements
6.6 Market Positioning and Branding
7. Contactless Payment Market Segmentation, By Type
7.1 Chapter Overview
7.2 Smartphone Based Payments
7.2.1 Smartphone Based Payments Market Trends Analysis (2020-2032)
7.2.2 Smartphone Based Payments Market Size Estimates and Forecasts to 2032 (USD BILLION)
7.3 Card Based Payments
7.3.1 Card Based Payments Market Trends Analysis (2020-2032)
7.3.2 Card Based Payments Market Size Estimates and Forecasts to 2032 (USD BILLION)
8. Contactless Payment Market Segmentation, By Application
8.1 Chapter Overview
8.2 Retail
8.2.1 Retail Market Trends Analysis (2020-2032)
8.2.2 Retail Market Size Estimates and Forecasts to 2032 (USD BILLION)
8.3 Transportation
8.3.1 Transportation Market Trends Analysis (2020-2032)
8.3.2 Transportation Market Size Estimates and Forecasts to 2032 (USD BILLION)
8.4 Healthcare
8.4.1 Healthcare Market Trends Analysis (2020-2032)
8.4.2 Healthcare Market Size Estimates and Forecasts to 2032 (USD BILLION)
8.5 Hospitality
8.5.1 Hospitality Market Trends Analysis (2020-2032)
8.5.2 Hospitality Market Size Estimates and Forecasts to 2032 (USD BILLION)
8.6 Other
8.6.1 Other Market Trends Analysis (2020-2032)
8.6.2 Other Market Size Estimates and Forecasts to 2032 (USD BILLION)
9. Regional Analysis
9.1 Chapter Overview
9.2 North America
9.2.1 Trends Analysis
9.2.2 North America Contactless Payment Market Estimates and Forecasts, by Country (2020-2032) (USD BILLION)
9.2.3 North America Contactless Payment Market Estimates and Forecasts, By Type (2020-2032) (USD BILLION)
9.2.4 North America Contactless Payment Market Estimates and Forecasts, By Application (2020-2032) (USD BILLION)
9.2.5 USA
9.2.5.1 USA Contactless Payment Market Estimates and Forecasts, By Type (2020-2032) (USD BILLION)
9.2.5.2 USA Contactless Payment Market Estimates and Forecasts, By Application (2020-2032) (USD BILLION)
9.2.6 Canada
9.2.6.1 Canada Contactless Payment Market Estimates and Forecasts, By Type (2020-2032) (USD BILLION)
9.2.6.2 Canada Contactless Payment Market Estimates and Forecasts, By Application (2020-2032) (USD BILLION)
9.2.7 Mexico
9.2.7.1 Mexico Contactless Payment Market Estimates and Forecasts, By Type (2020-2032) (USD BILLION)
9.2.7.2 Mexico Contactless Payment Market Estimates and Forecasts, By Application (2020-2032) (USD BILLION)
9.3 Europe
9.3.1 Eastern Europe
9.3.1.1 Trends Analysis
9.3.1.2 Eastern Europe Contactless Payment Market Estimates and Forecasts, by Country (2020-2032) (USD BILLION)
9.3.1.3 Eastern Europe Contactless Payment Market Estimates and Forecasts, By Type (2020-2032) (USD BILLION)
9.3.1.4 Eastern Europe Contactless Payment Market Estimates and Forecasts, By Application (2020-2032) (USD BILLION)
9.3.1.5 Poland
9.3.1.5.1 Poland Contactless Payment Market Estimates and Forecasts, By Type (2020-2032) (USD BILLION)
9.3.1.5.2 Poland Contactless Payment Market Estimates and Forecasts, By Application (2020-2032) (USD BILLION)
9.3.1.6 Romania
9.3.1.6.1 Romania Contactless Payment Market Estimates and Forecasts, By Type (2020-2032) (USD BILLION)
9.3.1.6.2 Romania Contactless Payment Market Estimates and Forecasts, By Application (2020-2032) (USD BILLION)
9.3.1.7 Hungary
9.3.1.7.1 Hungary Contactless Payment Market Estimates and Forecasts, By Type (2020-2032) (USD BILLION)
9.3.1.7.2 Hungary Contactless Payment Market Estimates and Forecasts, By Application (2020-2032) (USD BILLION)
9.3.1.8 turkey
9.3.1.8.1 Turkey Contactless Payment Market Estimates and Forecasts, By Type (2020-2032) (USD BILLION)
9.3.1.8.2 Turkey Contactless Payment Market Estimates and Forecasts, By Application (2020-2032) (USD BILLION)
9.3.1.9 Rest of Eastern Europe
9.3.1.9.1 Rest of Eastern Europe Contactless Payment Market Estimates and Forecasts, By Type (2020-2032) (USD BILLION)
9.3.1.9.2 Rest of Eastern Europe Contactless Payment Market Estimates and Forecasts, By Application (2020-2032) (USD BILLION)
9.3.2 Western Europe
9.3.2.1 Trends Analysis
9.3.2.2 Western Europe Contactless Payment Market Estimates and Forecasts, by Country (2020-2032) (USD BILLION)
9.3.2.3 Western Europe Contactless Payment Market Estimates and Forecasts, By Type (2020-2032) (USD BILLION)
9.3.2.4 Western Europe Contactless Payment Market Estimates and Forecasts, By Application (2020-2032) (USD BILLION)
9.3.2.5 Germany
9.3.2.5.1 Germany Contactless Payment Market Estimates and Forecasts, By Type (2020-2032) (USD BILLION)
9.3.2.5.2 Germany Contactless Payment Market Estimates and Forecasts, By Application (2020-2032) (USD BILLION)
9.3.2.6 France
9.3.2.6.1 France Contactless Payment Market Estimates and Forecasts, By Type (2020-2032) (USD BILLION)
9.3.2.6.2 France Contactless Payment Market Estimates and Forecasts, By Application (2020-2032) (USD BILLION)
9.3.2.7 UK
9.3.2.7.1 UK Contactless Payment Market Estimates and Forecasts, By Type (2020-2032) (USD BILLION)
9.3.2.7.2 UK Contactless Payment Market Estimates and Forecasts, By Application (2020-2032) (USD BILLION)
9.3.2.8 Italy
9.3.2.8.1 Italy Contactless Payment Market Estimates and Forecasts, By Type (2020-2032) (USD BILLION)
9.3.2.8.2 Italy Contactless Payment Market Estimates and Forecasts, By Application (2020-2032) (USD BILLION)
9.3.2.9 Spain
9.3.2.9.1 Spain Contactless Payment Market Estimates and Forecasts, By Type (2020-2032) (USD BILLION)
9.3.2.9.2 Spain Contactless Payment Market Estimates and Forecasts, By Application (2020-2032) (USD BILLION)
9.3.2.10 Netherlands
9.3.2.10.1 Netherlands Contactless Payment Market Estimates and Forecasts, By Type (2020-2032) (USD BILLION)
9.3.2.10.2 Netherlands Contactless Payment Market Estimates and Forecasts, By Application (2020-2032) (USD BILLION)
9.3.2.11 Switzerland
9.3.2.11.1 Switzerland Contactless Payment Market Estimates and Forecasts, By Type (2020-2032) (USD BILLION)
9.3.2.11.2 Switzerland Contactless Payment Market Estimates and Forecasts, By Application (2020-2032) (USD BILLION)
9.3.2.12 Austria
9.3.2.12.1 Austria Contactless Payment Market Estimates and Forecasts, By Type (2020-2032) (USD BILLION)
9.3.2.12.2 Austria Contactless Payment Market Estimates and Forecasts, By Application (2020-2032) (USD BILLION)
9.3.2.13 Rest of Western Europe
9.3.2.13.1 Rest of Western Europe Contactless Payment Market Estimates and Forecasts, By Type (2020-2032) (USD BILLION)
9.3.2.13.2 Rest of Western Europe Contactless Payment Market Estimates and Forecasts, By Application (2020-2032) (USD BILLION)
9.4 Asia Pacific
9.4.1 Trends Analysis
9.4.2 Asia Pacific Contactless Payment Market Estimates and Forecasts, by Country (2020-2032) (USD BILLION)
9.4.3 Asia Pacific Contactless Payment Market Estimates and Forecasts, By Type (2020-2032) (USD BILLION)
9.4.4 Asia Pacific Contactless Payment Market Estimates and Forecasts, By Application (2020-2032) (USD BILLION)
9.4.5 China
9.4.5.1 China Contactless Payment Market Estimates and Forecasts, By Type (2020-2032) (USD BILLION)
9.4.5.2 China Contactless Payment Market Estimates and Forecasts, By Application (2020-2032) (USD BILLION)
9.4.6 India
9.4.5.1 India Contactless Payment Market Estimates and Forecasts, By Type (2020-2032) (USD BILLION)
9.4.5.2 India Contactless Payment Market Estimates and Forecasts, By Application (2020-2032) (USD BILLION)
9.4.5 japan
9.4.5.1 Japan Contactless Payment Market Estimates and Forecasts, By Type (2020-2032) (USD BILLION)
9.4.5.2 Japan Contactless Payment Market Estimates and Forecasts, By Application (2020-2032) (USD BILLION)
9.4.6 South Korea
9.4.6.1 South Korea Contactless Payment Market Estimates and Forecasts, By Type (2020-2032) (USD BILLION)
9.4.6.2 South Korea Contactless Payment Market Estimates and Forecasts, By Application (2020-2032) (USD BILLION)
9.4.7 Vietnam
9.4.7.1 Vietnam Contactless Payment Market Estimates and Forecasts, By Type (2020-2032) (USD BILLION)
9.2.7.2 Vietnam Contactless Payment Market Estimates and Forecasts, By Application (2020-2032) (USD BILLION)
9.4.8 Singapore
9.4.8.1 Singapore Contactless Payment Market Estimates and Forecasts, By Type (2020-2032) (USD BILLION)
9.4.8.2 Singapore Contactless Payment Market Estimates and Forecasts, By Application (2020-2032) (USD BILLION)
9.4.9 Australia
9.4.9.1 Australia Contactless Payment Market Estimates and Forecasts, By Type (2020-2032) (USD BILLION)
9.4.9.2 Australia Contactless Payment Market Estimates and Forecasts, By Application (2020-2032) (USD BILLION)
9.4.10 Rest of Asia Pacific
9.4.10.1 Rest of Asia Pacific Contactless Payment Market Estimates and Forecasts, By Type (2020-2032) (USD BILLION)
9.4.10.2 Rest of Asia Pacific Contactless Payment Market Estimates and Forecasts, By Application (2020-2032) (USD BILLION)
9.5 Middle East and Africa
9.5.1 Middle East
9.5.1.1 Trends Analysis
9.5.1.2 Middle East Contactless Payment Market Estimates and Forecasts, by Country (2020-2032) (USD BILLION)
9.5.1.3 Middle East Contactless Payment Market Estimates and Forecasts, By Type (2020-2032) (USD BILLION)
9.5.1.4 Middle East Contactless Payment Market Estimates and Forecasts, By Application (2020-2032) (USD BILLION)
9.5.1.5 UAE
9.5.1.5.1 UAE Contactless Payment Market Estimates and Forecasts, By Type (2020-2032) (USD BILLION)
9.5.1.5.2 UAE Contactless Payment Market Estimates and Forecasts, By Application (2020-2032) (USD BILLION)
9.5.1.6 Egypt
9.5.1.6.1 Egypt Contactless Payment Market Estimates and Forecasts, By Type (2020-2032) (USD BILLION)
9.5.1.6.2 Egypt Contactless Payment Market Estimates and Forecasts, By Application (2020-2032) (USD BILLION)
9.5.1.7 Saudi Arabia
9.5.1.7.1 Saudi Arabia Contactless Payment Market Estimates and Forecasts, By Type (2020-2032) (USD BILLION)
9.5.1.7.2 Saudi Arabia Contactless Payment Market Estimates and Forecasts, By Application (2020-2032) (USD BILLION)
9.5.1.8 Qatar
9.5.1.8.1 Qatar Contactless Payment Market Estimates and Forecasts, By Type (2020-2032) (USD BILLION)
9.5.1.8.2 Qatar Contactless Payment Market Estimates and Forecasts, By Application (2020-2032) (USD BILLION)
9.5.1.9 Rest of Middle East
9.5.1.9.1 Rest of Middle East Contactless Payment Market Estimates and Forecasts, By Type (2020-2032) (USD BILLION)
9.5.1.9.2 Rest of Middle East Contactless Payment Market Estimates and Forecasts, By Application (2020-2032) (USD BILLION)
9.5.2 Africa
9.5.2.1 Trends Analysis
9.5.2.2 Africa Contactless Payment Market Estimates and Forecasts, by Country (2020-2032) (USD BILLION)
9.5.2.3 Africa Contactless Payment Market Estimates and Forecasts, By Type (2020-2032) (USD BILLION)
9.5.2.4 Africa Contactless Payment Market Estimates and Forecasts, By Application (2020-2032) (USD BILLION)
9.5.2.5 South Africa
9.5.2.5.1 South Africa Contactless Payment Market Estimates and Forecasts, By Type (2020-2032) (USD BILLION)
9.5.2.5.2 South Africa Contactless Payment Market Estimates and Forecasts, By Application (2020-2032) (USD BILLION)
9.5.2.6 Nigeria
9.5.2.6.1 Nigeria Contactless Payment Market Estimates and Forecasts, By Type (2020-2032) (USD BILLION)
9.5.2.6.2 Nigeria Contactless Payment Market Estimates and Forecasts, By Application (2020-2032) (USD BILLION)
9.5.2.7 Rest of Africa
9.5.2.7.1 Rest of Africa Contactless Payment Market Estimates and Forecasts, By Type (2020-2032) (USD BILLION)
9.5.2.7.2 Rest of Africa Contactless Payment Market Estimates and Forecasts, By Application (2020-2032) (USD BILLION)
9.6 Latin America
9.6.1 Trends Analysis
9.6.2 Latin America Contactless Payment Market Estimates and Forecasts, by Country (2020-2032) (USD BILLION)
9.6.3 Latin America Contactless Payment Market Estimates and Forecasts, By Type (2020-2032) (USD BILLION)
9.6.4 Latin America Contactless Payment Market Estimates and Forecasts, By Application (2020-2032) (USD BILLION)
9.6.5 brazil
9.6.5.1 Brazil Contactless Payment Market Estimates and Forecasts, By Type (2020-2032) (USD BILLION)
9.6.5.2 Brazil Contactless Payment Market Estimates and Forecasts, By Application (2020-2032) (USD BILLION)
9.6.6 Argentina
9.6.6.1 Argentina Contactless Payment Market Estimates and Forecasts, By Type (2020-2032) (USD BILLION)
9.6.6.2 Argentina Contactless Payment Market Estimates and Forecasts, By Application (2020-2032) (USD BILLION)
9.6.7 Colombia
9.6.7.1 Colombia Contactless Payment Market Estimates and Forecasts, By Type (2020-2032) (USD BILLION)
9.6.7.2 Colombia Contactless Payment Market Estimates and Forecasts, By Application (2020-2032) (USD BILLION)
9.6.8 Rest of Latin America
9.6.8.1 Rest of Latin America Contactless Payment Market Estimates and Forecasts, By Type (2020-2032) (USD BILLION)
9.6.8.2 Rest of Latin America Contactless Payment Market Estimates and Forecasts, By Application (2020-2032) (USD BILLION)
10. Company Profiles
10.1 Visa
10.1.1 Company Overview
10.1.2 Financial
10.1.3 Products/ Services Offered
110.1.4 SWOT Analysis
10.2 MasterCard
10.2.1 Company Overview
10.2.2 Financial
10.2.3 Products/ Services Offered
10.2.4 SWOT Analysis
10.3 PayPal
10.3.1 Company Overview
10.3.2 Financial
10.3.3 Products/ Services Offered
10.3.4 SWOT Analysis
10.4 Square
10.4.1 Company Overview
10.4.2 Financial
10.4.3 Products/ Services Offered
10.4.4 SWOT Analysis
10.5 Apple
10.5.1 Company Overview
10.5.2 Financial
10.5.3 Products/ Services Offered
10.5.4 SWOT Analysis
10.6 Google
10.6.1 Company Overview
10.6.2 Financial
10.6.3 Products/ Services Offered
10.6.4 SWOT Analysis
10.7 Samsung
10.7.1 Company Overview
10.7.2 Financial
10.7.3 Products/ Services Offered
10.7.4 SWOT Analysis
10.8 Amazon
10.8.1 Company Overview
10.8.2 Financial
10.8.3 Products/ Services Offered
10.8.4 SWOT Analysis
10.9 Alipay
10.9.1 Company Overview
10.9.2 Financial
10.9.3 Products/ Services Offered
10.9.4 SWOT Analysis
10.10 WeChat Pay
10.9.1 Company Overview
10.9.2 Financial
10.9.3 Products/ Services Offered
10.9.4 SWOT Analysis
11. Use Cases and Best Practices
12. Conclusion
An accurate research report requires proper strategizing as well as implementation. There are multiple factors involved in the completion of good and accurate research report and selecting the best methodology to compete the research is the toughest part. Since the research reports we provide play a crucial role in any company’s decision-making process, therefore we at SNS Insider always believe that we should choose the best method which gives us results closer to reality. This allows us to reach at a stage wherein we can provide our clients best and accurate investment to output ratio.
Each report that we prepare takes a timeframe of 350-400 business hours for production. Starting from the selection of titles through a couple of in-depth brain storming session to the final QC process before uploading our titles on our website we dedicate around 350 working hours. The titles are selected based on their current market cap and the foreseen CAGR and growth.
The 5 steps process:
Step 1: Secondary Research:
Secondary Research or Desk Research is as the name suggests is a research process wherein, we collect data through the readily available information. In this process we use various paid and unpaid databases which our team has access to and gather data through the same. This includes examining of listed companies’ annual reports, Journals, SEC filling etc. Apart from this our team has access to various associations across the globe across different industries. Lastly, we have exchange relationships with various university as well as individual libraries.

Step 2: Primary Research
When we talk about primary research, it is a type of study in which the researchers collect relevant data samples directly, rather than relying on previously collected data. This type of research is focused on gaining content specific facts that can be sued to solve specific problems. Since the collected data is fresh and first hand therefore it makes the study more accurate and genuine.
We at SNS Insider have divided Primary Research into 2 parts.
Part 1 wherein we interview the KOLs of major players as well as the upcoming ones across various geographic regions. This allows us to have their view over the market scenario and acts as an important tool to come closer to the accurate market numbers. As many as 45 paid and unpaid primary interviews are taken from both the demand and supply side of the industry to make sure we land at an accurate judgement and analysis of the market.
This step involves the triangulation of data wherein our team analyses the interview transcripts, online survey responses and observation of on filed participants. The below mentioned chart should give a better understanding of the part 1 of the primary interview.

Part 2: In this part of primary research the data collected via secondary research and the part 1 of the primary research is validated with the interviews from individual consultants and subject matter experts.
Consultants are those set of people who have at least 12 years of experience and expertise within the industry whereas Subject Matter Experts are those with at least 15 years of experience behind their back within the same space. The data with the help of two main processes i.e., FGDs (Focused Group Discussions) and IDs (Individual Discussions). This gives us a 3rd party nonbiased primary view of the market scenario making it a more dependable one while collation of the data pointers.
Step 3: Data Bank Validation
Once all the information is collected via primary and secondary sources, we run that information for data validation. At our intelligence centre our research heads track a lot of information related to the market which includes the quarterly reports, the daily stock prices, and other relevant information. Our data bank server gets updated every fortnight and that is how the information which we collected using our primary and secondary information is revalidated in real time.

Step 4: QA/QC Process
After all the data collection and validation our team does a final level of quality check and quality assurance to get rid of any unwanted or undesired mistakes. This might include but not limited to getting rid of the any typos, duplication of numbers or missing of any important information. The people involved in this process include technical content writers, research heads and graphics people. Once this process is completed the title gets uploader on our platform for our clients to read it.
Step 5: Final QC/QA Process:
This is the last process and comes when the client has ordered the study. In this process a final QA/QC is done before the study is emailed to the client. Since we believe in giving our clients a good experience of our research studies, therefore, to make sure that we do not lack at our end in any way humanly possible we do a final round of quality check and then dispatch the study to the client.
Key Segments:
By Type
Smartphone Based Payments
Card Based Payments
By Application
Retail
Transportation
Healthcare
Hospitality
Others
Request for Segment Customization as per your Business Requirement: Segment Customization Request
REGIONAL COVERAGE:
North America
US
Canada
Mexico
Europe
Eastern Europe
Poland
Romania
Hungary
Turkey
Rest of Eastern Europe
Western Europe
Germany
France
UK
Italy
Spain
Netherlands
Switzerland
Austria
Rest of Western Europe
Asia Pacific
China
India
Japan
South Korea
Vietnam
Singapore
Australia
Rest of Asia Pacific
Middle East & Africa
Middle East
UAE
Egypt
Saudi Arabia
Qatar
Rest of the Middle East
Africa
Nigeria
South Africa
Rest of Africa
Latin America
Brazil
Argentina
Colombia
Rest of Latin America
Request for Country Level Research Report: Country Level Customization Request
Available Customization
With the given market data, SNS Insider offers customization as per the company’s specific needs. The following customization options are available for the report:
Product Analysis
Criss-Cross segment analysis (e.g. Product X Application)
Product Matrix which gives a detailed comparison of the product portfolio of each company
Geographic Analysis
Additional countries in any of the regions
Company Information
Detailed analysis and profiling of additional market players (Up to five)
The Customer Communication Management Market was valued at USD 1.7 Bn in 2023 and is expected to grow to USD 4.5 Bn by 2032, at a CAGR of 11.3% over 2024-2032.
The Talent Management Software Market size was recorded at USD 9.17 billion in 2023 and is expected to reach USD 25.42 billion by 2032, growing at a CAGR of 12.0 % over the forecast period of 2024-2032.
The Business Intelligence (BI) software Market size was valued at USD 35.85 billion in 2023 and will grow to USD 112.4 billion and CAGR of 13.6 % by 2032.
Light Fidelity [LiFi] Technology Market was valued at USD 0.62 billion in 2023 and is expected to reach USD 35.62 billion by 2032, growing at a CAGR of 57.04% from 2024-2032.
The AI Voice Cloning Market was valued at USD 1.9 Billion in 2023 and is expected to reach USD 15.7 Billion by 2032, growing at a CAGR of 26.74% from 2024-2032.
The Contactless Biometrics Market Size was valued at USD 19.12 Billion in 2023 and is expected to reach USD 70.48 Billion by 2032 and grow at a CAGR of 15.7% over the forecast period 2024-2032.

Hi! Click one of our member below to chat on Phone
© 2025 All Rights Reserved by SNS Insider Pvt Ltd


