image

Connected Hardhats Market Report Scope & Overview:

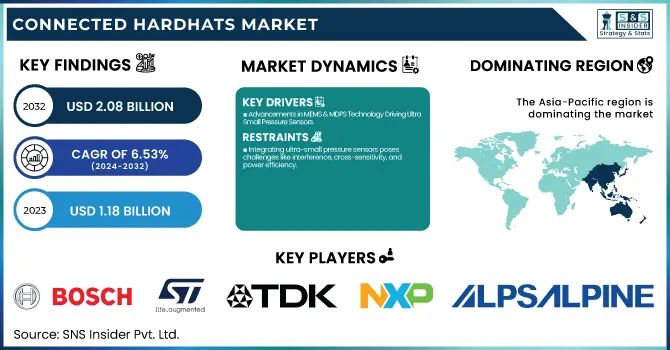
The Connected Hardhats Market size was valued at USD 103.8 Million in 2023, and expected to reach USD 386.49 Million by 2032, growing at a CAGR of 15.73 % during 2024-2032 The market is driven by the increasing workplace safety regulations, growing adoption of IoT and AI-based smart PPE, and the demand for real-time worker monitoring in hazardous industries such as construction, oil & gas, and manufacturing. Adoption & usage metrics show increasing connected hardhat adoption, with a 40% decrease in incidences being reported in various industries. Technology such as 5G connectivity, real-time fatigue detection, and greater battery life all contribute to performance. The adoption is being driven by adherence to OSHA, ANSI and ISO safety norms, and the growing investments in safety technology are driving job growth and market expansion

Connected Hardhats Market Dynamics:

Drivers:

  • AI-Powered Connected Hardhats Enhance Workplace Safety and Efficiency

The integration of AI and IoT in connected hardhats is revolutionizing workplace safety with real-time monitoring fatigue detection and GPS tracking. Smart hardhats equipped with advanced sensors enhance communication and track environmental risks ensuring better worker protection. AI-driven compliance systems automatically verify PPE usage reducing workplace injuries and improving operational efficiency. Companies are rapidly adopting these technologies to create safer and more productive work environments. With continuous advancements in connectivity and predictive analytics the Connected Hardhats Market is poised for significant growth.

Restraints:

  • Privacy and Security Risks Limiting Connected Hardhat Adoption

The widespread use of GPS tracking, biometric sensors, and real-time data collection in connected hardhats is raising serious concerns about worker privacy and cybersecurity. Continuous tracking may be felt invasive surveillance which makes user adoption highly resistant. The high risk of cyberattack and data breach, which surrounds the storage and transmission of sensitive personal data, potentially exposes confidential worker information. Features like data encryption and access controls can mitigate these risks, but without a transparent data governance policy, many companies battle to meet privacy regulations (GDPR) and OSHA exposure guidelines. This poses legal, ethical, and operational threats that creates a huge roadblock to the scale-up of connected hardhat tech across industries.

Opportunities:

  • Smart PPE is revolutionizing safety in high-risk industries by integrating IoT, AI-driven alerts, and real-time monitoring to reduce workplace accidents and enhance operational efficiency.

Connected hardhats are on the rise in construction, oil & gas, mining, and manufacturing — making workplaces safer for companies by decreasing accidents and improving efficiency. Such industries work through dangerous environmental conditions and make up for the lost time through real-time monitoring, AI-based alerts, and biometric tracking that really reduce the chances of injury. Due to stringent safety regulations and increased liability or corporate responsibility, businesses prioritize smart PPE to meet compliance as well as protect their workforce. In addition to this, the use of IoT, edge computing and predictive analytics enhances risk assessment and emergency response making connected hardhats an important investment for high-risk industries.

Challenges:

  • Connectivity Barriers Limiting Smart Hardhat Efficiency in Remote Worksites

The effectiveness of connected hardhats is heavily dependent on seamless network connectivity, which remains a major challenge in remote worksites, underground mines, and offshore locations. In these environments, weak signal strength, lack of 5G infrastructure, and interference from natural barriers can disrupt real-time data transmission, GPS tracking, and AI-driven alerts. Without stable connectivity, critical features such as biometric monitoring, fatigue detection, and emergency notifications become unreliable, reducing the overall safety benefits of smart PPE. Companies must invest in private networks, satellite communications, and edge computing solutions to ensure continuous functionality in harsh and isolated work conditions.

Connected Hardhats Market Segment Analysis:

By Component

The communication segment led the Connected Hardhats Market, capturing 39% of the revenue share in 2023, as the demand for real-time interaction with seamless connectivity in hazardous working environments is increasing significantly. Connected hardhats containing built-in microphones, speakers, and Bluetooth or LTE connectivity facilitate immediate communication between workers and a supervisor, enhancing the situational awareness and emergency response. In sectors with teams working in remote or high-hazard environments (for example construction, oil and gas, and mining), the potential to transmit vital commands, alarms, and SOS alerts without manual radios increases operational efficiency and improves worker safety. Thus, the increasing implementation of 5G networks as well as AI-based voice support are also contributing to the demand for communication-enabled smart PPE.

The navigation segment is the fastest-growing in the Connected Hardhats Market from 2024 to 2032, owing to the rising demand for accurate location tracking, and worker safety, in complicated and risky working environments. Smart helmets equipped with advanced GPS, RFID, and indoor positioning systems allow real-time tracking of workers, geofencing, and optimization of routes, greatly improving efficiency in large construction sites, mines, and oil operations. Growing demand for automated navigation assistance; AI-powered pathfinding support; and passage support during casualty evacuation is driving adoption. Moreover, regulations regarding worker safety and Industry 4.0 have further escalated investments in navigating-enabled smart PPE solutions.

By End-Use

The construction segment held the largest revenue share of 45% in the Connected Hardhats Market in 2023, due to the stringent safety standards, increasing workplace accidents, and growing trend of smart PPE adoption. Internet of Things (IoT) enabled hardhats with real time alerts, biometric measurement tools, GPS tracking and inbuilt feedback systems are helping improve worker safety, productivity, and compliance with occupational safety standards. Construction sites are particularly high-risk environments, with heavy machinery, high-altitude work, and constrained spaces, which has accelerated demand for artificial intelligence-powered fatigue detection, impact sensors, and geofencing technologies. Moreover, major infrastructure initiatives and rapid urbanization is driving investment in advanced wearable safety solutions across the vertical.

The manufacturing segment is the fastest-growing in the Connected Hardhats Market from 2024 to 2032, driven by the rising focus on workplace safety, automation, and Industry 4.0 adoption. Smart hardhats with AI-driven hazard detection, biometric monitoring, and real-time communication are enhancing worker protection in factories, warehouses, and assembly lines. The integration of IoT and predictive analytics helps in accident prevention, compliance monitoring, and operational efficiency. Increasing investments in smart factories and industrial automation, along with stringent occupational safety regulations, are further accelerating the adoption of connected PPE in manufacturing environments.

Connected Hardhats Market Regional Analysis:

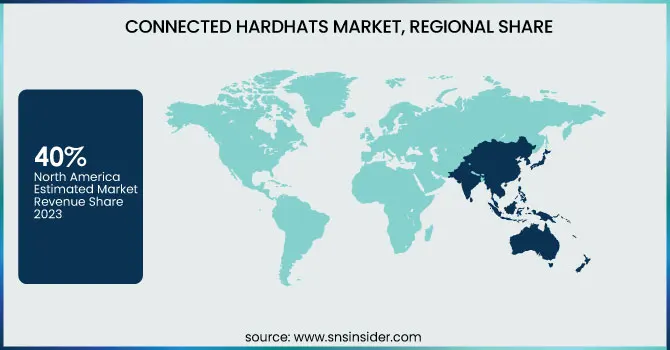
North America dominated the Connected Hardhats Market in 2023, accounting for 40% of the market share, as sophisticated technological adoption in manufacturing process, stringent safety regulations and high industrial base are the factors responsible for its sale. Workers in the construction, manufacturing, and oil & gas industries in the region are increasingly adopting smart PPE solutions to improve worker safety, compliance, and operational efficiency. The proliferation of innovation across North America and the growing demand for IoT and AI-enabled hardhats for high-risk industries are propelling the market. Also, government regulation and industry standards are encouraging the use of the connected hardhats.

The Asia-Pacific region is expected to be the fastest growing in the Connected Hardhats Market from 2024 to 2032, due to rapid industrialization and infrastructure development along with growing awareness regarding workplace safety. Countries such as China, India, and Japan are investing heavily in sectors like construction, manufacturing, mining, and energy and are slowly embracing advanced safety technologies to mitigate accidents at the workplace. Smart PPE solutions like connected hardhats, equipped with real-time communication, GPS tracking, and biometric monitoring, are increasingly crucial in high-risk environments. The adoption of connected hardhats in the region is facilitated by government regulations and increasing focus on automated and AI-based safety solutions.

Connected Hardhats Market Key Players:

Some of the Major Players in Connected Hardhats Market along with their Products:

  • United Safety (Canada) – Safety equipment, including connected hardhats and other smart PPE solutions.

  • Technosoft Engineering Projects Ltd. (India) – AI-driven safety systems and IoT-enabled connected hardhats for industrial applications.

  • MSA Safety Incorporated (USA) – Protective equipment, including smart hardhats, gas detection systems, and industrial safety gear.

  • Westinghouse Electric Company LLC (USA) – Nuclear safety equipment, including connected hardhats for hazardous work environments.

  • Luceque (USA) – Smart PPE solutions, including connected hardhats with integrated sensors for safety and efficiency.

  • WakeCap Technologies (UAE) – Connected hardhats with IoT integration for real-time data collection and communication on construction sites.

  • Knowit (Sweden) – IoT solutions for worker safety, including connected hardhats for real-time monitoring and reporting.

  • GuangZhou Jepower Technology Co., Ltd. (China) – Connected hardhats and industrial safety equipment with GPS tracking and communication features.

  • Excellent Webworld (India) – Smart wearable technology, including connected hardhats for improving workplace safety through real-time data analysis.

  • Twiceme Technology AB (Sweden) – Connected hardhats with built-in communication and GPS tracking for worker safety and productivity.

List of companies that provide raw materials and components for the Connected Hardhats Market:

  • 3M Company

  • Honeywell International Inc.

  • SABIC

  • DuPont

  • Vuzix Corporation

  • TE Connectivity

  • Bosch Sensortec

  • STMicroelectronics

  • Prysmian Group

  • NXP Semiconductors

Recent News:

  • On 27 February 2025, The Léon Thévenin, a ship the size of a football field, plays a critical role in keeping Africa online by repairing underwater internet cable. Jobs like Shuru Arendse’s keep countries connected, even after large-scale cable failures trigger widespread digital blackouts.

  • On March 7, 2025, Rep. Tom Sexton introduced House File 1004 to fund the Minnesota Helmets to Hardhats program, helping veterans, active-duty military, and National Guard members find career opportunities in the construction industry. The bill has gained bipartisan support and is set to receive a hearing

Connected Hardhats Market Report Scope:

Report Attributes Details
Market Size in 2023 USD 103.8 Million
Market Size by 2032 USD 386.49 Million
CAGR CAGR of 15.73 % From 2024 to 2032
Base Year 2023
Forecast Period 2024-2032
Historical Data 2020-2022
Report Scope & Coverage Market Size, Segments Analysis, Competitive  Landscape, Regional Analysis, DROC & SWOT Analysis, Forecast Outlook
Key Segments • By Component (Communication, Navigation, Camera, Others)
• By End-Use (Consumer, Manufacturing, Construction, Others)
Regional Analysis/Coverage North America (US, Canada, Mexico), Europe (Eastern Europe [Poland, Romania, Hungary, Turkey, Rest of Eastern Europe] Western Europe] Germany, France, UK, Italy, Spain, Netherlands, Switzerland, Austria, Rest of Western Europe]), Asia Pacific (China, India, Japan, South Korea, Vietnam, Singapore, Australia, Rest of Asia Pacific), Middle East & Africa (Middle East [UAE, Egypt, Saudi Arabia, Qatar, Rest of Middle East], Africa [Nigeria, South Africa, Rest of Africa], Latin America (Brazil, Argentina, Colombia, Rest of Latin America)
Company Profiles United Safety (Canada), Technosoft Engineering Projects Ltd. (India), MSA Safety Incorporated (USA), Westinghouse Electric Company LLC (USA), Luceque (USA), WakeCap Technologies (UAE), Knowit (Sweden), GuangZhou Jepower Technology Co., Ltd. (China), Excellent Webworld (India), and Twiceme Technology AB (Sweden) are key players in the Connected Hardhats Market.

Frequently Asked Questions

Ans:  The Connected Hardhats Market is expected to grow at a CAGR of 15.73%  during 2024-2032.

Ans: The Connected Hardhats Market was USD 103.8 Million in 2023 and is expected to Reach USD 386.49 Million by 2032.

Ans: Key drivers of the Connected Hardhats Market include the increasing demand for worker safety, integration of IoT and AI technologies, regulatory compliance, and rising adoption in high-risk industries such as construction, oil & gas, and manufacturing.

Ans: The “Communication” segment dominated the Connected Hardhats Market.

Ans: North America dominated the Connected Hardhats Market in 2023

Table of Content

1. Introduction

1.1 Market Definition

1.2 Scope (Inclusion and Exclusions)

1.3 Research Assumptions

2. Executive Summary

2.1 Market Overview

2.2 Regional Synopsis

2.3 Competitive Summary

3. Research Methodology

3.1 Top-Down Approach

3.2 Bottom-up Approach

3.3. Data Validation

3.4 Primary Interviews

4. Market Dynamics Impact Analysis

4.1 Market Driving Factors Analysis

4.1.2 Drivers

4.1.2 Restraints

4.1.3 Opportunities

4.1.4 Challenges

4.2 PESTLE Analysis

4.3 Porter’s Five Forces Model

5. Statistical Insights and Trends Reporting

5.1 Adoption & Usage Metrics

5.2 Technological & Performance Data

5.3 Safety & Compliance Data

5.4 Workforce & Employment Impact

6. Competitive Landscape

6.1 List of Major Companies, By Region

6.2 Market Share Analysis, By Region

6.3 Product Benchmarking

6.3.1 Product specifications and features

6.3.2 Pricing

6.4 Strategic Initiatives

6.4.1 Marketing and promotional activities

6.4.2 Distribution and supply chain strategies

6.4.3 Expansion plans and new product launches

6.4.4 Strategic partnerships and collaborations

6.5 Technological Advancements

6.6 Market Positioning and Branding

7. Connected Hardhats Market Segmentation, by Component

7.1 Chapter Overview

7.2 Communication

7.2.1 Communication Market Trends Analysis (2020-2032)

7.2.2 Communication Market Size Estimates and Forecasts to 2032 (USD Million)

7.3 Navigation

7.3.1 Navigation Market Trends Analysis (2020-2032)

7.3.2 Navigation Market Size Estimates and Forecasts to 2032 (USD Million)

7.4 Camera

7.4.1 Camera Market Trends Analysis (2020-2032)

7.4.2 Camera Market Size Estimates and Forecasts to 2032 (USD Million)

7.5 Others

7.5.1 Others Market Trends Analysis (2020-2032)

7.5.2 Others Market Size Estimates and Forecasts to 2032 (USD Million)

8. Connected Hardhats Market Segmentation, by End-Use

8.1 Chapter Overview

8.2 Consumer

8.2.1 Consumer Market Trends Analysis (2020-2032)

8.2.2 Consumer Market Size Estimates and Forecasts to 2032 (USD Million)

8.3 Manufacturing

8.3.1 Manufacturing Market Trends Analysis (2020-2032)

8.3.2 Manufacturing Market Size Estimates and Forecasts to 2032 (USD Million)

8.4 Construction

8.4.1 Construction Market Trends Analysis (2020-2032)

8.4.2 Construction Market Size Estimates and Forecasts to 2032 (USD Million)

8.5 Others

8.5.1 Others Market Trends Analysis (2020-2032)

8.5.2 Others Market Size Estimates and Forecasts to 2032 (USD Million)

9. Regional Analysis

9.1 Chapter Overview

9.2 North America

9.2.1 Trends Analysis

9.2.2 North America Connected Hardhats Market Estimates and Forecasts, by Country (2020-2032) (USD Million)

9.2.3 North America Connected Hardhats Market Estimates and Forecasts, by Component (2020-2032) (USD Million) 

9.2.4 North America Connected Hardhats Market Estimates and Forecasts, by End-Use(2020-2032) (USD Million)

9.2.5 USA

9.2.5.1 USA Connected Hardhats Market Estimates and Forecasts, by Component (2020-2032) (USD Million)

9.2.5.2 USA Connected Hardhats Market Estimates and Forecasts, by End-Use(2020-2032) (USD Million)

9.2.6 Canada

9.2.6.1 Canada Connected Hardhats Market Estimates and Forecasts, by Component (2020-2032) (USD Million)

9.2.6.2 Canada Connected Hardhats Market Estimates and Forecasts, by End-Use(2020-2032) (USD Million)

9.2.7 Mexico

9.2.7.1 Mexico Connected Hardhats Market Estimates and Forecasts, by Component (2020-2032) (USD Million)

9.2.7.2 Mexico Connected Hardhats Market Estimates and Forecasts, by End-Use(2020-2032) (USD Million)

9.3 Europe

9.3.1 Eastern Europe

9.3.1.1 Trends Analysis

9.3.1.2 Eastern Europe Connected Hardhats Market Estimates and Forecasts, by Country (2020-2032) (USD Million)

9.3.1.3 Eastern Europe Connected Hardhats Market Estimates and Forecasts, by Component (2020-2032) (USD Million) 

9.3.1.4 Eastern Europe Connected Hardhats Market Estimates and Forecasts, by End-Use(2020-2032) (USD Million)

9.3.1.5 Poland

9.3.1.5.1 Poland Connected Hardhats Market Estimates and Forecasts, by Component (2020-2032) (USD Million)

9.3.1.5.2 Poland Connected Hardhats Market Estimates and Forecasts, by End-Use(2020-2032) (USD Million)

9.3.1.6 Romania

9.3.1.6.1 Romania Connected Hardhats Market Estimates and Forecasts, by Component (2020-2032) (USD Million)

9.3.1.6.2 Romania Connected Hardhats Market Estimates and Forecasts, by End-Use(2020-2032) (USD Million)

9.3.1.7 Hungary

9.3.1.7.1 Hungary Connected Hardhats Market Estimates and Forecasts, by Component (2020-2032) (USD Million)

9.3.1.7.2 Hungary Connected Hardhats Market Estimates and Forecasts, by End-Use(2020-2032) (USD Million)

9.3.1.8 Turkey

9.3.1.8.1 Turkey Connected Hardhats Market Estimates and Forecasts, by Component (2020-2032) (USD Million)

9.3.1.8.2 Turkey Connected Hardhats Market Estimates and Forecasts, by End-Use(2020-2032) (USD Million)

9.3.1.9 Rest of Eastern Europe

9.3.1.9.1 Rest of Eastern Europe Connected Hardhats Market Estimates and Forecasts, by Component (2020-2032) (USD Million)

9.3.1.9.2 Rest of Eastern Europe Connected Hardhats Market Estimates and Forecasts, by End-Use(2020-2032) (USD Million)

9.3.2 Western Europe

9.3.2.1 Trends Analysis

9.3.2.2 Western Europe Connected Hardhats Market Estimates and Forecasts, by Country (2020-2032) (USD Million)

9.3.2.3 Western Europe Connected Hardhats Market Estimates and Forecasts, by Component (2020-2032) (USD Million) 

9.3.2.4 Western Europe Connected Hardhats Market Estimates and Forecasts, by End-Use(2020-2032) (USD Million)

9.3.2.5 Germany

9.3.2.5.1 Germany Connected Hardhats Market Estimates and Forecasts, by Component (2020-2032) (USD Million)

9.3.2.5.2 Germany Connected Hardhats Market Estimates and Forecasts, by End-Use(2020-2032) (USD Million)

9.3.2.6 France

9.3.2.6.1 France Connected Hardhats Market Estimates and Forecasts, by Component (2020-2032) (USD Million)

9.3.2.6.2 France Connected Hardhats Market Estimates and Forecasts, by End-Use(2020-2032) (USD Million)

9.3.2.7 UK

9.3.2.7.1 UK Connected Hardhats Market Estimates and Forecasts, by Component (2020-2032) (USD Million)

9.3.2.7.2 UK Connected Hardhats Market Estimates and Forecasts, by End-Use(2020-2032) (USD Million)

9.3.2.8 Italy

9.3.2.8.1 Italy Connected Hardhats Market Estimates and Forecasts, by Component (2020-2032) (USD Million)

9.3.2.8.2 Italy Connected Hardhats Market Estimates and Forecasts, by End-Use(2020-2032) (USD Million)

9.3.2.9 Spain

9.3.2.9.1 Spain Connected Hardhats Market Estimates and Forecasts, by Component (2020-2032) (USD Million)

9.3.2.9.2 Spain Connected Hardhats Market Estimates and Forecasts, by End-Use(2020-2032) (USD Million)

9.3.2.10 Netherlands

9.3.2.10.1 Netherlands Connected Hardhats Market Estimates and Forecasts, by Component (2020-2032) (USD Million)

9.3.2.10.2 Netherlands Connected Hardhats Market Estimates and Forecasts, by End-Use(2020-2032) (USD Million)

9.3.2.11 Switzerland

9.3.2.11.1 Switzerland Connected Hardhats Market Estimates and Forecasts, by Component (2020-2032) (USD Million)

9.3.2.11.2 Switzerland Connected Hardhats Market Estimates and Forecasts, by End-Use(2020-2032) (USD Million)

9.3.2.12 Austria

9.3.2.12.1 Austria Connected Hardhats Market Estimates and Forecasts, by Component (2020-2032) (USD Million)

9.3.2.12.2 Austria Connected Hardhats Market Estimates and Forecasts, by End-Use(2020-2032) (USD Million)

9.3.2.13 Rest of Western Europe

9.3.2.13.1 Rest of Western Europe Connected Hardhats Market Estimates and Forecasts, by Component (2020-2032) (USD Million)

9.3.2.13.2 Rest of Western Europe Connected Hardhats Market Estimates and Forecasts, by End-Use(2020-2032) (USD Million)

9.4 Asia-Pacific

9.4.1 Trends Analysis

9.4.2 Asia-Pacific Connected Hardhats Market Estimates and Forecasts, by Country (2020-2032) (USD Million)

9.4.3 Asia-Pacific Connected Hardhats Market Estimates and Forecasts, by Component (2020-2032) (USD Million) 

9.4.4 Asia-Pacific Connected Hardhats Market Estimates and Forecasts, by End-Use(2020-2032) (USD Million)

9.4.5 China

9.4.5.1 China Connected Hardhats Market Estimates and Forecasts, by Component (2020-2032) (USD Million)

9.4.5.2 China Connected Hardhats Market Estimates and Forecasts, by End-Use(2020-2032) (USD Million)

9.4.6 India

9.4.5.1 India Connected Hardhats Market Estimates and Forecasts, by Component (2020-2032) (USD Million)

9.4.5.2 India Connected Hardhats Market Estimates and Forecasts, by End-Use(2020-2032) (USD Million)

9.4.5 Japan

9.4.5.1 Japan Connected Hardhats Market Estimates and Forecasts, by Component (2020-2032) (USD Million)

9.4.5.2 Japan Connected Hardhats Market Estimates and Forecasts, by End-Use(2020-2032) (USD Million)

9.4.6 South Korea

9.4.6.1 South Korea Connected Hardhats Market Estimates and Forecasts, by Component (2020-2032) (USD Million)

9.4.6.2 South Korea Connected Hardhats Market Estimates and Forecasts, by End-Use(2020-2032) (USD Million)

9.4.7 Vietnam

9.4.7.1 Vietnam Connected Hardhats Market Estimates and Forecasts, by Component (2020-2032) (USD Million)

9.2.7.2 Vietnam Connected Hardhats Market Estimates and Forecasts, by End-Use(2020-2032) (USD Million)

9.4.8 Singapore

9.4.8.1 Singapore Connected Hardhats Market Estimates and Forecasts, by Component (2020-2032) (USD Million)

9.4.8.2 Singapore Connected Hardhats Market Estimates and Forecasts, by End-Use(2020-2032) (USD Million)

9.4.9 Australia

9.4.9.1 Australia Connected Hardhats Market Estimates and Forecasts, by Component (2020-2032) (USD Million)

9.4.9.2 Australia Connected Hardhats Market Estimates and Forecasts, by End-Use(2020-2032) (USD Million)

9.4.10 Rest of Asia-Pacific

9.4.10.1 Rest of Asia-Pacific Connected Hardhats Market Estimates and Forecasts, by Component (2020-2032) (USD Million)

9.4.10.2 Rest of Asia-Pacific Connected Hardhats Market Estimates and Forecasts, by End-Use(2020-2032) (USD Million)

9.5 Middle East and Africa

9.5.1 Middle East

9.5.1.1 Trends Analysis

9.5.1.2 Middle East Connected Hardhats Market Estimates and Forecasts, by Country (2020-2032) (USD Million)

9.5.1.3 Middle East Connected Hardhats Market Estimates and Forecasts, by Component (2020-2032) (USD Million) 

9.5.1.4 Middle East Connected Hardhats Market Estimates and Forecasts, by End-Use(2020-2032) (USD Million)

9.5.1.5 UAE

9.5.1.5.1 UAE Connected Hardhats Market Estimates and Forecasts, by Component (2020-2032) (USD Million)

9.5.1.5.2 UAE Connected Hardhats Market Estimates and Forecasts, by End-Use(2020-2032) (USD Million)

9.5.1.6 Egypt

9.5.1.6.1 Egypt Connected Hardhats Market Estimates and Forecasts, by Component (2020-2032) (USD Million)

9.5.1.6.2 Egypt Connected Hardhats Market Estimates and Forecasts, by End-Use(2020-2032) (USD Million)

9.5.1.7 Saudi Arabia

9.5.1.7.1 Saudi Arabia Connected Hardhats Market Estimates and Forecasts, by Component (2020-2032) (USD Million)

9.5.1.7.2 Saudi Arabia Connected Hardhats Market Estimates and Forecasts, by End-Use(2020-2032) (USD Million)

9.5.1.8 Qatar

9.5.1.8.1 Qatar Connected Hardhats Market Estimates and Forecasts, by Component (2020-2032) (USD Million)

9.5.1.8.2 Qatar Connected Hardhats Market Estimates and Forecasts, by End-Use(2020-2032) (USD Million)

9.5.1.9 Rest of Middle East

9.5.1.9.1 Rest of Middle East Connected Hardhats Market Estimates and Forecasts, by Component (2020-2032) (USD Million)

9.5.1.9.2 Rest of Middle East Connected Hardhats Market Estimates and Forecasts, by End-Use(2020-2032) (USD Million)

9.5.2 Africa

9.5.2.1 Trends Analysis

9.5.2.2 Africa Connected Hardhats Market Estimates and Forecasts, by Country (2020-2032) (USD Million)

9.5.2.3 Africa Connected Hardhats Market Estimates and Forecasts, by Component (2020-2032) (USD Million) 

9.5.2.4 Africa Connected Hardhats Market Estimates and Forecasts, by End-Use(2020-2032) (USD Million)

9.5.2.5 South Africa

9.5.2.5.1 South Africa Connected Hardhats Market Estimates and Forecasts, by Component (2020-2032) (USD Million)

9.5.2.5.2 South Africa Connected Hardhats Market Estimates and Forecasts, by End-Use(2020-2032) (USD Million)

9.5.2.6 Nigeria

9.5.2.6.1 Nigeria Connected Hardhats Market Estimates and Forecasts, by Component (2020-2032) (USD Million)

9.5.2.6.2 Nigeria Connected Hardhats Market Estimates and Forecasts, by End-Use(2020-2032) (USD Million)

9.5.2.7 Rest of Africa

9.5.2.7.1 Rest of Africa Connected Hardhats Market Estimates and Forecasts, by Component (2020-2032) (USD Million)

9.5.2.7.2 Rest of Africa Connected Hardhats Market Estimates and Forecasts, by End-Use(2020-2032) (USD Million)

9.6 Latin America

9.6.1 Trends Analysis

9.6.2 Latin America Connected Hardhats Market Estimates and Forecasts, by Country (2020-2032) (USD Million)

9.6.3 Latin America Connected Hardhats Market Estimates and Forecasts, by Component (2020-2032) (USD Million) 

9.6.4 Latin America Connected Hardhats Market Estimates and Forecasts, by End-Use(2020-2032) (USD Million)

9.6.5 Brazil

9.6.5.1 Brazil Connected Hardhats Market Estimates and Forecasts, by Component (2020-2032) (USD Million)

9.6.5.2 Brazil Connected Hardhats Market Estimates and Forecasts, by End-Use(2020-2032) (USD Million)

9.6.6 Argentina

9.6.6.1 Argentina Connected Hardhats Market Estimates and Forecasts, by Component (2020-2032) (USD Million)

9.6.6.2 Argentina Connected Hardhats Market Estimates and Forecasts, by End-Use(2020-2032) (USD Million)

9.6.7 Colombia

9.6.7.1 Colombia Connected Hardhats Market Estimates and Forecasts, by Component (2020-2032) (USD Million)

9.6.7.2 Colombia Connected Hardhats Market Estimates and Forecasts, by End-Use(2020-2032) (USD Million)

9.6.8 Rest of Latin America

9.6.8.1 Rest of Latin America Connected Hardhats Market Estimates and Forecasts, by Component (2020-2032) (USD Million)

9.6.8.2 Rest of Latin America Connected Hardhats Market Estimates and Forecasts, by End-Use(2020-2032) (USD Million)

10. Company Profiles

10.1 United Safety

  10.1.1 Company Overview

10.1.2 Financial

10.1.3 Products/ Services Offered

10.1.4 SWOT Analysis

10.2 Technosoft Engineering Projects Ltd.

10.2.1 Company Overview

10.2.2 Financial

10.2.3 Products/ Services Offered

10.2.4 SWOT Analysis

10.3 MSA Safety Incorporated

10.3.1 Company Overview

10.3.2 Financial

10.3.3 Products/ Services Offered

10.3.4 SWOT Analysis

10.4 Westinghouse Electric Company LLC

10.4.1 Company Overview

10.4.2 Financial

10.4.3 Products/ Services Offered

10.4.4 SWOT Analysis

10.5 Luceque

 10.5.1 Company Overview

10.5.2 Financial

10.5.3 Products/ Services Offered

10.5.4 SWOT Analysis

10.6 WakeCap Technologies

10.6.1 Company Overview

10.6.2 Financial

10.6.3 Products/ Services Offered

10.6.4 SWOT Analysis

10.7 Knowit

10.7.1 Company Overview

10.7.2 Financial

10.7.3 Products/ Services Offered

10.7.4 SWOT Analysis

10.8 GuangZhou Jepower Technology Co., Ltd.

10.8.1 Company Overview

10.8.2 Financial

10.8.3 Products/ Services Offered

10.8.4 SWOT Analysis

10.9 Excellent Webworld

10.9.1 Company Overview

10.9.2 Financial

10.9.3 Products/ Services Offered

10.9.4 SWOT Analysis

10.10 Twiceme Technology AB

10.10.1 Company Overview

10.10.2 Financial

10.10.3 Products/ Services Offered

10.10.4 SWOT Analysis

11. Use Cases and Best Practices

12. Conclusion

An accurate research report requires proper strategizing as well as implementation. There are multiple factors involved in the completion of good and accurate research report and selecting the best methodology to compete the research is the toughest part. Since the research reports we provide play a crucial role in any company’s decision-making process, therefore we at SNS Insider always believe that we should choose the best method which gives us results closer to reality. This allows us to reach at a stage wherein we can provide our clients best and accurate investment to output ratio.

Each report that we prepare takes a timeframe of 350-400 business hours for production. Starting from the selection of titles through a couple of in-depth brain storming session to the final QC process before uploading our titles on our website we dedicate around 350 working hours. The titles are selected based on their current market cap and the foreseen CAGR and growth.


The 5 steps process:

Step 1: Secondary Research:

Secondary Research or Desk Research is as the name suggests is a research process wherein, we collect data through the readily available information. In this process we use various paid and unpaid databases which our team has access to and gather data through the same. This includes examining of listed companies’ annual reports, Journals, SEC filling etc. Apart from this our team has access to various associations across the globe across different industries. Lastly, we have exchange relationships with various university as well as individual libraries.

Secondary Research

Step 2: Primary Research

When we talk about primary research, it is a type of study in which the researchers collect relevant data samples directly, rather than relying on previously collected data.  This type of research is focused on gaining content specific facts that can be sued to solve specific problems. Since the collected data is fresh and first hand therefore it makes the study more accurate and genuine.

We at SNS Insider have divided Primary Research into 2 parts.

Part 1 wherein we interview the KOLs of major players as well as the upcoming ones across various geographic regions. This allows us to have their view over the market scenario and acts as an important tool to come closer to the accurate market numbers. As many as 45 paid and unpaid primary interviews are taken from both the demand and supply side of the industry to make sure we land at an accurate judgement and analysis of the market.

This step involves the triangulation of data wherein our team analyses the interview transcripts, online survey responses and observation of on filed participants. The below mentioned chart should give a better understanding of the part 1 of the primary interview.

Primary Research

Part 2: In this part of primary research the data collected via secondary research and the part 1 of the primary research is validated with the interviews from individual consultants and subject matter experts.

Consultants are those set of people who have at least 12 years of experience and expertise within the industry whereas Subject Matter Experts are those with at least 15 years of experience behind their back within the same space. The data with the help of two main processes i.e., FGDs (Focused Group Discussions) and IDs (Individual Discussions). This gives us a 3rd party nonbiased primary view of the market scenario making it a more dependable one while collation of the data pointers.

Step 3: Data Bank Validation

Once all the information is collected via primary and secondary sources, we run that information for data validation. At our intelligence centre our research heads track a lot of information related to the market which includes the quarterly reports, the daily stock prices, and other relevant information. Our data bank server gets updated every fortnight and that is how the information which we collected using our primary and secondary information is revalidated in real time.

Data Bank Validation

Step 4: QA/QC Process

After all the data collection and validation our team does a final level of quality check and quality assurance to get rid of any unwanted or undesired mistakes. This might include but not limited to getting rid of the any typos, duplication of numbers or missing of any important information. The people involved in this process include technical content writers, research heads and graphics people. Once this process is completed the title gets uploader on our platform for our clients to read it.

Step 5: Final QC/QA Process:

This is the last process and comes when the client has ordered the study. In this process a final QA/QC is done before the study is emailed to the client. Since we believe in giving our clients a good experience of our research studies, therefore, to make sure that we do not lack at our end in any way humanly possible we do a final round of quality check and then dispatch the study to the client.

Key Segments:

By Component

  • Communication

  • Navigation

  • Camera

  • Others

By End-Use

  • Consumer

  • Manufacturing

  • Construction

  • Others

Request for Segment Customization as per your Business Requirement: Segment Customization Request

Regional Coverage:

North America

  • US

  • Canada

  • Mexico

Europe

  • Eastern Europe

    • Poland

    • Romania

    • Hungary

    • Turkey

    • Rest of Eastern Europe

  • Western Europe

    • Germany

    • France

    • UK

    • Italy

    • Spain

    • Netherlands

    • Switzerland

    • Austria

    • Rest of Western Europe

Asia Pacific

  • China

  • India

  • Japan

  • South Korea

  • Vietnam

  • Singapore

  • Australia

  • Rest of Asia Pacific

Middle East & Africa

  • Middle East

    • UAE

    • Egypt

    • Saudi Arabia

    • Qatar

    • Rest of Middle East

  • Africa

    • Nigeria

    • South Africa

    • Rest of Africa

Latin America

  • Brazil

  • Argentina

  • Colombia

  • Rest of Latin America

Request for Country Level Research Report: Country Level Customization Request

Available Customization

With the given market data, SNS Insider offers customization as per the company’s specific needs. The following customization options are available for the report:

  • Detailed Volume Analysis

  • Criss-Cross segment analysis (e.g. Product X Application)

  • Competitive Product Benchmarking

  • Geographic Analysis

  • Additional countries in any of the regions

  • Customized Data Representation

  • Detailed analysis and profiling of additional market players


  •            5000 (33% Discount)


  •            8950 (40% Discount)


  •            3050 (23% Discount)

Start a Conversation

Hi! Click one of our member below to chat on Phone