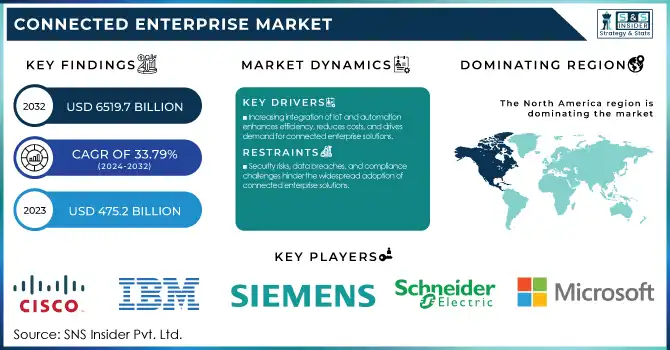
The Connected Enterprise Market was valued at USD 475.2 Billion in 2023 and is expected to reach USD 6519.7 Billion by 2032, growing at a CAGR of 33.79% from 2024-2032.
To Get more information on Connected Enterprise Market - Request Free Sample Report
Adoption of connected enterprise solutions varies by industry, with manufacturing, healthcare, and retail leading due to IoT integration and automation. Investment in these technologies is rising, particularly in North America and Asia-Pacific, fueled by digital transformation efforts. While cloud deployments are gaining traction for scalability, some industries opt for on-premises solutions due to security concerns. The rise of 5G is accelerating adoption by enabling faster data processing, low-latency applications, and improved connectivity for industrial automation and smart infrastructure.
Drivers
Increasing integration of IoT and automation enhances efficiency, reduces costs, and drives demand for connected enterprise solutions.
The growing adoption of IoT and automation across several industries like manufacturing, healthcare, and retail along with increasing demand from organizations for a connected enterprise is a key factor driving the growth of the connected enterprise market, As stated in the report. With the help of IoT-enabled devices and automation solutions, organizations are achieving operational efficiency, elimination of costs, and improved decision-making. Connected enterprises are changing business processes with the help of smart factories, predictive maintenance, and real-time data analytics. Also, AI and machine learning innovations are also boosting connectivity and automation technology, allowing companies to boost workflow efficiency and productivity. The global digital transformation is driving the world move toward seamless connectivity to facilitate real-time data exchange for various end-use industries which is the primary market growth factor worldwide.
Restraints
Security risks, data breaches, and compliance challenges hinder the widespread adoption of connected enterprise solutions.
Although connected enterprise solutions offer various benefits, data security and privacy concerns are a major factor hindering the market growth. With hundreds of connected systems generating vast amounts of sensitive data, enterprises are at risk of advanced cyber threats and breaches. This risk of data breaches, leaks, hacks raises concerns within companies, especially those in the finance or healthcare industries, where regulations are stricter. There is also the need to comply with regulations like GDPR and CCPA that mandate high levels of data protection. It must invest in better cybersecurity, which tends to increase operational expenses and delay adoption.
Opportunities
5G and edge computing enable faster, low-latency communication, enhancing IoT applications and real-time enterprise connectivity.
As 5G and edge computing networks deploy rapidly, they will open up one of the largest opportunities for the connected enterprise market. 5G facilitates super-low latency, high-speed data transmission, and high reliability, enabling real-time connectivity for devices and enterprise systems. On the other hand, edge computing enables processing closer to where the data is coming from, reducing reliance on centralized cloud infrastructure and improving latency. These improvements enrich IoT applications, and predictive analytics and facilitate AI-driven automation across verticals. 5G Edge integration is also predicted to open up immense new enterprise solutions, as businesses utilize high-speed connectivity for mission-critical operations, resulting in new business models, efficiencies, and enterprise solutions advancements.
Challenges
Legacy system compatibility, high investment costs, and interoperability issues slow down connected enterprise adoption.
Integration of diverse technologies and legacy systems is the biggest challenge in the connected enterprise market. Numerous organizations continue to perform in an older IT landscape not suitable for the modern connected enterprise solution. Migration to a complete integrated system is an expensive business involving different types of hardware, software, and skilled workforce, which increases the deployment cost. Lastly, interoperability problems among different platforms, devices, and vendors make adoption even trickier. Enterprises need to have a well-planned digital transformation strategy that can be quickly adopted and transform seamlessly, and less disruptive integration. Addressing these challenges will necessitate sound enterprise architecture as well as a combination of collaboration between partners and the implementation of open and established standards that allow different enterprise ecosystems to connect smoothly.
By Component
In 2023, the solutions segment dominated the market and accounted for 46% of revenue share, which held a revenue share of 44.2%. Segment growth is propelled by the expanded necessity for holistic and end-to-end solutions that integrate and orchestrate different facets of organizational operations. With the help of the technology like IoT, Cloud Computing, and making the use of the solutions with Mobile devices, businesses are now able to receive enormous data and analyze it through a single unified platform to manage both their operations and workforce.
Service segment is anticipated to grow at a considerable CAGR during the forecast period. This component is meeting massive adoption across the connected enterprise industry as the rising need for assistance and experience as connected enterprise solutions are managed. Growing inclination toward connected technologies across industries like IoT and cloud platforms has further fueled demand for connected enterprise services such as maintenance and managed services.
By Application
The Manufacturing segment dominated the market and accounted for significant revenue share in 2023, manufacturing units have adopted Industry 4.0 practices when manufacturers make use of IoT, automation, and analytics to enhance functional efficacy, reduce equipment downtime, and increase product quality. Furthermore, connected solutions facilitate real-time overview & management of different manufacturing activities, allowing for continuous production and predictive maintenance by cutting time.
The IT & telecom segment is expected to register the fastest CAGR during the forecast period. Some of the important market driving factors include enterprises towards next-generation communication technologies, and increasing investments in 5G infrastructure, an upsurge in demand for high-speed data connectivity. Cloud-based telecom services facilitate seamless communication and collaboration, spurring their annual increasing adoption.
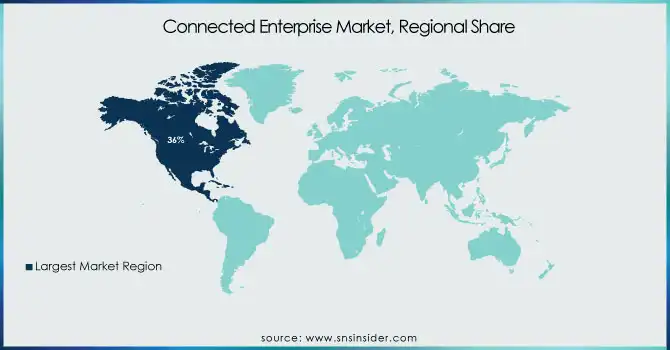
North America dominated the market and accounted for 36% of revenue share in 2023. The growth of this market can be attributed to the presence of a large number of technology companies all operating in the area, a high degree of focus on innovation, and a high early adoption rate of digital technologies.
The Asia Pacific region is expected to register the fastest CAGR during the forecasted period. Other factors contributing to the growth include rising industrialization with urbanization in the region, opening of numerous global companies, and a high tendency toward digital innovation adoption.
Get Customized Report as per Your Business Requirement - Enquiry Now
The major key players along with their products are
Cisco Systems, Inc. – Cisco IoT Control Center
IBM Corporation – IBM Maximo Application Suite
Siemens AG – Siemens MindSphere
Schneider Electric – EcoStruxure
Microsoft Corporation – Microsoft Azure IoT
Rockwell Automation, Inc. – FactoryTalk InnovationSuite
General Electric (GE) – GE Digital Predix
SAP SE – SAP Leonardo
Honeywell International Inc. – Honeywell Forge
Oracle Corporation – Oracle IoT Cloud Service
Bosch Software Innovations – Bosch IoT Suite
PTC Inc. – ThingWorx
Hitachi, Ltd. – Lumada
Amazon Web Services (AWS) – AWS IoT Core
Hewlett Packard Enterprise (HPE) – HPE Edgeline
November 2024: C3.ai announced a strategic partnership with Microsoft's Azure to provide cloud computing services targeting enterprise customers, aiming to accelerate AI adoption in various sectors.
October 2024: Optus partnered with Elon Musk's Starlink to offer enterprise-level internet services in remote Australian regions, enhancing connectivity for businesses with up to 500 employees.
September 2024: HPE announced plans to finance its $14 billion acquisition of Juniper Networks through a combination of term loans and a seven-part bond deal, aiming to double its networking business and strengthen its position in the AI-driven market.
|
Report Attributes |
Details |
|
Market Size in 2023 |
USD 475.2 Billion |
|
Market Size by 2032 |
USD 6519.7 Billion |
|
CAGR |
CAGR of 33.79% From 2024 to 2032 |
|
Base Year |
2023 |
|
Forecast Period |
2024-2032 |
|
Historical Data |
2020-2022 |
|
Report Scope & Coverage |
Market Size, Segments Analysis, Competitive Landscape, Regional Analysis, DROC & SWOT Analysis, Forecast Outlook |
|
Key Segments |
• By Component (Solution, Services, Platform) |
|
Regional Analysis/Coverage |
North America (US, Canada, Mexico), Europe (Eastern Europe [Poland, Romania, Hungary, Turkey, Rest of Eastern Europe] Western Europe] Germany, France, UK, Italy, Spain, Netherlands, Switzerland, Austria, Rest of Western Europe]), Asia Pacific (China, India, Japan, South Korea, Vietnam, Singapore, Australia, Rest of Asia Pacific), Middle East & Africa (Middle East [UAE, Egypt, Saudi Arabia, Qatar, Rest of Middle East], Africa [Nigeria, South Africa, Rest of Africa], Latin America (Brazil, Argentina, Colombia, Rest of Latin America) |
|
Company Profiles |
Cisco Systems, Inc., IBM Corporation, Siemens AG, Schneider Electric, Microsoft Corporation, Rockwell Automation, Inc., General Electric (GE), SAP SE, Honeywell International Inc., Oracle Corporation, Bosch Software Innovations, PTC Inc., Hitachi, Ltd., Amazon Web Services (AWS), Hewlett Packard Enterprise (HPE) |
Ans- The Connected Enterprise Market was valued at USD 475.2 Billion in 2023 and is expected to reach USD 6519.7 Billion by 2032
Ans- The CAGR of the Connected Enterprise Market during the forecast period is 33.79% from 2024-2032.
Ans- Asia-Pacific is expected to register the fastest CAGR during the forecast period.
Ans- Increasing integration of IoT and automation enhances efficiency, reduces costs, and drives demand for connected enterprise solutions.
Ans- Legacy system compatibility, high investment costs, and interoperability issues slow down connected enterprise adoption.
Table of Contents
1. Introduction
1.1 Market Definition
1.2 Scope (Inclusion and Exclusions)
1.3 Research Assumptions
2. Executive Summary
2.1 Market Overview
2.2 Regional Synopsis
2.3 Competitive Summary
3. Research Methodology
3.1 Top-Down Approach
3.2 Bottom-up Approach
3.3. Data Validation
3.4 Primary Interviews
4. Market Dynamics Impact Analysis
4.1 Market Driving Factors Analysis
4.1.2 Drivers
4.1.2 Restraints
4.1.3 Opportunities
4.1.4 Challenges
4.2 PESTLE Analysis
4.3 Porter’s Five Forces Model
5. Statistical Insights and Trends Reporting
5.1 Adoption Rates of Connected Enterprise Solutions, by Industry
5.2 Investment in Connected Enterprise Technologies, by Region
5.3 Cloud vs. On-Premises Connected Enterprise Deployments
5.4 Impact of 5G on Connected Enterprise Adoption, by Region
6. Competitive Landscape
6.1 List of Major Companies, By Region
6.2 Market Share Analysis, By Region
6.3 Product Benchmarking
6.3.1 Product specifications and features
6.3.2 Pricing
6.4 Strategic Initiatives
6.4.1 Marketing and promotional activities
6.4.2 Distribution and supply chain strategies
6.4.3 Expansion plans and new product launches
6.4.4 Strategic partnerships and collaborations
6.5 Technological Advancements
6.6 Market Positioning and Branding
7. Connected Enterprise Market Segmentation, by Component
7.1 Chapter Overview
7.2 Solution
7.2.1 Solution Market Trends Analysis (2020-2032)
7.2.2 Solution Market Size Estimates and Forecasts to 2032 (USD Billion)
7.2.3 Device Management
7.2.3.1 Device Management Market Trends Analysis (2020-2032)
7.2.3.2 Device Management Market Size Estimates and Forecasts to 2032 (USD Billion)
7.2.4 Connectivity Management
7.2.4.1 Connectivity Management Market Trends Analysis (2020-2032)
7.2.4.2 Connectivity Management Market Size Estimates and Forecasts to 2032 (USD Billion)
7.2.5 Application Enablement
7.2.5.1 Application Enablement Market Trends Analysis (2020-2032)
7.2.5.2 Application Enablement Market Size Estimates and Forecasts to 2032 (USD Billion)
7.3 Services
7.3.1 Services Market Trends Analysis (2020-2032)
7.3.2 Services Market Size Estimates and Forecasts to 2032 (USD Billion)
7.3.3 Real-Time Collaboration
7.3.3.1 Real-Time Collaboration Market Trends Analysis (2020-2032)
7.3.3.2 Real-Time Collaboration Market Size Estimates and Forecasts to 2032 (USD Billion)
7.3.4 Enterprise Infrastructure Management
7.3.4.1 Enterprise Infrastructure Management Market Trends Analysis (2020-2032)
7.3.4.2 Enterprise Infrastructure Management Market Size Estimates and Forecasts to 2032 (USD Billion)
7.3.5 Streaming Analytics
7.3.5.1 Streaming Analytics Market Trends Analysis (2020-2032)
7.3.5.2 Streaming Analytics Market Size Estimates and Forecasts to 2032 (USD Billion)
7.3.6 Security Solution
7.3.6.1 Security Solution Market Trends Analysis (2020-2032)
7.3.6.2 Security Solution Market Size Estimates and Forecasts to 2032 (USD Billion)
7.3.7 Data Management
7.3.7.1 Data Management Market Trends Analysis (2020-2032)
7.3.7.2 Data Management Market Size Estimates and Forecasts to 2032 (USD Billion)
7.3.8 Remote Monitoring System
7.3.8.1 Remote Monitoring System Market Trends Analysis (2020-2032)
7.3.8.2 Remote Monitoring System Market Size Estimates and Forecasts to 2032 (USD Billion)
7.3.9 Network Management
7.3.9.1 Network Management Market Trends Analysis (2020-2032)
7.3.9.2 Network Management Market Size Estimates and Forecasts to 2032 (USD Billion)
7.3.10 Mobile Workforce Management
7.3.10.1 Mobile Workforce Management Market Trends Analysis (2020-2032)
7.3.10.2 Mobile Workforce Management Market Size Estimates and Forecasts to 2032 (USD Billion)
7.3.11 Customer Experience Management
7.3.11.1 Customer Experience Management Market Trends Analysis (2020-2032)
7.3.11.2 Customer Experience Management Market Size Estimates and Forecasts to 2032 (USD Billion)
7.3.12 Asset Performance Management
7.3.12.1 Asset Performance Management Market Trends Analysis (2020-2032)
7.3.12.2 Asset Performance Management Market Size Estimates and Forecasts to 2032 (USD Billion)
7.4 Platform
7.4.1 Platform Market Trends Analysis (2020-2032)
7.4.2 Platform Market Size Estimates and Forecasts to 2032 (USD Billion)
7.4.3 Professional Services
7.4.3.1 Professional Services Market Trends Analysis (2020-2032)
7.4.3.2 Professional Services Market Size Estimates and Forecasts to 2032 (USD Billion)
7.4.4 Consulting Services
7.4.4.1 Consulting Services Market Trends Analysis (2020-2032)
7.4.4.2 Consulting Services Market Size Estimates and Forecasts to 2032 (USD Billion)
7.4.5 Integration and Deployment Services
7.4.5.1 Integration and Deployment Services Market Trends Analysis (2020-2032)
7.4.5.2 Integration and Deployment Services Market Size Estimates and Forecasts to 2032 (USD Billion)
7.4.6 Support and Maintenance
7.4.6.1 Support and Maintenance Market Trends Analysis (2020-2032)
7.4.6.2 Support and Maintenance Market Size Estimates and Forecasts to 2032 (USD Billion)
7.4.7 Managed Services
7.4.7.1 Managed Services Market Trends Analysis (2020-2032)
7.4.7.2 Managed Services Market Size Estimates and Forecasts to 2032 (USD Billion)
8. Connected Enterprise Market Segmentation, by Application
8.1 Chapter Overview
8.2 Manufacturing
8.2.1 Manufacturing Market Trends Analysis (2020-2032)
8.2.2 Manufacturing Market Size Estimates and Forecasts to 2032 (USD Billion)
8.3 BFSI
8.3.1BFSI Market Trends Analysis (2020-2032)
8.3.2BFSI Market Size Estimates and Forecasts to 2032 (USD Billion)
8.4 IT & Telecom
8.4.1IT & Telecom Market Trends Analysis (2020-2032)
8.4.2IT & Telecom Market Size Estimates and Forecasts to 2032 (USD Billion)
8.5 Retail
8.5.1Retail Market Trends Analysis (2020-2032)
8.5.2Retail Market Size Estimates and Forecasts to 2032 (USD Billion)
8.6 Healthcare
8.6.1Healthcare Market Trends Analysis (2020-2032)
8.6.2Healthcare Market Size Estimates and Forecasts to 2032 (USD Billion)
8.7 Food & Beverage
8.7.1Food & Beverage Market Trends Analysis (2020-2032)
8.7.2Food & Beverage Market Size Estimates and Forecasts to 2032 (USD Billion)
8.8 Others
8.8.1Others Market Trends Analysis (2020-2032)
8.8.2Others Market Size Estimates and Forecasts to 2032 (USD Billion)
9. Regional Analysis
9.1 Chapter Overview
9.2 North America
9.2.1 Trends Analysis
9.2.2 North America Connected Enterprise Market Estimates and Forecasts, by Country (2020-2032) (USD Billion)
9.2.3 North America Connected Enterprise Market Estimates and Forecasts, by Component (2020-2032) (USD Billion)
9.2.4 North America Connected Enterprise Market Estimates and Forecasts, by Application (2020-2032) (USD Billion)
9.2.5 USA
9.2.5.1 USA Connected Enterprise Market Estimates and Forecasts, by Component (2020-2032) (USD Billion)
9.2.5.2 USA Connected Enterprise Market Estimates and Forecasts, by Application (2020-2032) (USD Billion)
9.2.6 Canada
9.2.6.1 Canada Connected Enterprise Market Estimates and Forecasts, by Component (2020-2032) (USD Billion)
9.2.6.2 Canada Connected Enterprise Market Estimates and Forecasts, by Application (2020-2032) (USD Billion)
9.2.7 Mexico
9.2.7.1 Mexico Connected Enterprise Market Estimates and Forecasts, by Component (2020-2032) (USD Billion)
9.2.7.2 Mexico Connected Enterprise Market Estimates and Forecasts, by Application (2020-2032) (USD Billion)
9.3 Europe
9.3.1 Eastern Europe
9.3.1.1 Trends Analysis
9.3.1.2 Eastern Europe Connected Enterprise Market Estimates and Forecasts, by Country (2020-2032) (USD Billion)
9.3.1.3 Eastern Europe Connected Enterprise Market Estimates and Forecasts, by Component (2020-2032) (USD Billion)
9.3.1.4 Eastern Europe Connected Enterprise Market Estimates and Forecasts, by Application (2020-2032) (USD Billion)
9.3.1.5 Poland
9.3.1.5.1 Poland Connected Enterprise Market Estimates and Forecasts, by Component (2020-2032) (USD Billion)
9.3.1.5.2 Poland Connected Enterprise Market Estimates and Forecasts, by Application (2020-2032) (USD Billion)
9.3.1.6 Romania
9.3.1.6.1 Romania Connected Enterprise Market Estimates and Forecasts, by Component (2020-2032) (USD Billion)
9.3.1.6.2 Romania Connected Enterprise Market Estimates and Forecasts, by Application (2020-2032) (USD Billion)
9.3.1.7 Hungary
9.3.1.7.1 Hungary Connected Enterprise Market Estimates and Forecasts, by Component (2020-2032) (USD Billion)
9.3.1.7.2 Hungary Connected Enterprise Market Estimates and Forecasts, by Application (2020-2032) (USD Billion)
9.3.1.8 Turkey
9.3.1.8.1 Turkey Connected Enterprise Market Estimates and Forecasts, by Component (2020-2032) (USD Billion)
9.3.1.8.2 Turkey Connected Enterprise Market Estimates and Forecasts, by Application (2020-2032) (USD Billion)
9.3.1.9 Rest of Eastern Europe
9.3.1.9.1 Rest of Eastern Europe Connected Enterprise Market Estimates and Forecasts, by Component (2020-2032) (USD Billion)
9.3.1.9.2 Rest of Eastern Europe Connected Enterprise Market Estimates and Forecasts, by Application (2020-2032) (USD Billion)
9.3.2 Western Europe
9.3.2.1 Trends Analysis
9.3.2.2 Western Europe Connected Enterprise Market Estimates and Forecasts, by Country (2020-2032) (USD Billion)
9.3.2.3 Western Europe Connected Enterprise Market Estimates and Forecasts, by Component (2020-2032) (USD Billion)
9.3.2.4 Western Europe Connected Enterprise Market Estimates and Forecasts, by Application (2020-2032) (USD Billion)
9.3.2.5 Germany
9.3.2.5.1 Germany Connected Enterprise Market Estimates and Forecasts, by Component (2020-2032) (USD Billion)
9.3.2.5.2 Germany Connected Enterprise Market Estimates and Forecasts, by Application (2020-2032) (USD Billion)
9.3.2.6 France
9.3.2.6.1 France Connected Enterprise Market Estimates and Forecasts, by Component (2020-2032) (USD Billion)
9.3.2.6.2 France Connected Enterprise Market Estimates and Forecasts, by Application (2020-2032) (USD Billion)
9.3.2.7 UK
9.3.2.7.1 UK Connected Enterprise Market Estimates and Forecasts, by Component (2020-2032) (USD Billion)
9.3.2.7.2 UK Connected Enterprise Market Estimates and Forecasts, by Application (2020-2032) (USD Billion)
9.3.2.8 Italy
9.3.2.8.1 Italy Connected Enterprise Market Estimates and Forecasts, by Component (2020-2032) (USD Billion)
9.3.2.8.2 Italy Connected Enterprise Market Estimates and Forecasts, by Application (2020-2032) (USD Billion)
9.3.2.9 Spain
9.3.2.9.1 Spain Connected Enterprise Market Estimates and Forecasts, by Component (2020-2032) (USD Billion)
9.3.2.9.2 Spain Connected Enterprise Market Estimates and Forecasts, by Application (2020-2032) (USD Billion)
9.3.2.10 Netherlands
9.3.2.10.1 Netherlands Connected Enterprise Market Estimates and Forecasts, by Component (2020-2032) (USD Billion)
9.3.2.10.2 Netherlands Connected Enterprise Market Estimates and Forecasts, by Application (2020-2032) (USD Billion)
9.3.2.11 Switzerland
9.3.2.11.1 Switzerland Connected Enterprise Market Estimates and Forecasts, by Component (2020-2032) (USD Billion)
9.3.2.11.2 Switzerland Connected Enterprise Market Estimates and Forecasts, by Application (2020-2032) (USD Billion)
9.3.2.12 Austria
9.3.2.12.1 Austria Connected Enterprise Market Estimates and Forecasts, by System (2020-2032) (USD Billion)
9.3.2.12.2 Austria Connected Enterprise Market Estimates and Forecasts, by Application (2020-2032) (USD Billion)
9.3.2.13 Rest of Western Europe
9.3.2.13.1 Rest of Western Europe Connected Enterprise Market Estimates and Forecasts, by Component (2020-2032) (USD Billion)
9.3.2.13.2 Rest of Western Europe Connected Enterprise Market Estimates and Forecasts, by Application (2020-2032) (USD Billion)
9.4 Asia Pacific
9.4.1 Trends Analysis
9.4.2 Asia Pacific Connected Enterprise Market Estimates and Forecasts, by Country (2020-2032) (USD Billion)
9.4.3 Asia Pacific Connected Enterprise Market Estimates and Forecasts, by Component (2020-2032) (USD Billion)
9.4.4 Asia Pacific Connected Enterprise Market Estimates and Forecasts, by Application (2020-2032) (USD Billion)
9.4.5 China
9.4.5.1 China Connected Enterprise Market Estimates and Forecasts, by Component (2020-2032) (USD Billion)
9.4.5.2 China Connected Enterprise Market Estimates and Forecasts, by Application (2020-2032) (USD Billion)
9.4.6 India
9.4.5.1 India Connected Enterprise Market Estimates and Forecasts, by Component (2020-2032) (USD Billion)
9.4.5.2 India Connected Enterprise Market Estimates and Forecasts, by Application (2020-2032) (USD Billion)
9.4.5 Japan
9.4.5.1 Japan Connected Enterprise Market Estimates and Forecasts, by Component (2020-2032) (USD Billion)
9.4.5.2 Japan Connected Enterprise Market Estimates and Forecasts, by Application (2020-2032) (USD Billion)
9.4.6 South Korea
9.4.6.1 South Korea Connected Enterprise Market Estimates and Forecasts, by Component (2020-2032) (USD Billion)
9.4.6.2 South Korea Connected Enterprise Market Estimates and Forecasts, by Application (2020-2032) (USD Billion)
9.4.7 Vietnam
9.4.7.1 Vietnam Connected Enterprise Market Estimates and Forecasts, by Component (2020-2032) (USD Billion)
9.2.7.2 Vietnam Connected Enterprise Market Estimates and Forecasts, by Application (2020-2032) (USD Billion)
9.4.8 Singapore
9.4.8.1 Singapore Connected Enterprise Market Estimates and Forecasts, by Component (2020-2032) (USD Billion)
9.4.8.2 Singapore Connected Enterprise Market Estimates and Forecasts, by Application (2020-2032) (USD Billion)
9.4.9 Australia
9.4.9.1 Australia Connected Enterprise Market Estimates and Forecasts, by Component (2020-2032) (USD Billion)
9.4.9.2 Australia Connected Enterprise Market Estimates and Forecasts, by Application (2020-2032) (USD Billion)
9.4.10 Rest of Asia Pacific
9.4.10.1 Rest of Asia Pacific Connected Enterprise Market Estimates and Forecasts, by Component (2020-2032) (USD Billion)
9.4.10.2 Rest of Asia Pacific Connected Enterprise Market Estimates and Forecasts, by Application (2020-2032) (USD Billion)
9.5 Middle East and Africa
9.5.1 Middle East
9.5.1.1 Trends Analysis
9.5.1.2 Middle East Connected Enterprise Market Estimates and Forecasts, by Country (2020-2032) (USD Billion)
9.5.1.3 Middle East Connected Enterprise Market Estimates and Forecasts, by Component (2020-2032) (USD Billion)
9.5.1.4 Middle East Connected Enterprise Market Estimates and Forecasts, by Application (2020-2032) (USD Billion)
9.5.1.5 UAE
9.5.1.5.1 UAE Connected Enterprise Market Estimates and Forecasts, by Component (2020-2032) (USD Billion)
9.5.1.5.2 UAE Connected Enterprise Market Estimates and Forecasts, by Application (2020-2032) (USD Billion)
9.5.1.6 Egypt
9.5.1.6.1 Egypt Connected Enterprise Market Estimates and Forecasts, by Component (2020-2032) (USD Billion)
9.5.1.6.2 Egypt Connected Enterprise Market Estimates and Forecasts, by Application (2020-2032) (USD Billion)
9.5.1.7 Saudi Arabia
9.5.1.7.1 Saudi Arabia Connected Enterprise Market Estimates and Forecasts, by Component (2020-2032) (USD Billion)
9.5.1.7.2 Saudi Arabia Connected Enterprise Market Estimates and Forecasts, by Application (2020-2032) (USD Billion)
9.5.1.8 Qatar
9.5.1.8.1 Qatar Connected Enterprise Market Estimates and Forecasts, by Component (2020-2032) (USD Billion)
9.5.1.8.2 Qatar Connected Enterprise Market Estimates and Forecasts, by Application (2020-2032) (USD Billion)
9.5.1.9 Rest of Middle East
9.5.1.9.1 Rest of Middle East Connected Enterprise Market Estimates and Forecasts, by Component (2020-2032) (USD Billion)
9.5.1.9.2 Rest of Middle East Connected Enterprise Market Estimates and Forecasts, by Application (2020-2032) (USD Billion)
9.5.2 Africa
9.5.2.1 Trends Analysis
9.5.2.2 Africa Connected Enterprise Market Estimates and Forecasts, by Country (2020-2032) (USD Billion)
9.5.2.3 Africa Connected Enterprise Market Estimates and Forecasts, by Component (2020-2032) (USD Billion)
9.5.2.4 Africa Connected Enterprise Market Estimates and Forecasts, by Application (2020-2032) (USD Billion)
9.5.2.5 South Africa
9.5.2.5.1 South Africa Connected Enterprise Market Estimates and Forecasts, by Component (2020-2032) (USD Billion)
9.5.2.5.2 South Africa Connected Enterprise Market Estimates and Forecasts, by Application (2020-2032) (USD Billion)
9.5.2.6 Nigeria
9.5.2.6.1 Nigeria Connected Enterprise Market Estimates and Forecasts, by Component (2020-2032) (USD Billion)
9.5.2.6.2 Nigeria Connected Enterprise Market Estimates and Forecasts, by Application (2020-2032) (USD Billion)
9.5.2.7 Rest of Africa
9.5.2.7.1 Rest of Africa Connected Enterprise Market Estimates and Forecasts, by Component (2020-2032) (USD Billion)
9.5.2.7.2 Rest of Africa Connected Enterprise Market Estimates and Forecasts, by Application (2020-2032) (USD Billion)
9.6 Latin America
9.6.1 Trends Analysis
9.6.2 Latin America Connected Enterprise Market Estimates and Forecasts, by Country (2020-2032) (USD Billion)
9.6.3 Latin America Connected Enterprise Market Estimates and Forecasts, by Component (2020-2032) (USD Billion)
9.6.4 Latin America Connected Enterprise Market Estimates and Forecasts, by Application (2020-2032) (USD Billion)
9.6.5 Brazil
9.6.5.1 Brazil Connected Enterprise Market Estimates and Forecasts, by Component (2020-2032) (USD Billion)
9.6.5.2 Brazil Connected Enterprise Market Estimates and Forecasts, by Application (2020-2032) (USD Billion)
9.6.6 Argentina
9.6.6.1 Argentina Connected Enterprise Market Estimates and Forecasts, by Component (2020-2032) (USD Billion)
9.6.6.2 Argentina Connected Enterprise Market Estimates and Forecasts, by Application (2020-2032) (USD Billion)
9.6.7 Colombia
9.6.7.1 Colombia Connected Enterprise Market Estimates and Forecasts, by Component (2020-2032) (USD Billion)
9.6.7.2 Colombia Connected Enterprise Market Estimates and Forecasts, by Application (2020-2032) (USD Billion)
9.6.8 Rest of Latin America
9.6.8.1 Rest of Latin America Connected Enterprise Market Estimates and Forecasts, by Component (2020-2032) (USD Billion)
9.6.8.2 Rest of Latin America Connected Enterprise Market Estimates and Forecasts, by Application (2020-2032) (USD Billion)
10. Company Profiles
10.1 Cisco Systems, Inc.
10.1.1 Company Overview
10.1.2 Financial
10.1.3 Products/ Services Offered
110.1.4 SWOT Analysis
10.2 IBM Corporation
10.2.1 Company Overview
10.2.2 Financial
10.2.3 Products/ Services Offered
10.2.4 SWOT Analysis
10.3 Siemens AG
10.3.1 Company Overview
10.3.2 Financial
10.3.3 Products/ Services Offered
10.3.4 SWOT Analysis
10.4 Schneider Electric
10.4.1 Company Overview
10.4.2 Financial
10.4.3 Products/ Services Offered
10.4.4 SWOT Analysis
10.5 Microsoft Corporation
10.5.1 Company Overview
10.5.2 Financial
10.5.3 Products/ Services Offered
10.5.4 SWOT Analysis
10.6 Rockwell Automation, Inc
10.6.1 Company Overview
10.6.2 Financial
10.6.3 Products/ Services Offered
10.6.4 SWOT Analysis
10.7 General Electric (GE)
10.7.1 Company Overview
10.7.2 Financial
10.7.3 Products/ Services Offered
10.7.4 SWOT Analysis
10.8 SAP SE
10.8.1 Company Overview
10.8.2 Financial
10.8.3 Products/ Services Offered
10.8.4 SWOT Analysis
10.9 Honeywell International Inc.
10.9.1 Company Overview
10.9.2 Financial
10.9.3 Products/ Services Offered
10.9.4 SWOT Analysis
10.10 Oracle Corporation
10.9.1 Company Overview
10.9.2 Financial
10.9.3 Products/ Services Offered
10.9.4 SWOT Analysis
11. Use Cases and Best Practices
12. Conclusion
An accurate research report requires proper strategizing as well as implementation. There are multiple factors involved in the completion of good and accurate research report and selecting the best methodology to compete the research is the toughest part. Since the research reports we provide play a crucial role in any company’s decision-making process, therefore we at SNS Insider always believe that we should choose the best method which gives us results closer to reality. This allows us to reach at a stage wherein we can provide our clients best and accurate investment to output ratio.
Each report that we prepare takes a timeframe of 350-400 business hours for production. Starting from the selection of titles through a couple of in-depth brain storming session to the final QC process before uploading our titles on our website we dedicate around 350 working hours. The titles are selected based on their current market cap and the foreseen CAGR and growth.
The 5 steps process:
Step 1: Secondary Research:
Secondary Research or Desk Research is as the name suggests is a research process wherein, we collect data through the readily available information. In this process we use various paid and unpaid databases which our team has access to and gather data through the same. This includes examining of listed companies’ annual reports, Journals, SEC filling etc. Apart from this our team has access to various associations across the globe across different industries. Lastly, we have exchange relationships with various university as well as individual libraries.

Step 2: Primary Research
When we talk about primary research, it is a type of study in which the researchers collect relevant data samples directly, rather than relying on previously collected data. This type of research is focused on gaining content specific facts that can be sued to solve specific problems. Since the collected data is fresh and first hand therefore it makes the study more accurate and genuine.
We at SNS Insider have divided Primary Research into 2 parts.
Part 1 wherein we interview the KOLs of major players as well as the upcoming ones across various geographic regions. This allows us to have their view over the market scenario and acts as an important tool to come closer to the accurate market numbers. As many as 45 paid and unpaid primary interviews are taken from both the demand and supply side of the industry to make sure we land at an accurate judgement and analysis of the market.
This step involves the triangulation of data wherein our team analyses the interview transcripts, online survey responses and observation of on filed participants. The below mentioned chart should give a better understanding of the part 1 of the primary interview.

Part 2: In this part of primary research the data collected via secondary research and the part 1 of the primary research is validated with the interviews from individual consultants and subject matter experts.
Consultants are those set of people who have at least 12 years of experience and expertise within the industry whereas Subject Matter Experts are those with at least 15 years of experience behind their back within the same space. The data with the help of two main processes i.e., FGDs (Focused Group Discussions) and IDs (Individual Discussions). This gives us a 3rd party nonbiased primary view of the market scenario making it a more dependable one while collation of the data pointers.
Step 3: Data Bank Validation
Once all the information is collected via primary and secondary sources, we run that information for data validation. At our intelligence centre our research heads track a lot of information related to the market which includes the quarterly reports, the daily stock prices, and other relevant information. Our data bank server gets updated every fortnight and that is how the information which we collected using our primary and secondary information is revalidated in real time.

Step 4: QA/QC Process
After all the data collection and validation our team does a final level of quality check and quality assurance to get rid of any unwanted or undesired mistakes. This might include but not limited to getting rid of the any typos, duplication of numbers or missing of any important information. The people involved in this process include technical content writers, research heads and graphics people. Once this process is completed the title gets uploader on our platform for our clients to read it.
Step 5: Final QC/QA Process:
This is the last process and comes when the client has ordered the study. In this process a final QA/QC is done before the study is emailed to the client. Since we believe in giving our clients a good experience of our research studies, therefore, to make sure that we do not lack at our end in any way humanly possible we do a final round of quality check and then dispatch the study to the client.
Key Segmentation:
By Component
Solution
Device Management
Connectivity Management
Application Enablement
Services
Real-Time Collaboration
Enterprise Infrastructure Management
Streaming Analytics
Security Solution
Data Management
Remote Monitoring System
Network Management
Mobile Workforce Management
Customer Experience Management
Asset Performance Management
Platform
Professional Services
Consulting Services
Integration and Deployment Services
Support and Maintenance
Managed Services
By Application
Manufacturing
BFSI
IT & Telecom
Retail
Healthcare
Food & Beverage
Others
Request for Segment Customization as per your Business Requirement: Segment Customization Request
Regional Coverage:
North America
US
Canada
Mexico
Europe
Eastern Europe
Poland
Romania
Hungary
Turkey
Rest of Eastern Europe
Western Europe
Germany
France
UK
Italy
Spain
Netherlands
Switzerland
Austria
Rest of Western Europe
Asia Pacific
China
India
Japan
South Korea
Vietnam
Singapore
Australia
Rest of Asia Pacific
Middle East & Africa
Middle East
UAE
Egypt
Saudi Arabia
Qatar
Rest of Middle East
Africa
Nigeria
South Africa
Rest of Africa
Latin America
Brazil
Argentina
Colombia
Rest of Latin America
Request for Country Level Research Report: Country Level Customization Request
Available Customization
With the given market data, SNS Insider offers customization as per the company’s specific needs. The following customization options are available for the report:
Detailed Volume Analysis
Criss-Cross segment analysis (e.g. Product X Application)
Competitive Product Benchmarking
Geographic Analysis
Additional countries in any of the regions
Customized Data Representation
Detailed analysis and profiling of additional market players
The Over-the-Top (OTT) Market size was valued at USD 235.8 Billion in 2023 and is expected to reach USD 1390.8 Billion and CAGR of 21.8% by 2032.
The Blockchain Market Size was valued at USD 11.31 Billion in 2023 and is expected to reach USD 988.83 Billion by 2032 and grow at a CAGR of 64.4% by 2032.
The Contact Center Software Market was valued at USD 42.09 billion in 2023 and will reach USD 227.03 billion by 2032, growing at a CAGR of 20.64% by 2032.
The Image Recognition Market Size was valued at USD 45.6 Billion in 2023 and will reach USD 165.2 Billion by 2032, growing at a CAGR of 15.4% by 2032.
Digital Twin Market Size was valued at USD 16.2 Billion in 2023 and is expected to reach USD 287.2 Billion by 2032, growing at a CAGR of 37.7 % over the forecast period 2024-2032.
A2P Messaging Market Size was valued at USD 70.01 Bn in 2023 and is expected to reach USD 106.12 Bn by 2032, while growing at a CAGR of 4.73% over 2024-2032.

Hi! Click one of our member below to chat on Phone
© 2025 All Rights Reserved by SNS Insider Pvt Ltd


