image

Connected Device Analytics Market Report Scope & Overview:

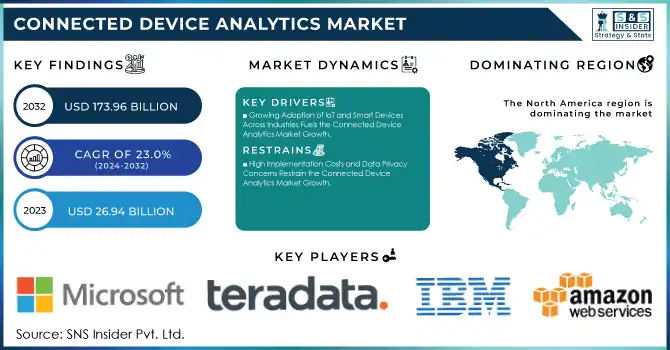
The Connected Device Analytics Market Size was valued at USD 26.94 Billion in 2023 and is expected to reach USD 173.96 Billion by 2032 and grow at a CAGR of 23.0% over the forecast period 2024-2032.

Connected Device Analytics Market Revenue Analysis

To Get More Information on Connected Device Analytics Market - Request Sample Report

The Connected Device Analytics Market is experiencing rapid growth, driven by the increasing adoption of Internet of Things (IoT) devices, big data analytics, and artificial intelligence (AI) across industries. Organizations are leveraging connected device analytics to extract valuable insights from vast amounts of real-time data generated by smart devices, sensors, and edge computing systems. The ability to analyze this data effectively helps businesses improve operational efficiency, enhance customer experiences, optimize asset management, and enable predictive maintenance.

This expansion is fueled by the increasing focus on remote monitoring, the adoption of smart payment technologies, and the need for businesses to build digital infrastructures for large-scale deployments. In the United States, the federal government has recognized the importance of securing connected devices, leading to the introduction of the U.S. Cyber Trust Mark Initiative. This voluntary program allows manufacturers to label their products, such as baby monitors and home security cameras, with a distinctive shield logo and QR codes if they meet federal cybersecurity standards, helping consumers identify devices that are less vulnerable to hacking. The initiative aims to enhance consumer confidence in connected devices and encourage manufacturers to improve their cybersecurity practices. As the number of internet-connected devices in American households continues to rise, with the average household now having 21 such devices, the demand for robust analytics solutions to manage and secure these devices is expected to grow, further propelling the connected device analytics market.

Connected Device Analytics Market Market Dynamics

Key Drivers:

  • Growing Adoption of IoT and Smart Devices Across Industries Fuels the Connected Device Analytics Market Growth

The rapid proliferation of Internet of Things (IoT) devices across various industries is a significant driver of the Connected Device Analytics Market. Businesses are integrating IoT-enabled solutions to enhance operational efficiency, improve decision-making, and optimize asset performance. Industries such as manufacturing, healthcare, retail, and transportation are deploying smart sensors, connected wearables, and industrial IoT (IIoT) devices to collect and analyze vast amounts of real-time data. With enterprises generating massive datasets from these devices, there is an increasing demand for advanced analytics solutions to process, interpret, and derive actionable insights. Additionally, IoT-powered remote monitoring systems enable companies to track assets, predict maintenance needs, and enhance security measures, thereby reducing downtime and improving business outcomes.

According to Research, the number of IoT-connected devices worldwide is projected to reach 30.9 billion by 2025, demonstrating the immense potential for connected device analytics. As organizations continue to digitize their operations and leverage data-driven intelligence, the demand for real-time analytics, cloud-based solutions, and AI-powered insights will further propel the Connected Device Analytics Market forward.

  • Rising Need for Predictive Maintenance and Remote Monitoring Accelerates the Connected Device Analytics Market Expansion

The increasing need for predictive maintenance and remote monitoring solutions is significantly driving the growth of the Connected Device Analytics Market. Industries such as energy, manufacturing, transportation, and healthcare rely on real-time analytics to monitor the performance of connected assets and prevent system failures. Predictive maintenance solutions use AI, machine learning, and big data analytics to analyze data from connected sensors and detect potential issues before they lead to costly breakdowns. This proactive approach minimizes downtime, reduces maintenance costs, and enhances operational efficiency. Remote monitoring, another crucial application, enables organizations to track machinery, optimize supply chains, and ensure regulatory compliance without the need for physical inspections.

For instance, in the healthcare sector, remote patient monitoring devices equipped with analytics capabilities help doctors track vital signs, detect abnormalities, and provide timely medical interventions. Similarly, smart grid systems use connected device analytics to monitor electricity distribution and detect faults in power lines, improving energy efficiency.

As businesses prioritize cost-saving measures and automation, the demand for connected device analytics solutions in predictive maintenance and remote monitoring is expected to witness substantial growth in the coming years.

Restrain:

  • High Implementation Costs and Data Privacy Concerns Restrain the Connected Device Analytics Market Growth

Despite its rapid expansion, the Connected Device Analytics Market faces challenges due to the high implementation costs and growing concerns over data privacy and security. Deploying connected device analytics solutions requires substantial investments in hardware, software, and cloud infrastructure, making it challenging for small and medium-sized enterprises (SMEs) to adopt these technologies. The need for advanced AI-driven platforms, real-time processing capabilities, and edge computing solutions further escalates costs, limiting adoption among budget-conscious businesses.

Additionally, as connected devices collect and transmit vast amounts of sensitive data, concerns regarding cybersecurity threats, data breaches, and regulatory compliance continue to hinder market growth. Industries handling critical information, such as healthcare and finance, are particularly cautious about integrating connected analytics due to strict data protection laws like GDPR and HIPAA. The risk of unauthorized access, hacking, and data manipulation further discourages companies from fully leveraging connected analytics solutions. Addressing these concerns requires robust encryption techniques, AI-driven security frameworks, and government regulations to ensure data privacy and protection. While the Connected Device Analytics Market continues to grow, overcoming cost and security challenges will be crucial for widespread adoption across industries.

Connected Device Analytics Market Segments Analysis

By Component

In 2023, the Solution segment dominated the connected device analytics Market, accounting for 64% of the revenue share. This dominance is attributed to the increasing demand for comprehensive analytics platforms that enable organizations to process and interpret vast amounts of data generated by connected devices. Companies are actively developing and launching advanced solutions to cater to this demand.

For instance, in October 2024, Oura introduced the Oura Ring 4, a smart ring equipped with enhanced health tracking capabilities, allowing users to monitor various health metrics through advanced analytics. Similarly, in August 2024, Jaguar and Vodafone demonstrated vehicles equipped with Vodafone's "smart hub," transforming cars into Wi-Fi hotspots and enhancing GPS and data capabilities, showcasing the integration of connected device analytics in the automotive sector.

The Services segment of the Connected Device Analytics Market is experiencing a significant growth trajectory, with a Compound Annual Growth Rate (CAGR) of 23.99% during the forecasted period. This rapid expansion is driven by the increasing need for specialized services that assist organizations in implementing, managing, and optimizing connected device analytics solutions. Companies are launching tailored services to meet these demands.

For example, in 2025, several firms introduced consulting and managed services aimed at helping businesses integrate advanced analytics into their operations seamlessly. These services encompass system integration, data management, and continuous support, ensuring that organizations can effectively leverage analytics tools to gain actionable insights.

By Organization Size

In 2023, the Large Enterprise segment dominated the Connected Device Analytics Market, accounting for 63% of the revenue share. Large enterprises are heavily investing in connected device analytics solutions to improve operational efficiency, enhance customer experience, and drive digital transformation. These organizations leverage advanced analytics platforms to process and analyze the massive volumes of data generated by connected devices across their operations.

For example, IBM’s Watson IoT platform helps enterprises derive actionable insights from connected devices, which leads to smarter decision-making and resource optimization.

The Small and Medium-Sized Enterprise (SME) segment is experiencing the largest Compound Annual Growth Rate (CAGR) at 24.01% within the forecasted period in the Connected Device Analytics Market. This growth is driven by the increasing availability of cost-effective, scalable analytics solutions and the digital transformation of SMEs. Companies like Google and AWS have launched cloud-based platforms that allow SMEs to deploy connected device analytics without requiring significant upfront investments in hardware or infrastructure.

For instance, AWS IoT Analytics provides SMEs with tools to process, analyze, and visualize data generated by connected devices, making it easier for smaller organizations to leverage advanced analytics without large capital expenditures.

Regional Analysis

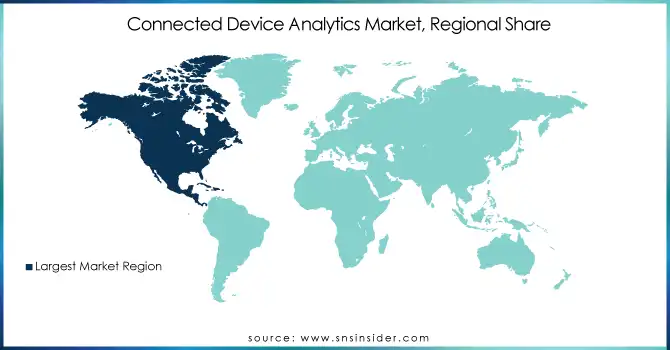
In 2023, North America dominated the Connected Device Analytics Market, accounting for a significant portion of the market share. The region is expected to continue leading in terms of market share due to its advanced technological infrastructure, high adoption rate of IoT devices, and increasing investments in digital transformation. The estimated market share for North America in the Connected Device Analytics Market is around 38%. The dominance of North America can be attributed to the presence of major players such as Microsoft, IBM, Cisco, and AWS, which have consistently innovated and developed cutting-edge solutions in IoT, big data analytics, and AI.

For example, IBM’s Watson IoT platform and Cisco’s Connected Device Analytics Solutions are widely used by enterprises in North America to streamline operations, enhance asset management, and improve predictive maintenance.

The Asia Pacific (APAC) region is the fastest-growing market for connected device analytics, with an estimated CAGR of 25.58% during the forecasted period. This rapid growth is driven by the increasing adoption of IoT devices, the expansion of smart cities, and the ongoing digital transformation initiatives across countries like China, Japan, India, and South Korea.

For instance, China has become a global leader in smart manufacturing and IoT applications, with the government actively promoting smart factory initiatives under the Made in China 2025 plan. Companies in India are also increasingly leveraging connected device analytics to optimize operations in sectors like agriculture, logistics, and healthcare, where real-time data monitoring is crucial for enhancing productivity and efficiency.

Additionally, Japan's technological advancements in robotics and smart healthcare devices are contributing to the growing demand for connected device analytics. The rise of the smartphone and wearable device markets is also boosting demand for connected device analytics solutions in the APAC region, as consumers and businesses seek real-time health tracking and predictive analytics. The significant investments from both governments and private organizations in IoT infrastructure and cloud computing technologies are expected to propel APAC to maintain its position as the fastest-growing region in the connected device analytics market.

Connected-Device-Analytics-Market-Regional-Share

Do You Need any Customization Research on Connected Device Analytics Market - Enquire Now

Key Players

Some of the major players in the Connected Device Analytics Market are:

  • Microsoft (US) (Azure IoT, Power BI)

  • Oracle Corporation (US) (Oracle IoT Cloud, Oracle Analytics Cloud)

  • IBM Corporation (US) (IBM Watson IoT, IBM Cognos Analytics)

  • SAP SE (Germany) (SAP Leonardo IoT, SAP Analytics Cloud)

  • PTC (US) (ThingWorx, Kepware)

  • Cisco (US) (Cisco Kinetic, Cisco Jasper)

  • Google (US) (Google Cloud IoT Core, Google BigQuery)

  • SAS Institute (US) (SAS IoT Analytics, SAS Visual Analytics)

  • Adobe (US) (Adobe Analytics, Adobe Sensei)

  • Teradata (US) (Teradata Vantage, Teradata IoT Analytics)

  • AWS (US) (AWS IoT Analytics, Amazon QuickSight)

  • HPE (US) (HPE Edgeline, HPE Vertica)

  • Hitachi (Japan) (Hitachi Lumada, Pentaho)

  • Software AG (Germany) (Cumulocity IoT, TrendMiner)

  • GE (US) (GE Digital Predix, GE APM (Asset Performance Management))

  • Cloudera (US) (Cloudera DataFlow, Cloudera Machine Learning)

  • Guavus (US) (Guavus AI-based Analytics, Guavus Reflex)

  • Splunk (US) (Splunk Industrial IoT, Splunk Enterprise)

  • TIBCO Software (US) (TIBCO Spotfire, TIBCO Streaming)

  • Qlik (US) (Qlik Sense, Qlik Data Integration)

  • Salesforce (US) (Salesforce IoT Cloud, Tableau)

  • Infor (US) (Infor IoT, Infor Birst)

  • Mnubo (Canada) (Mnubo SmartObjects, Mnubo Data Science Studio)

  • Arundo Analytics (US) (Arundo Edge, Arundo Analytics Platform)

  • Iguazio (Israel) (Iguazio Data Science Platform, Iguazio Nuclio)

  • Striim (US) (Striim Real-time Streaming, Striim Cloud)

Recent Trends

  • In January 24, 2023, Microsoft announced the acquisition of Aquantive, a provider of connected device analytics Component. The acquisition will help Microsoft to expand its offering in the connected device analytics market.

  • In January 2025, ServiceNow announced an integration with Oracle's Autonomous Database and Oracle Database 23ai. This collaboration enhanced ServiceNow's Workflow Data Fabric capabilities by enabling zero-copy data sharing and bi-directional data exchange, connecting real-time data between Oracle's databases and the ServiceNow platform. The integration aimed to improve intelligent decision-making and operational efficiency for enterprises.

Connected Device Analytics Market Report Scope:

Report Attributes Details
Market Size in 2023 US$ 26.94 Billion
Market Size by 2032 US$ 173.96 Billion
CAGR CAGR of 23.0 % From 2024 to 2032
Base Year 2023
Forecast Period 2024-2032
Historical Data 2020-2022
Report Scope & Coverage Market Size, Segments Analysis, Competitive  Landscape, Regional Analysis, DROC & SWOT Analysis, Forecast Outlook
Key Segments • By Component (Solution, Service)
• By Application (Sales and Customer Management, Security & Emergency Management, Remote Monitoring, Predictive Maintenance Asset Management, Inventory Management, Energy Management, Building Automation, Others)
• By Organization Size (Large Enterprise, Small and Medium Size Enterprise)
• By Deployment Mode (On-premises, Cloud)
Regional Analysis/Coverage North America (US, Canada, Mexico), Europe (Eastern Europe [Poland, Romania, Hungary, Turkey, Rest of Eastern Europe] Western Europe] Germany, France, UK, Italy, Spain, Netherlands, Switzerland, Austria, Rest of Western Europe]), Asia Pacific (China, India, Japan, South Korea, Vietnam, Singapore, Australia, Rest of Asia Pacific), Middle East & Africa (Middle East [UAE, Egypt, Saudi Arabia, Qatar, Rest of Middle East], Africa [Nigeria, South Africa, Rest of Africa], Latin America (Brazil, Argentina, Colombia, Rest of Latin America)
Company Profiles Microsoft, Oracle, IBM, SAP, PTC, Cisco, Google, SAS Institute, Adobe, Teradata, AWS, HPE, Hitachi, Software AG, GE, Cloudera, Guavus, Splunk, TIBCO Software, Qlik, Salesforce, Infor, Mnubo, Arundo Analytics, Iguazio, Striim.
Key Drivers • Growing Adoption of IoT and Smart Devices Across Industries Fuels the Connected Device Analytics Market Growth
• Rising Need for Predictive Maintenance and Remote Monitoring Accelerates the Connected Device Analytics Market Expansion
Restraints • High Implementation Costs and Data Privacy Concerns Restrain the Connected Device Analytics Market Growth


Frequently Asked Questions

Ans: North America dominated the Connected Device Analytics Market in 2023.

Ans: The Connected Device Analytics Market is expected to grow at a CAGR of 23.0% during 2024-2032.

Ans: The Connected Device Analytics Market size was USD 26.94 billion in 2023 and is expected to Reach USD 173.96 billion by 2032.

Ans: The major growth factor of the Connected Device Analytics Market is the increasing adoption of IoT devices across various industries for real-time data analysis and operational optimization.

Ans: On-premises segment dominated the Connected Device Analytics Market.

Table Of Content

1. Introduction

1.1 Market Definition

1.2 Scope (Inclusion and Exclusions)

1.3 Research Assumptions

2. Executive Summary

2.1 Market Overview

2.2 Regional Synopsis

2.3 Competitive Summary

3. Research Methodology

3.1 Top-Down Approach

3.2 Bottom-up Approach

3.3. Data Validation

3.4 Primary Interviews

4. Market Dynamics Impact Analysis

4.1 Market Driving Factors Analysis

4.1.1 Drivers

4.1.2 Restraints

4.1.3 Opportunities

4.1.4 Challenges

4.2 PESTLE Analysis

4.3 Porter’s Five Forces Model

5. Statistical Insights and Trends Reporting

5.1 Technology Integration, 2023

5.2 Security Breach Statistics, 2023

5.3 Regulatory Impact, 2023

5.4 Use Case Distribution

6. Competitive Landscape

6.1 List of Major Companies, By Region

6.2 Market Share Analysis, By Region

6.3 Product Benchmarking

6.3.1 Product specifications and features

6.3.2 Pricing

6.4 Strategic Initiatives

6.4.1 Marketing and promotional activities

6.4.2 Distribution and Supply Chain Strategies

6.4.3 Expansion plans and new product launches

6.4.4 Strategic partnerships and collaborations

6.5 Technological Advancements

6.6 Market Positioning and Branding

7. Connected Device Analytics Market Segmentation, By Component

7.1 Chapter Overview

7.2 Solution

7.2.1 Solution Market Trends Analysis (2020-2032)

7.2.2 Solution Market Size Estimates and Forecasts to 2032 (USD Billion)

7.3 Services

7.3.1 Services Market Trends Analysis (2020-2032)

7.3.2 Services Market Size Estimates and Forecasts to 2032 (USD Billion)

8. Connected Device Analytics Market Segmentation, By Deployment Mode

8.1 Chapter Overview

8.2 On-premises

8.2.1 On-premises Market Trends Analysis (2020-2032)

8.2.2 On-premises Market Size Estimates and Forecasts to 2032 (USD Billion)

8.3 Cloud

8.3.1 Cloud Market Trends Analysis (2020-2032)

8.3.2 Cloud Market Size Estimates and Forecasts to 2032 (USD Billion)

9. Connected Device Analytics Market Segmentation, By Application

9.1 Chapter Overview

9.2 Sales and Customer Management

9.2.1 Sales and Customer Management Market Trends Analysis (2020-2032)

9.2.2 Sales and Customer Management Market Size Estimates and Forecasts to 2032 (USD Billion)

9.3 Security & Emergency Management

9.3.1 Security & Emergency Management Market Trends Analysis (2020-2032)

9.3.2 Security & Emergency Management Market Size Estimates and Forecasts to 2032 (USD Billion)

9.4 Remote Monitoring

9.4.1 Remote Monitoring Market Trends Analysis (2020-2032)

9.4.2 Remote Monitoring Market Size Estimates and Forecasts to 2032 (USD Billion)

9.4 Predictive Maintenance Asset Management

9.4.1 Predictive Maintenance Asset Management Market Trends Analysis (2020-2032)

9.4.2 Predictive Maintenance Asset Management Market Size Estimates and Forecasts to 2032 (USD Billion)

9.4 Inventory Management

9.4.1 Inventory Management Market Trends Analysis (2020-2032)

9.4.2 Inventory Management Market Size Estimates and Forecasts to 2032 (USD Billion)

9.4 Energy Management

9.4.1 Energy Management Market Trends Analysis (2020-2032)

9.4.2 Energy Management Market Size Estimates and Forecasts to 2032 (USD Billion)

9.4 Building Automation

9.4.1 Building Automation Market Trends Analysis (2020-2032)

9.4.2 Building Automation Market Size Estimates and Forecasts to 2032 (USD Billion)

9.4 Others

9.4.1 Others Market Trends Analysis (2020-2032)

9.4.2 Others Market Size Estimates and Forecasts to 2032 (USD Billion)

10. Connected Device Analytics Market Segmentation, By Organization Size

10.1 Chapter Overview

10.2 Large Enterprise

10.2.1 Large Enterprise Market Trends Analysis (2020-2032)

10.2.2 Large Enterprise Market Size Estimates and Forecasts to 2032 (USD Billion)

10.3 Small and Medium Size Enterprise

10.3.1 Small and Medium Size Enterprise Market Trends Analysis (2020-2032)

10.3.2 Small and Medium Size Enterprise Market Size Estimates and Forecasts to 2032 (USD Billion)

11. Regional Analysis

11.1 Chapter Overview

11.2 North America

11.2.1 Trends Analysis

11.2.2 North America Connected Device Analytics Market Estimates and Forecasts, by Country (2020-2032) (USD Billion)

11.2.3 North America Connected Device Analytics Market Estimates and Forecasts, By Component (2020-2032) (USD Billion)  

11.2.4 North America Connected Device Analytics Market Estimates and Forecasts, By Deployment Mode (2020-2032) (USD Billion)

11.2.5 North America Connected Device Analytics Market Estimates and Forecasts, By Application (2020-2032) (USD Billion)

11.2.6 North America Connected Device Analytics Market Estimates and Forecasts,  By Organization Size(2020-2032) (USD Billion)

11.2.7 USA

11.2.7.1 USA Connected Device Analytics Market Estimates and Forecasts, By Component (2020-2032) (USD Billion)

11.2.7.2 USA Connected Device Analytics Market Estimates and Forecasts, By Deployment Mode (2020-2032) (USD Billion)

11.2.7.3 USA Connected Device Analytics Market Estimates and Forecasts, By Application (2020-2032) (USD Billion)

11.2.7.4 USA Connected Device Analytics Market Estimates and Forecasts,  By Organization Size(2020-2032) (USD Billion)

11.2.8 Canada

11.2.8.1 Canada Connected Device Analytics Market Estimates and Forecasts, By Component (2020-2032) (USD Billion)

11.2.8.2 Canada Connected Device Analytics Market Estimates and Forecasts, By Deployment Mode (2020-2032) (USD Billion)

11.2.8.3 Canada Connected Device Analytics Market Estimates and Forecasts, By Application (2020-2032) (USD Billion)

11.2.8.4 Canada Connected Device Analytics Market Estimates and Forecasts,  By Organization Size (2020-2032) (USD Billion)

11.2.9 Mexico

11.2.9.1 Mexico Connected Device Analytics Market Estimates and Forecasts, By Component (2020-2032) (USD Billion)

11.2.9.2 Mexico Connected Device Analytics Market Estimates and Forecasts, By Deployment Mode (2020-2032) (USD Billion)

11.2.9.3 Mexico Connected Device Analytics Market Estimates and Forecasts, By Application (2020-2032) (USD Billion)

11.2.9.4 Mexico Connected Device Analytics Market Estimates and Forecasts,  By Organization Size (2020-2032) (USD Billion)

11.3 Europe

11.3.1 Eastern Europe

11.3.1.1 Trends Analysis

11.3.1.2 Eastern Europe Connected Device Analytics Market Estimates and Forecasts, by Country (2020-2032) (USD Billion)

11.3.1.3 Eastern Europe Connected Device Analytics Market Estimates and Forecasts, By Component (2020-2032) (USD Billion)  

11.3.1.4 Eastern Europe Connected Device Analytics Market Estimates and Forecasts, By Deployment Mode (2020-2032) (USD Billion)

11.3.1.5 Eastern Europe Connected Device Analytics Market Estimates and Forecasts, By Application (2020-2032) (USD Billion)

11.3.1.6 Eastern Europe Connected Device Analytics Market Estimates and Forecasts,  By Organization Size(2020-2032) (USD Billion)

11.3.1.7 Poland

11.3.1.7.1 Poland Connected Device Analytics Market Estimates and Forecasts, By Component (2020-2032) (USD Billion)

11.3.1.7.2 Poland Connected Device Analytics Market Estimates and Forecasts, By Deployment Mode (2020-2032) (USD Billion)

11.3.1.7.3 Poland Connected Device Analytics Market Estimates and Forecasts, By Application (2020-2032) (USD Billion)

11.3.1.7.4 Poland Connected Device Analytics Market Estimates and Forecasts,  By Organization Size(2020-2032) (USD Billion)

11.3.1.8 Romania

11.3.1.8.1 Romania Connected Device Analytics Market Estimates and Forecasts, By Component (2020-2032) (USD Billion)

11.3.1.8.2 Romania Connected Device Analytics Market Estimates and Forecasts, By Deployment Mode (2020-2032) (USD Billion)

11.3.1.8.3 Romania Connected Device Analytics Market Estimates and Forecasts, By Application (2020-2032) (USD Billion)

11.3.1.8.4 Romania Connected Device Analytics Market Estimates and Forecasts,  By Organization Size (2020-2032) (USD Billion)

11.3.1.9 Hungary

11.3.1.9.1 Hungary Connected Device Analytics Market Estimates and Forecasts, By Component (2020-2032) (USD Billion)

11.3.1.9.2 Hungary Connected Device Analytics Market Estimates and Forecasts, By Deployment Mode (2020-2032) (USD Billion)

11.3.1.9.3 Hungary Connected Device Analytics Market Estimates and Forecasts, By Application (2020-2032) (USD Billion)

11.3.1.9.4 Hungary Connected Device Analytics Market Estimates and Forecasts,  By Organization Size  (2020-2032) (USD Billion)

11.3.1.10 Turkey

11.3.1.10.1 Turkey Connected Device Analytics Market Estimates and Forecasts, By Component (2020-2032) (USD Billion)

11.3.1.10.2 Turkey Connected Device Analytics Market Estimates and Forecasts, By Deployment Mode (2020-2032) (USD Billion)

11.3.1.10.3 Turkey Connected Device Analytics Market Estimates and Forecasts, By Application (2020-2032) (USD Billion)

11.3.1.10.4 Turkey Connected Device Analytics Market Estimates and Forecasts,  By Organization Size (2020-2032) (USD Billion)

11.3.1.11 Rest of Eastern Europe

11.3.1.11.1 Rest of Eastern Europe Connected Device Analytics Market Estimates and Forecasts, By Component (2020-2032) (USD Billion)

11.3.1.11.2 Rest of Eastern Europe Connected Device Analytics Market Estimates and Forecasts, By Deployment Mode (2020-2032) (USD Billion)

11.3.1.11.3 Rest of Eastern Europe Connected Device Analytics Market Estimates and Forecasts, By Application (2020-2032) (USD Billion)

11.3.1.11.4 Rest of Eastern Europe Connected Device Analytics Market Estimates and Forecasts,  By Organization Size (2020-2032) (USD Billion)

11.3.2 Western Europe

11.3.2.1 Trends Analysis

11.3.2.2 Western Europe Connected Device Analytics Market Estimates and Forecasts, by Country (2020-2032) (USD Billion)

11.3.2.3 Western Europe Connected Device Analytics Market Estimates and Forecasts, By Component (2020-2032) (USD Billion)  

11.3.2.4 Western Europe Connected Device Analytics Market Estimates and Forecasts, By Deployment Mode (2020-2032) (USD Billion)

11.3.2.5 Western Europe Connected Device Analytics Market Estimates and Forecasts, By Application (2020-2032) (USD Billion)

11.3.2.6 Western Europe Connected Device Analytics Market Estimates and Forecasts,  By Organization Size (2020-2032) (USD Billion)

11.3.2.7 Germany

11.3.2.7.1 Germany Connected Device Analytics Market Estimates and Forecasts, By Component (2020-2032) (USD Billion)

11.3.2.7.2 Germany Connected Device Analytics Market Estimates and Forecasts, By Deployment Mode (2020-2032) (USD Billion)

11.3.2.7.3 Germany Connected Device Analytics Market Estimates and Forecasts, By Application (2020-2032) (USD Billion)

11.3.2.7.4 Germany Connected Device Analytics Market Estimates and Forecasts,  By Organization Size (2020-2032) (USD Billion)

11.3.2.8 France

11.3.2.8.1 France Connected Device Analytics Market Estimates and Forecasts, By Component (2020-2032) (USD Billion)

11.3.2.8.2 France Connected Device Analytics Market Estimates and Forecasts, By Deployment Mode (2020-2032) (USD Billion)

11.3.2.8.3 France Connected Device Analytics Market Estimates and Forecasts, By Application (2020-2032) (USD Billion)

11.3.2.8.4 France Connected Device Analytics Market Estimates and Forecasts,  By Organization Size (2020-2032) (USD Billion)

11.3.2.9 UK

11.3.2.9.1 UK Connected Device Analytics Market Estimates and Forecasts, By Component (2020-2032) (USD Billion)

11.3.2.9.2 UK Connected Device Analytics Market Estimates and Forecasts, By Deployment Mode (2020-2032) (USD Billion)

11.3.2.9.3 UK Connected Device Analytics Market Estimates and Forecasts, By Application (2020-2032) (USD Billion)

11.3.2.9.4 UK Connected Device Analytics Market Estimates and Forecasts,  By Organization Size (2020-2032) (USD Billion)

11.3.2.10 Italy

11.3.2.10.1 Italy Connected Device Analytics Market Estimates and Forecasts, By Component (2020-2032) (USD Billion)

11.3.2.10.2 Italy Connected Device Analytics Market Estimates and Forecasts, By Deployment Mode (2020-2032) (USD Billion)

11.3.2.10.3 Italy Connected Device Analytics Market Estimates and Forecasts, By Application (2020-2032) (USD Billion)

11.3.2.10.4 Italy Connected Device Analytics Market Estimates and Forecasts,  By Organization Size (2020-2032) (USD Billion)

11.3.2.11 Spain

11.3.2.11.1 Spain Connected Device Analytics Market Estimates and Forecasts, By Component (2020-2032) (USD Billion)

11.3.2.11.2 Spain Connected Device Analytics Market Estimates and Forecasts, By Deployment Mode (2020-2032) (USD Billion)

11.3.2.11.3 Spain Connected Device Analytics Market Estimates and Forecasts, By Application (2020-2032) (USD Billion)

11.3.2.11.4 Spain Connected Device Analytics Market Estimates and Forecasts,  By Organization Size (2020-2032) (USD Billion)

11.3.2.12 Netherlands

11.3.2.12.1 Netherlands Connected Device Analytics Market Estimates and Forecasts, By Component (2020-2032) (USD Billion)

11.3.2.12.2 Netherlands Connected Device Analytics Market Estimates and Forecasts, By Deployment Mode (2020-2032) (USD Billion)

11.3.2.12.3 Netherlands Connected Device Analytics Market Estimates and Forecasts, By Application (2020-2032) (USD Billion)

11.3.2.12.4 Netherlands Connected Device Analytics Market Estimates and Forecasts,  By Organization Size (2020-2032) (USD Billion)

11.3.2.13 Switzerland

11.3.2.13.1 Switzerland Connected Device Analytics Market Estimates and Forecasts, By Component (2020-2032) (USD Billion)

11.3.2.13.2 Switzerland Connected Device Analytics Market Estimates and Forecasts, By Deployment Mode (2020-2032) (USD Billion)

11.3.2.13.3 Switzerland Connected Device Analytics Market Estimates and Forecasts, By Application (2020-2032) (USD Billion)

11.3.2.13.4 Switzerland Connected Device Analytics Market Estimates and Forecasts,  By Organization Size (2020-2032) (USD Billion)

11.3.2.14 Austria

11.3.2.14.1 Austria Connected Device Analytics Market Estimates and Forecasts, By Component (2020-2032) (USD Billion)

11.3.2.14.2 Austria Connected Device Analytics Market Estimates and Forecasts, By Deployment Mode (2020-2032) (USD Billion)

11.3.2.14.3 Austria Connected Device Analytics Market Estimates and Forecasts, By Application (2020-2032) (USD Billion)

11.3.2.14.4 Austria Connected Device Analytics Market Estimates and Forecasts,  By Organization Size (2020-2032) (USD Billion)

11.3.2.15 Rest of Western Europe

11.3.2.15.1 Rest of Western Europe Connected Device Analytics Market Estimates and Forecasts, By Component (2020-2032) (USD Billion)

11.3.2.15.2 Rest of Western Europe Connected Device Analytics Market Estimates and Forecasts, By Deployment Mode (2020-2032) (USD Billion)

11.3.2.15.3 Rest of Western Europe Connected Device Analytics Market Estimates and Forecasts, By Application (2020-2032) (USD Billion)

11.3.2.15.4 Rest of Western Europe Connected Device Analytics Market Estimates and Forecasts,  By Organization Size (2020-2032) (USD Billion)

11.4 Asia Pacific

11.4.1 Trends Analysis

11.4.2 Asia Pacific Connected Device Analytics Market Estimates and Forecasts, by Country (2020-2032) (USD Billion)

11.4.3 Asia Pacific Connected Device Analytics Market Estimates and Forecasts, By Component (2020-2032) (USD Billion)  

11.4.4 Asia Pacific Connected Device Analytics Market Estimates and Forecasts, By Deployment Mode (2020-2032) (USD Billion)

11.4.5 Asia Pacific Connected Device Analytics Market Estimates and Forecasts, By Application (2020-2032) (USD Billion)

11.4.6 Asia Pacific Connected Device Analytics Market Estimates and Forecasts,  By Organization Size (2020-2032) (USD Billion)

11.4.7 China

11.4.7.1 China Connected Device Analytics Market Estimates and Forecasts, By Component (2020-2032) (USD Billion)

11.4.7.2 China Connected Device Analytics Market Estimates and Forecasts, By Deployment Mode (2020-2032) (USD Billion)

11.4.7.3 China Connected Device Analytics Market Estimates and Forecasts, By Application (2020-2032) (USD Billion)

11.4.7.4 China Connected Device Analytics Market Estimates and Forecasts,  By Organization Size (2020-2032) (USD Billion)

11.4.8 India

11.4.8.1 India Connected Device Analytics Market Estimates and Forecasts, By Component (2020-2032) (USD Billion)

11.4.8.2 India Connected Device Analytics Market Estimates and Forecasts, By Deployment Mode (2020-2032) (USD Billion)

11.4.8.3 India Connected Device Analytics Market Estimates and Forecasts, By Application (2020-2032) (USD Billion)

11.4.8.4 India Connected Device Analytics Market Estimates and Forecasts,  By Organization Size (2020-2032) (USD Billion)

11.4.9 Japan

11.4.9.1 Japan Connected Device Analytics Market Estimates and Forecasts, By Component (2020-2032) (USD Billion)

11.4.9.2 Japan Connected Device Analytics Market Estimates and Forecasts, By Deployment Mode (2020-2032) (USD Billion)

11.4.9.3 Japan Connected Device Analytics Market Estimates and Forecasts, By Application (2020-2032) (USD Billion)

11.4.9.4 Japan Connected Device Analytics Market Estimates and Forecasts,  By Organization Size (2020-2032) (USD Billion)

11.4.10 South Korea

11.4.10.1 South Korea Connected Device Analytics Market Estimates and Forecasts, By Component (2020-2032) (USD Billion)

11.4.10.2 South Korea Connected Device Analytics Market Estimates and Forecasts, By Deployment Mode (2020-2032) (USD Billion)

11.4.10.3 South Korea Connected Device Analytics Market Estimates and Forecasts, By Application (2020-2032) (USD Billion)

11.4.10.4 South Korea Connected Device Analytics Market Estimates and Forecasts,  By Organization Size (2020-2032) (USD Billion)

11.4.11 Vietnam

11.4.11.1 Vietnam Connected Device Analytics Market Estimates and Forecasts, By Component (2020-2032) (USD Billion)

11.4.11.2 Vietnam Connected Device Analytics Market Estimates and Forecasts, By Deployment Mode (2020-2032) (USD Billion)

11.4.11.3 Vietnam Connected Device Analytics Market Estimates and Forecasts, By Application (2020-2032) (USD Billion)

11.4.11.4 Vietnam Connected Device Analytics Market Estimates and Forecasts,  By Organization Size (2020-2032) (USD Billion)

11.4.12 Singapore

11.4.12.1 Singapore Connected Device Analytics Market Estimates and Forecasts, By Component (2020-2032) (USD Billion)

11.4.12.2 Singapore Connected Device Analytics Market Estimates and Forecasts, By Deployment Mode (2020-2032) (USD Billion)

11.4.12.3 Singapore Connected Device Analytics Market Estimates and Forecasts, By Application (2020-2032) (USD Billion)

11.4.12.4 Singapore Connected Device Analytics Market Estimates and Forecasts,  By Organization Size (2020-2032) (USD Billion)

11.4.13 Australia

11.4.13.1 Australia Connected Device Analytics Market Estimates and Forecasts, By Component (2020-2032) (USD Billion)

11.4.13.2 Australia Connected Device Analytics Market Estimates and Forecasts, By Deployment Mode (2020-2032) (USD Billion)

11.4.13.3 Australia Connected Device Analytics Market Estimates and Forecasts, By Application (2020-2032) (USD Billion)

11.4.13.4 Australia Connected Device Analytics Market Estimates and Forecasts,  By Organization Size (2020-2032) (USD Billion)

11.4.14 Rest of Asia Pacific

11.4.14.1 Rest of Asia Pacific Connected Device Analytics Market Estimates and Forecasts, By Component (2020-2032) (USD Billion)

11.4.14.2 Rest of Asia Pacific Connected Device Analytics Market Estimates and Forecasts, By Deployment Mode (2020-2032) (USD Billion)

11.4.14.3 Rest of Asia Pacific Connected Device Analytics Market Estimates and Forecasts, By Application (2020-2032) (USD Billion)

11.4.14.4 Rest of Asia Pacific Connected Device Analytics Market Estimates and Forecasts,  By Organization Size (2020-2032) (USD Billion)

11.5 Middle East and Africa

11.5.1 Middle East

11.5.1.1 Trends Analysis

11.5.1.2 Middle East Connected Device Analytics Market Estimates and Forecasts, by Country (2020-2032) (USD Billion)

11.5.1.3 Middle East Connected Device Analytics Market Estimates and Forecasts, By Component (2020-2032) (USD Billion)  

11.5.1.4 Middle East Connected Device Analytics Market Estimates and Forecasts, By Deployment Mode (2020-2032) (USD Billion)

11.5.1.5 Middle East Connected Device Analytics Market Estimates and Forecasts, By Application (2020-2032) (USD Billion)

11.5.1.6 Middle East Connected Device Analytics Market Estimates and Forecasts,  By Organization Size (2020-2032) (USD Billion)

11.5.1.7 UAE

11.5.1.7.1 UAE Connected Device Analytics Market Estimates and Forecasts, By Component (2020-2032) (USD Billion)

11.5.1.7.2 UAE Connected Device Analytics Market Estimates and Forecasts, By Deployment Mode (2020-2032) (USD Billion)

11.5.1.7.3 UAE Connected Device Analytics Market Estimates and Forecasts, By Application (2020-2032) (USD Billion)

11.5.1.7.4 UAE Connected Device Analytics Market Estimates and Forecasts,  By Organization Size (2020-2032) (USD Billion)

11.5.1.8 Egypt

11.5.1.8.1 Egypt Connected Device Analytics Market Estimates and Forecasts, By Component (2020-2032) (USD Billion)

11.5.1.8.2 Egypt Connected Device Analytics Market Estimates and Forecasts, By Deployment Mode (2020-2032) (USD Billion)

11.5.1.8.3 Egypt Connected Device Analytics Market Estimates and Forecasts, By Application (2020-2032) (USD Billion)

11.5.1.8.4 Egypt Connected Device Analytics Market Estimates and Forecasts,  By Organization Size (2020-2032) (USD Billion)

11.5.1.9 Saudi Arabia

11.5.1.9.1 Saudi Arabia Connected Device Analytics Market Estimates and Forecasts, By Component (2020-2032) (USD Billion)

11.5.1.9.2 Saudi Arabia Connected Device Analytics Market Estimates and Forecasts, By Deployment Mode (2020-2032) (USD Billion)

11.5.1.9.3 Saudi Arabia Connected Device Analytics Market Estimates and Forecasts, By Application (2020-2032) (USD Billion)

11.5.1.9.4 Saudi Arabia Connected Device Analytics Market Estimates and Forecasts,  By Organization Size (2020-2032) (USD Billion)

11.5.1.10 Qatar

11.5.1.10.1 Qatar Connected Device Analytics Market Estimates and Forecasts, By Component (2020-2032) (USD Billion)

11.5.1.10.2 Qatar Connected Device Analytics Market Estimates and Forecasts, By Deployment Mode (2020-2032) (USD Billion)

11.5.1.10.3 Qatar Connected Device Analytics Market Estimates and Forecasts, By Application (2020-2032) (USD Billion)

11.5.1.10.4 Qatar Connected Device Analytics Market Estimates and Forecasts,  By Organization Size (2020-2032) (USD Billion)

11.5.1.11 Rest of Middle East

11.5.1.11.1 Rest of Middle East Connected Device Analytics Market Estimates and Forecasts, By Component (2020-2032) (USD Billion)

11.5.1.11.2 Rest of Middle East Connected Device Analytics Market Estimates and Forecasts, By Deployment Mode (2020-2032) (USD Billion)

11.5.1.11.3 Rest of Middle East Connected Device Analytics Market Estimates and Forecasts, By Application (2020-2032) (USD Billion)

11.5.1.11.4 Rest of Middle East Connected Device Analytics Market Estimates and Forecasts,  By Organization Size (2020-2032) (USD Billion)

11.5.2 Africa

11.5.2.1 Trends Analysis

11.5.2.2 Africa Connected Device Analytics Market Estimates and Forecasts, by Country (2020-2032) (USD Billion)

11.5.2.3 Africa Connected Device Analytics Market Estimates and Forecasts, By Component (2020-2032) (USD Billion)  

11.5.2.4 Africa Connected Device Analytics Market Estimates and Forecasts, By Deployment Mode (2020-2032) (USD Billion)

11.5.2.5 Africa Connected Device Analytics Market Estimates and Forecasts, By Application (2020-2032) (USD Billion)

11.5.2.6 Africa Connected Device Analytics Market Estimates and Forecasts,  By Organization Size (2020-2032) (USD Billion)

11.5.2.7 South Africa

11.5.2.7.1 South Africa Connected Device Analytics Market Estimates and Forecasts, By Component (2020-2032) (USD Billion)

11.5.2.7.2 South Africa Connected Device Analytics Market Estimates and Forecasts, By Deployment Mode (2020-2032) (USD Billion)

11.5.2.7.3 South Africa Connected Device Analytics Market Estimates and Forecasts, By Application (2020-2032) (USD Billion)

11.5.2.7.4 South Africa Connected Device Analytics Market Estimates and Forecasts,  By Organization Size (2020-2032) (USD Billion)

11.5.2.8 Nigeria

11.5.2.8.1 Nigeria Connected Device Analytics Market Estimates and Forecasts, By Component (2020-2032) (USD Billion)

11.5.2.8.2 Nigeria Connected Device Analytics Market Estimates and Forecasts, By Deployment Mode (2020-2032) (USD Billion)

11.5.2.8.3 Nigeria Connected Device Analytics Market Estimates and Forecasts, By Application (2020-2032) (USD Billion)

11.5.2.8.4 Nigeria Connected Device Analytics Market Estimates and Forecasts,  By Organization Size (2020-2032) (USD Billion)

11.5.2.9 Rest of Africa

11.5.2.9.1 Rest of Africa Connected Device Analytics Market Estimates and Forecasts, By Component (2020-2032) (USD Billion)

11.5.2.9.2 Rest of Africa Connected Device Analytics Market Estimates and Forecasts, By Deployment Mode (2020-2032) (USD Billion)

11.5.2.9.3 Rest of Africa Connected Device Analytics Market Estimates and Forecasts, By Application (2020-2032) (USD Billion)

11.5.2.9.4 Rest of Africa Connected Device Analytics Market Estimates and Forecasts,  By Organization Size (2020-2032) (USD Billion)

11.6 Latin America

11.6.1 Trends Analysis

11.6.2 Latin America Connected Device Analytics Market Estimates and Forecasts, by Country (2020-2032) (USD Billion)

11.6.3 Latin America Connected Device Analytics Market Estimates and Forecasts, By Component (2020-2032) (USD Billion)  

11.6.4 Latin America Connected Device Analytics Market Estimates and Forecasts, By Deployment Mode (2020-2032) (USD Billion)

11.6.5 Latin America Connected Device Analytics Market Estimates and Forecasts, By Application (2020-2032) (USD Billion)

11.6.6 Latin America Connected Device Analytics Market Estimates and Forecasts,  By Organization Size (2020-2032) (USD Billion)

11.6.7 Brazil

11.6.7.1 Brazil Connected Device Analytics Market Estimates and Forecasts, By Component (2020-2032) (USD Billion)

11.6.7.2 Brazil Connected Device Analytics Market Estimates and Forecasts, By Deployment Mode (2020-2032) (USD Billion)

11.6.7.3 Brazil Connected Device Analytics Market Estimates and Forecasts, By Application (2020-2032) (USD Billion)

11.6.7.4 Brazil Connected Device Analytics Market Estimates and Forecasts,  By Organization Size (2020-2032) (USD Billion)

11.6.8 Argentina

11.6.8.1 Argentina Connected Device Analytics Market Estimates and Forecasts, By Component (2020-2032) (USD Billion)

11.6.8.2 Argentina Connected Device Analytics Market Estimates and Forecasts, By Deployment Mode (2020-2032) (USD Billion)

11.6.8.3 Argentina Connected Device Analytics Market Estimates and Forecasts, By Application (2020-2032) (USD Billion)

11.6.8.4 Argentina Connected Device Analytics Market Estimates and Forecasts,  By Organization Size (2020-2032) (USD Billion)

11.6.9 Colombia

11.6.9.1 Colombia Connected Device Analytics Market Estimates and Forecasts, By Component (2020-2032) (USD Billion)

11.6.9.2 Colombia Connected Device Analytics Market Estimates and Forecasts, By Deployment Mode (2020-2032) (USD Billion)

11.6.9.3 Colombia Connected Device Analytics Market Estimates and Forecasts, By Application (2020-2032) (USD Billion)

11.6.9.4 Colombia Connected Device Analytics Market Estimates and Forecasts,  By Organization Size (2020-2032) (USD Billion)

11.6.10 Rest of Latin America

11.6.10.1 Rest of Latin America Connected Device Analytics Market Estimates and Forecasts, By Component (2020-2032) (USD Billion)

11.6.10.2 Rest of Latin America Connected Device Analytics Market Estimates and Forecasts, By Deployment Mode (2020-2032) (USD Billion)

11.6.10.3 Rest of Latin America Connected Device Analytics Market Estimates and Forecasts, By Application (2020-2032) (USD Billion)

11.6.10.4 Rest of Latin America Connected Device Analytics Market Estimates and Forecasts,  By Organization Size (2020-2032) (USD Billion)

12. Company Profiles

12.1 Microsoft

12.1.1 Company Overview

12.1.2 Financial

12.1.3 Products/ Services Offered

12.1.4 SWOT Analysis

12.2 Oracle

12.2.1 Company Overview

12.2.2 Financial

12.2.3 Products/ Services Offered

12.2.4 SWOT Analysis

12.3 IBM

12.3.1 Company Overview

12.3.2 Financial

12.3.3 Products/ Services Offered

12.3.4 SWOT Analysis

12.4 SAP

12.4.1 Company Overview

12.4.2 Financial

12.4.3 Products/ Services Offered

12.4.4 SWOT Analysis

12.5 PTC

12.5.1 Company Overview

12.5.2 Financial

12.5.3 Products/ Services Offered

12.5.4 SWOT Analysis

12.6 Cisco

12.6.1 Company Overview

12.6.2 Financial

12.6.3 Products/ Services Offered

12.6.4 SWOT Analysis

12.7 Google

12.7.1 Company Overview

12.7.2 Financial

12.7.3 Products/ Services Offered

12.7.4 SWOT Analysis

12.8 SAS Institute

12.8.1 Company Overview

12.8.2 Financial

12.8.3 Products/ Services Offered

12.8.4 SWOT Analysis

12.9 Adobe

12.9.1 Company Overview

12.9.2 Financial

12.9.3 Products/ Services Offered

12.9.4 SWOT Analysis

12.10 Teradata

12.10.1 Company Overview

12.10.2 Financial

12.10.3 Products/ Services Offered

12.10.4 SWOT Analysis

13. Use Cases and Best Practices

14. Conclusion

An accurate research report requires proper strategizing as well as implementation. There are multiple factors involved in the completion of good and accurate research report and selecting the best methodology to compete the research is the toughest part. Since the research reports we provide play a crucial role in any company’s decision-making process, therefore we at SNS Insider always believe that we should choose the best method which gives us results closer to reality. This allows us to reach at a stage wherein we can provide our clients best and accurate investment to output ratio.

Each report that we prepare takes a timeframe of 350-400 business hours for production. Starting from the selection of titles through a couple of in-depth brain storming session to the final QC process before uploading our titles on our website we dedicate around 350 working hours. The titles are selected based on their current market cap and the foreseen CAGR and growth.


The 5 steps process:

Step 1: Secondary Research:

Secondary Research or Desk Research is as the name suggests is a research process wherein, we collect data through the readily available information. In this process we use various paid and unpaid databases which our team has access to and gather data through the same. This includes examining of listed companies’ annual reports, Journals, SEC filling etc. Apart from this our team has access to various associations across the globe across different industries. Lastly, we have exchange relationships with various university as well as individual libraries.

Secondary Research

Step 2: Primary Research

When we talk about primary research, it is a type of study in which the researchers collect relevant data samples directly, rather than relying on previously collected data.  This type of research is focused on gaining content specific facts that can be sued to solve specific problems. Since the collected data is fresh and first hand therefore it makes the study more accurate and genuine.

We at SNS Insider have divided Primary Research into 2 parts.

Part 1 wherein we interview the KOLs of major players as well as the upcoming ones across various geographic regions. This allows us to have their view over the market scenario and acts as an important tool to come closer to the accurate market numbers. As many as 45 paid and unpaid primary interviews are taken from both the demand and supply side of the industry to make sure we land at an accurate judgement and analysis of the market.

This step involves the triangulation of data wherein our team analyses the interview transcripts, online survey responses and observation of on filed participants. The below mentioned chart should give a better understanding of the part 1 of the primary interview.

Primary Research

Part 2: In this part of primary research the data collected via secondary research and the part 1 of the primary research is validated with the interviews from individual consultants and subject matter experts.

Consultants are those set of people who have at least 12 years of experience and expertise within the industry whereas Subject Matter Experts are those with at least 15 years of experience behind their back within the same space. The data with the help of two main processes i.e., FGDs (Focused Group Discussions) and IDs (Individual Discussions). This gives us a 3rd party nonbiased primary view of the market scenario making it a more dependable one while collation of the data pointers.

Step 3: Data Bank Validation

Once all the information is collected via primary and secondary sources, we run that information for data validation. At our intelligence centre our research heads track a lot of information related to the market which includes the quarterly reports, the daily stock prices, and other relevant information. Our data bank server gets updated every fortnight and that is how the information which we collected using our primary and secondary information is revalidated in real time.

Data Bank Validation

Step 4: QA/QC Process

After all the data collection and validation our team does a final level of quality check and quality assurance to get rid of any unwanted or undesired mistakes. This might include but not limited to getting rid of the any typos, duplication of numbers or missing of any important information. The people involved in this process include technical content writers, research heads and graphics people. Once this process is completed the title gets uploader on our platform for our clients to read it.

Step 5: Final QC/QA Process:

This is the last process and comes when the client has ordered the study. In this process a final QA/QC is done before the study is emailed to the client. Since we believe in giving our clients a good experience of our research studies, therefore, to make sure that we do not lack at our end in any way humanly possible we do a final round of quality check and then dispatch the study to the client.

MARKET SEGMENTATION

By Component  

  • Solution

  • Service

 By Application  

  • Sales and Customer Management

  • Security & Emergency Management

  • Remote Monitoring

  • Predictive Maintenance Asset Management

  • Inventory Management

  • Energy Management

  • Building Automation

  • Others

 By Organization Size

  • Large Enterprise

  • Small and Medium Size Enterprise

By Deployment Mode

  • On-premises

  • Cloud

Request for Segment Customization as per your Business Requirement: Segment Customization Request

REGIONAL COVERAGE:

North America

  • US

  • Canada

  • Mexico

Europe

  • Eastern Europe

    • Poland

    • Romania

    • Hungary

    • Turkey

    • Rest of Eastern Europe

  • Western Europe

    • Germany

    • France

    • UK

    • Italy

    • Spain

    • Netherlands

    • Switzerland

    • Austria

    • Rest of Western Europe

Asia Pacific

  • China

  • India

  • Japan

  • South Korea

  • Vietnam

  • Singapore

  • Australia

  • Rest of Asia Pacific

Middle East & Africa

  • Middle East

    • UAE

    • Egypt

    • Saudi Arabia

    • Qatar

    • Rest of the Middle East

  • Africa

    • Nigeria

    • South Africa

    • Rest of Africa

Latin America

  • Brazil

  • Argentina

  • Colombia

  • Rest Of Latin America

Request for Country Level Research Report: Country Level Customization Request

Available Customization

With the given market data, SNS Insider offers customization as per the company’s specific needs. The following customization options are available for the report:

  • Product Analysis

  • Criss-Cross segment analysis (e.g. Product X Application)

  • Product Matrix which gives a detailed comparison of product portfolio of each company

  • Geographic Analysis

  • Additional countries in any of the regions

  • Company Information

  • Detailed analysis and profiling of additional market players (Up to five)


  •            5000 (33% Discount)


  •            8950 (40% Discount)


  •            3050 (23% Discount)

Start a Conversation

Hi! Click one of our member below to chat on Phone