Computer Graphics Market share was valued at USD 30.48 billion in 2024 and is expected to reach USD 63.14 billion by 2032, growing at a CAGR of 9.57% over the forecast period 2025-2032.
The key driving factors for the computer graphics market are the increase in media content and the need for this content for simulation in key industries such as aerospace and automotive, and cost-effective and complex solutions for advanced graphic technologies.
The computer graphics market growth is fueled by the rising demand for high-quality visual content in industries such as entertainment, automotive, healthcare, and gaming. Technological developments in VR, AR, AI, and 3D modeling are a driving force that impacting the market. This, in turn, is proliferating the computer graphics solutions market due to increased demand for immersive experience, digital simulation, and digital media content. When technology becomes affordable, the market is opened up across continents, grows, and the most attractive markets are the emerging ones.
Meta announced a cheaper VR headset and revealed a prototype for AR glasses with holograms. All of these advancements are designed to render immersive experiences more available to the masses, further accelerating the adoption of VR and AR solutions.
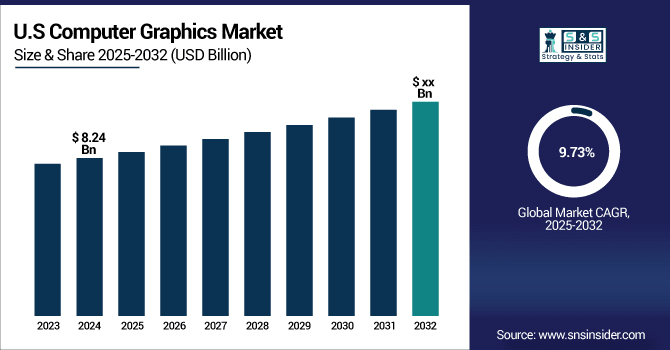
The U.S. Computer Graphics Market share is estimated to be USD 8.24 billion in 2024 and is projected to grow at a CAGR of 9.73%. The demand for cutting-edge visual media in games, entertainment, automotive, and medical sectors is leading to a growth in the U.S. computer graphics market share. The rapid growth of innovations in technologies such as AI, VR, AR, 3D modeling, and strong investments by large technology companies are the main drivers for market expansion.
Key Drivers:
Surging Demand for High-Quality Visuals Propels Computer Graphics Across Entertainment, Automotive, and Healthcare Industries
The increase in the computer graphics market is rooted in the improvement seen in industries such as entertainment, automotive, aerospace, and healthcare. This is partly due to the increasing requirement for high-quality visual content driven by gaming, VR, and AR. In addition to this, the increasing use of digital video production, simulation technologies, and computer-aided design (CAD) tools in industries like automotive design and aerospace engineering is further boosting the market growth.
A study published in Engineering.com reveals Tesla uses real-time rendering engines like Unreal Engine to provide instant visual feedback during design iterations, thus speeding up the overall development cycle.
Restrain:
High-end End Graphics Face Challenges in Integration Rendering Power, and Skilled Workforce Across Industries
The more advanced graphics get, the more rendering is going to consume processing power, and a portion of companies and/or sectors may lack these capabilities to widely accept new technologies. Additionally, new tools often have to be integrated into old systems, which makes transitioning difficult and slow in most sectors. Specialization in fields such as animation, simulation, and VR is very high, and few people are qualified, raising barriers for companies to strengthen their capacity in this field.
The integration of new computer graphics applications into existing systems is a complex problem, particularly regarding compatibility and data exchange, and the use of special knowledge and techniques used in up-to-date programs, as stated in Programming and Computer Software.
Opportunity:
Advances in 3D Modeling and Simulation Drive Growth in Healthcare Education and Emerging Business Segments
Rapid acceleration in 3D modeling and visual immersiveness presents large spaces in industries such as architecture, healthcare, and education. The emerging field of virtual training and simulation for healthcare professionals is opening doors for authentic simulation and practicing medical procedures safely. Moreover, the reduction in the cost of technology for graphics is opening a whole new segment for growth in SMBs, which is one of the great drivers for the computer graphics market.
Challenges:
Intermittent Solar Power Generation Highlights the Need for Efficient and Reliable Energy Storage Solutions
A lack of compatibility across platforms and devices can break the ability to properly use computer graphics technologies. The technical challenge here remains making sure that these graphics tools are optimized for the myriad of devices out there, hardware and software are arguably more dynamic than ever before. It also leads to a risk of data security issues in fields such as healthcare and automotive design, where graphics-heavy applications are used, as 3D models and digital assets are vulnerable to unauthorized access or modification.
By Software
CAD/CAM has a leading 29.4% share of the computer graphics market in 2024. This is because CAD/CAM is extensively employed in industry fields like automotive, aerospace, and manufacturing for product designing, prototyping well as production lines. CAD/CAM has become an essential part of these sectors due to its ability to precisely model 3D and simulate real-world conditions.
The animation segment is likely to witness growth of the fastest growth between 2025 and 2032. This can be attributed to the increasing need for animated content in games, films, advertising, and virtual reality (VR) applications. As animation leaders refine their capabilities, the tools will become more sophisticated, yielding richer interactive experiences. With consistent investments in premium visual content across industries, particularly in entertainment and media, animation technologies will continue to advance and be widely adopted.
By Services
Consulting had the biggest market share of 38.8% in the computer graphics market in 2024. The increasing need for adequate guidance and tactics in realizing intricate computer graphics technologies among sectors like automotive, healthcare, and entertainment drives this prominence. Consulting services play an important role in helping businesses incorporate new graphic technologies, streamline workflows, and improve productivity, and are therefore another crucial segment within the market.
From 2025 to 2032, integration services are anticipated to expand at the highest CAGR. With more organizations using advanced solutions in computer graphics, integrating such technologies into the existing infrastructure is a greater challenge. New graphics tools need to work together seamlessly over different platforms, devices, and systems, which is why companies require expert integration services.
By Verticals
The market share of Entertainment & Advertising was 19.7% in 2024, and it is predicted to have the highest growth from 2025 to 2032. This is due to the increasing demand for quality visual content in gaming, movies, virtual reality (VR), and digital advertising. With both of these industries constantly changing, the demand for computer graphics tech to create realistic and captivating experiences has also skyrocketed. Advertising is indulging in modern animation and digital design tools to utilize enticing and interactive elements. Furthermore, innovative technologies such as AR, VR, and 3D modeling have been quickly adopted across the entertainment sector, consequently increasing the demand for advanced graphics solutions, which in turn drives the market growth in the coming years.
By End-User
Large Enterprises captured the highest market share in 2024 with a share of 60.6%, thanks to their higher investments in advanced computer graphics technologies for product design, simulations, marketing, and engagement with customers. With the resources to invest in innovative graphics technology, these enterprises can remain competitive and streamline processes. In commercial product development, large enterprises in durable goods sectors, such as automotive, aerospace, and entertainment, have drawn advantage from computer graphics, through product modeling and customer experience.
From 2025 to 2032, the Small & Medium Businesses (SMBs) segment is expected to have the fastest CAGR. The falling price point of next-gen graphics tech, as well as the growing accessibility of cloud-based solutions, is driving increased adoption of CGI tools among SMBs for design, marketing virtual collaboration. With an increasing array of economical and scalable graphics solutions, SMBs can capitalize on ground-breaking innovations to rival larger enterprises. This segment of the market will continue to take off over the next few years.
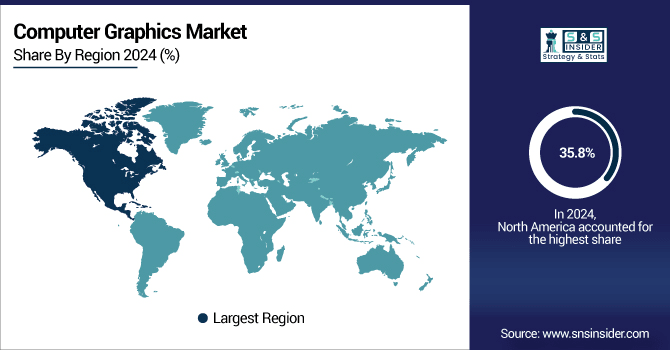
North America held the largest share of the computer graphics market in 2024, at 35.8%, owing to its robust technological infrastructure and reliance on computer graphics solutions within major industry sectors, such as automotive, entertainment, and healthcare. This dominance can be attributed to a good number of tech companies and startups, along with a strong determination towards research and development.
The US holds a leading position in North America, with major market players including NVIDIA, Intel, and Autodesk adding exceptional value for market growth. In this region, a significant share of demand is driven by Hollywood's use of computer graphics in movies and video games.
During the forecast period 2025 to 2032, Asia Pacific is predicted to have the highest CAGR, driven by the rapid adoption of digital technologies in China, India, and Japan. As the gaming market in China is one of the largest in the world, with the industry using state-of-the-art computer graphics in developing games, it is driving the demand for graphics technologies. Another Asian heavyweight is Japan, the home of global animation and gaming leaders. Also, Computer graphics is utilized for product design and simulation in automotive companies in South Korea and China.
The Asia Pacific region is led by China, with significant technology sector investments and increasing digital content demand in media & entertainment, which will boost the regional market expansion.
The computer graphics market in Europe is driven by automotive, aerospace, healthcare, and entertainment, and accounts for a substantial share. It is a hotbed of innovation, with particular focus on the design and simulation technology space, so a major regional player. European companies are investing in advanced computer graphics to develop products, marketing, and digital media.
Germany is the largest country for the adoption of this technology in Europe, partly due to its motor industry, where huge names like BMW, Audi, and Volkswagen widely use computer graphics in vehicle design, prototyping, and simulation.
Latin America and the Middle East & Africa (MEA) are emerging regions in the computer graphics market, attributable to the strong expansion of industries such as entertainment, automotive, and construction. The growing adoption of digital content creation tools in media and advertising is also contributing to the growth of the market in Latin America. On the other hand, there is increasing demand for advanced graphics technologies, such as the incorporation of AR and 3D visualization, across several industries in the MEA region, such as healthcare, construction, and tourism.
Some of the major players in the Computer Graphics Market are NVIDIA, AMD, Intel, Autodesk, Adobe, Apple, Microsoft, Unity Technologies, Epic Games, and Siemens.
In April 2025, NVIDIA launched the GeForce RTX™ 5060 GPUs, featuring neural rendering and Blackwell architecture innovations.
In January 2025, AMD introduced new graphics and gaming products aimed at delivering the ultimate gameplay experience. The latest offerings promise enhanced performance and immersive gameplay for users.
In March 2024, Microsoft and NVIDIA announced key integrations to accelerate generative AI for enterprises, including advanced AI tools and enhanced performance through Azure and NVIDIA's hardware.
Report Attributes | Details |
---|---|
Market Size in 2024 | USD 30.48 Billion |
Market Size by 2032 | USD 63.14 Billion |
CAGR | CAGR of 9.57% From 2025 to 2032 |
Base Year | 2024 |
Forecast Period | 2025-2032 |
Historical Data | 2021-2023 |
Report Scope & Coverage | Market Size, Segments Analysis, Competitive Landscape, Regional Analysis, DROC & SWOT Analysis, Forecast Outlook |
Key Segments | • By Software (CAD/CAM, Digital Video, Simulation, Imaging, Animation) • By Services (Consulting, Integration, Training and Support) • By Verticals (Aerospace and defense, Automobile, Entertainment and Advertising, Academia and Education, Healthcare, Manufacturing, Architecture, Building and Construction, Others) • By End-User (Small & Medium Businesses, Large Enterprises) |
Regional Analysis/Coverage | North America (US, Canada, Mexico), Europe (Germany, France, UK, Italy, Spain, Poland, Turkey, Rest of Europe), Asia Pacific (China, India, Japan, South Korea, Singapore, Australia, Rest of Asia Pacific), Middle East & Africa (UAE, Saudi Arabia, Qatar, South Africa, Rest of Middle East & Africa), Latin America (Brazil, Argentina, Rest of Latin America) |
Company Profiles | NVIDIA, AMD, Intel, Autodesk, Adobe, Apple, Microsoft, Unity Technologies, Epic Games, and Siemens |
Ans: The Computer Graphics Market is expected to grow at a CAGR of 9.57% from 2025-2032.
Ans: The Computer Graphics Market size was USD 30.48 billion in 2024 and is expected to reach USD 63.14 billion by 2032.
Ans: The major growth factor of the computer graphics market is the increasing demand for high-quality visual content across industries such as entertainment, automotive, and healthcare.
Ans: The CAD/CAM segment dominated the Computer Graphics Market in 2024.
Ans: North America dominated the Computer Graphics Market in 2024.
Table of Contents
1. Introduction
1.1 Market Definition
1.2 Scope (Inclusion and Exclusions)
1.3 Research Assumptions
2. Executive Summary
2.1 Market Overview
2.2 Regional Synopsis
2.3 Competitive Summary
3. Research Methodology
3.1 Top-Down Approach
3.2 Bottom-up Approach
3.3. Data Validation
3.4 Primary Interviews
4. Market Dynamics Impact Analysis
4.1 Market Driving Factors Analysis
4.1.1 Drivers
4.1.2 Restraints
4.1.3 Opportunities
4.1.4 Challenges
4.2 PESTLE Analysis
4.3 Porter’s Five Forces Model
5. Statistical Insights and Trends Reporting
5.1 Emerging Technologies in Graphics
5.2 Cloud Gaming Adoption Rates
5.3 GPU Power Consumption Trends
5.4 Demand for AI-Optimized GPUs10 in
6. Competitive Landscape
6.1 List of Major Companies, By Region
6.2 Market Share Analysis, By Region
6.3 Product Benchmarking
6.3.1 Product specifications and features
6.3.2 Pricing
6.4 Strategic Initiatives
6.4.1 Marketing and Promotional Activities
6.4.2 Distribution and Supply Chain Strategies
6.4.3 Expansion plans and new product launches
6.4.4 Strategic partnerships and collaborations
6.5 Technological Advancements
6.6 Market Positioning and Branding
7. Computer Graphics Market Segmentation By Software
7.1 Chapter Overview
7.2 CAD/CAM
7.2.1 CAD/CAM Market Trends Analysis (2020-2032)
7.2.2 CAD/CAM Market Size Estimates and Forecasts to 2032 (USD Trillion)
7.3 Digital Video
7.3.1 Digital Video Market Trends Analysis (2020-2032)
7.3.2 Digital Video Market Size Estimates and Forecasts to 2032 (USD Trillion)
7.4 Simulation
7.4.1 Simulation Market Trends Analysis (2020-2032)
7.4.2 Simulation Market Size Estimates and Forecasts to 2032 (USD Trillion)
7.5 Imaging
7.5.1 Imaging Market Trends Analysis (2020-2032)
7.5.2 Imaging Market Size Estimates and Forecasts to 2032 (USD Trillion)
7.6 Animation
7.6.1 Animation Market Trends Analysis (2020-2032)
7.6.2 Animation Market Size Estimates and Forecasts to 2032 (USD Trillion)
8. Computer Graphics Market Segmentation By Services
8.1 Chapter Overview
8.2 Consulting
8.2.1 Consulting Market Trends Analysis (2020-2032)
8.2.2 Consulting Market Size Estimates and Forecasts to 2032 (USD Trillion)
8.3 Integration
8.3.1 Integration Market Trends Analysis (2020-2032)
8.3.2 Integration Market Size Estimates and Forecasts to 2032 (USD Trillion)
8.4 Training and Support
8.4.1 Training and Support Market Trends Analysis (2020-2032)
8.4.2 Training and Support Market Size Estimates and Forecasts to 2032 (USD Trillion)
9. Computer Graphics Market Segmentation By Verticals
9.1 Chapter Overview
9.2 Aerospace and defense
9.2.1 Aerospace and Defense Market Trends Analysis (2020-2032)
9.2.2 Aerospace and Defense Market Size Estimates and Forecasts to 2032 (USD Trillion)
9.3 Automobile
9.3.1 Automobile Market Trends Analysis (2020-2032)
9.3.2 Automobile Market Size Estimates and Forecasts to 2032 (USD Trillion)
9.4 Entertainment and Advertising
9.4.1 Entertainment and Advertising Market Trends Analysis (2020-2032)
9.4.2 Entertainment and Advertising Market Size Estimates and Forecasts to 2032 (USD Trillion)
9.5 Healthcare
9.5.1 Healthcare Market Trends Analysis (2020-2032)
9.5.2 Healthcare Market Size Estimates and Forecasts to 2032 (USD Trillion)
9.6 Manufacturing
9.6.1 Manufacturing Market Trends Analysis (2020-2032)
9.6.2 Manufacturing Market Size Estimates and Forecasts to 2032 (USD Trillion)
9.7 Architecture, Building, and Construction
9.7.1 Architecture, Building, and Construction Market Trends Analysis (2020-2032)
9.7.2 Architecture, Building, and Construction Market Size Estimates and Forecasts to 2032 (USD Trillion)
9.8 Others
9.8.1 Others Market Trends Analysis (2020-2032)
9.8.2 Others Market Size Estimates and Forecasts to 2032 (USD Trillion)
10. Computer Graphics Market Segmentation By End-User
10.1 Chapter Overview
10.2 Small & Medium Businesses
10.2.1 Small & Medium Businesses Market Trends Analysis (2020-2032)
10.2.2 Small & Medium Businesses Market Size Estimates and Forecasts to 2032 (USD Trillion)
10.3 Large Enterprises
10.3.1 Large Enterprises Market Trend Analysis (2020-2032)
10.3.2 Large Enterprises Market Size Estimates and Forecasts to 2032 (USD Trillion)
11. Regional Analysis
11.1 Chapter Overview
11.2 North America
11.2.1 Trend Analysis
11.2.2 North America Computer Graphics Market Estimates and Forecasts by Country (2020-2032) (USD Trillion)
11.2.3 North America Computer Graphics Market Estimates and Forecasts By Software (2020-2032) (USD Trillion)
11.2.4 North America Computer Graphics Market Estimates and Forecasts By Services (2020-2032) (USD Trillion)
11.2.5 North America Computer Graphics Market Estimates and Forecasts By Verticals (2020-2032) (USD Trillion)
11.2.6 North America Computer Graphics Market Estimates and Forecasts By End-User (2020-2032) (USD Trillion)
11.2.7 USA
11.2.7.1 USA Computer Graphics Market Estimates and Forecasts By Software (2020-2032) (USD Trillion)
11.2.7.2 USA Computer Graphics Market Estimates and Forecasts By Services (2020-2032) (USD Trillion)
11.2.7.3 USA Computer Graphics Market Estimates and Forecasts By Verticals (2020-2032) (USD Trillion)
11.2.7.4 USA Computer Graphics Market Estimates and Forecasts By End-User (2020-2032) (USD Trillion)
11.2.8 Canada
11.2.8.1 Canada Computer Graphics Market Estimates and Forecasts By Software (2020-2032) (USD Trillion)
11.2.8.2 Canada Computer Graphics Market Estimates and Forecasts By Services (2020-2032) (USD Trillion)
11.2.8.3 Canada Computer Graphics Market Estimates and Forecasts By Verticals (2020-2032) (USD Trillion)
11.2.8.4 Canada Computer Graphics Market Estimates and Forecasts By End-User (2020-2032) (USD Trillion)
11.2.9 Mexico
11.2.9.1 Mexico Computer Graphics Market Estimates and Forecasts By Software (2020-2032) (USD Trillion)
11.2.9.2 Mexico Computer Graphics Market Estimates and Forecasts By Services (2020-2032) (USD Trillion)
11.2.9.3 Mexico Computer Graphics Market Estimates and Forecasts By Verticals (2020-2032) (USD Trillion)
11.2.9.4 Mexico Computer Graphics Market Estimates and Forecasts By End-User (2020-2032) (USD Trillion)
11.3 Europe
11.3.1 Trend Analysis
11.3.2 Europe Computer Graphics Market Estimates and Forecasts by Country (2020-2032) (USD Trillion)
11.3.3 Europe Computer Graphics Market Estimates and Forecasts By Software (2020-2032) (USD Trillion)
11.3.4 Europe Computer Graphics Market Estimates and Forecasts By Services (2020-2032) (USD Trillion)
11.3.5 Europe Computer Graphics Market Estimates and Forecasts By Verticals (2020-2032) (USD Trillion)
11.3.6 Europe Computer Graphics Market Estimates and Forecasts By End-User (2020-2032) (USD Trillion)
11.3.7 Germany
11.3.7.1 Germany Computer Graphics Market Estimates and Forecasts By Software (2020-2032) (USD Trillion)
11.3.7.2 Germany Computer Graphics Market Estimates and Forecasts By Services (2020-2032) (USD Trillion)
11.3.7.3 Germany Computer Graphics Market Estimates and Forecasts By Verticals (2020-2032) (USD Trillion)
11.3.7.4 Germany Computer Graphics Market Estimates and Forecasts By End-User (2020-2032) (USD Trillion)
11.3.8 France
11.3.8.1 France Computer Graphics Market Estimates and Forecasts By Software (2020-2032) (USD Trillion)
11.3.8.2 France Computer Graphics Market Estimates and Forecasts By Services (2020-2032) (USD Trillion)
11.3.8.3 France Computer Graphics Market Estimates and Forecasts By Verticals (2020-2032) (USD Trillion)
11.3.8.4 France Computer Graphics Market Estimates and Forecasts By End-User (2020-2032) (USD Trillion)
11.3.9 UK
11.3.9.1 UK Computer Graphics Market Estimates and Forecasts By Software (2020-2032) (USD Trillion)
11.3.9.2 UK Computer Graphics Market Estimates and Forecasts By Services (2020-2032) (USD Trillion)
11.3.9.3 UK Computer Graphics Market Estimates and Forecasts By Verticals (2020-2032) (USD Trillion)
11.3.9.4 UK Computer Graphics Market Estimates and Forecasts By End-User (2020-2032) (USD Trillion)
11.3.10 Italy
11.3.10.1 Italy Computer Graphics Market Estimates and Forecasts By Software (2020-2032) (USD Trillion)
11.3.10.2 Italy Computer Graphics Market Estimates and Forecasts By Services (2020-2032) (USD Trillion)
11.3.10.3 Italy Computer Graphics Market Estimates and Forecasts By Verticals (2020-2032) (USD Trillion)
11.3.10.4 Italy Computer Graphics Market Estimates and Forecasts By End-User (2020-2032) (USD Trillion)
11.3.11 Spain
11.3.11.1 Spain Computer Graphics Market Estimates and Forecasts By Software (2020-2032) (USD Trillion)
11.3.11.2 Spain Computer Graphics Market Estimates and Forecasts By Services (2020-2032) (USD Trillion)
11.3.11.3 Spain Computer Graphics Market Estimates and Forecasts By Verticals (2020-2032) (USD Trillion)
11.3.11.4 Spain Computer Graphics Market Estimates and Forecasts By End-User (2020-2032) (USD Trillion)
11.3.12 Poland
11.3.12.1 Poland Computer Graphics Market Estimates and Forecasts By Software (2020-2032) (USD Trillion)
11.3.12.2 Poland Computer Graphics Market Estimates and Forecasts By Services (2020-2032) (USD Trillion)
11.3.12.3 Poland Computer Graphics Market Estimates and Forecasts By Verticals (2020-2032) (USD Trillion)
11.3.12.4 Poland Computer Graphics Market Estimates and Forecasts By End-User (2020-2032) (USD Trillion)
11.3.13 Turkey
11.3.13.1 Turkey Computer Graphics Market Estimates and Forecasts By Software (2020-2032) (USD Trillion)
11.3.13.2 Turkey Computer Graphics Market Estimates and Forecasts By Services (2020-2032) (USD Trillion)
11.3.13.3 Turkey Computer Graphics Market Estimates and Forecasts By Verticals (2020-2032) (USD Trillion)
11.3.13.4 Turkey Computer Graphics Market Estimates and Forecasts By End-User (2020-2032) (USD Trillion)
11.3.14 Rest of Europe
11.3.14.1 Rest of Europe Computer Graphics Market Estimates and Forecasts By Software (2020-2032) (USD Trillion)
11.3.14.2 Rest of Europe Computer Graphics Market Estimates and Forecasts By Services (2020-2032) (USD Trillion)
11.3.14.3 Rest of Europe Computer Graphics Market Estimates and Forecasts By Verticals (2020-2032) (USD Trillion)
11.3.14.4 Rest of Europe Computer Graphics Market Estimates and Forecasts By End-User (2020-2032) (USD Trillion)
11.4 Asia Pacific
11.4.1 Trend Analysis
11.4.2 Asia Pacific Computer Graphics Market Estimates and Forecasts by Country (2020-2032) (USD Trillion)
11.4.3 Asia Pacific Computer Graphics Market Estimates and Forecasts By Software (2020-2032) (USD Trillion)
11.4.4 Asia Pacific Computer Graphics Market Estimates and Forecasts By Services (2020-2032) (USD Trillion)
11.4.5 Asia Pacific Computer Graphics Market Estimates and Forecasts By Verticals (2020-2032) (USD Trillion)
11.4.6 Asia Pacific Computer Graphics Market Estimates and Forecasts By End-User (2020-2032) (USD Trillion)
11.4.7 China
11.4.7.1 China Computer Graphics Market Estimates and Forecasts By Software (2020-2032) (USD Trillion)
11.4.7.2 China Computer Graphics Market Estimates and Forecasts By Services (2020-2032) (USD Trillion)
11.4.7.3 China Computer Graphics Market Estimates and Forecasts By Verticals (2020-2032) (USD Trillion)
11.4.7.4 China Computer Graphics Market Estimates and Forecasts By End-User (2020-2032) (USD Trillion)
11.4.8 India
11.4.8.1 India Computer Graphics Market Estimates and Forecasts By Software (2020-2032) (USD Trillion)
11.4.8.2 India Computer Graphics Market Estimates and Forecasts By Services (2020-2032) (USD Trillion)
11.4.8.3 India Computer Graphics Market Estimates and Forecasts By Verticals (2020-2032) (USD Trillion)
11.4.8.4 India Computer Graphics Market Estimates and Forecasts By End-User (2020-2032) (USD Trillion)
11.4.9 Japan
11.4.9.1 Japan Computer Graphics Market Estimates and Forecasts By Software (2020-2032) (USD Trillion)
11.4.9.2 Japan Computer Graphics Market Estimates and Forecasts By Services (2020-2032) (USD Trillion)
11.4.9.3 Japan Computer Graphics Market Estimates and Forecasts By Verticals (2020-2032) (USD Trillion)
11.4.9.4 Japan Computer Graphics Market Estimates and Forecasts By End-User (2020-2032) (USD Trillion)
11.4.10 South Korea
11.4.10.1 South Korea Computer Graphics Market Estimates and Forecasts By Software (2020-2032) (USD Trillion)
11.4.10.2 South Korea Computer Graphics Market Estimates and Forecasts By Services (2020-2032) (USD Trillion)
11.4.10.3 South Korea Computer Graphics Market Estimates and Forecasts By Verticals (2020-2032) (USD Trillion)
11.4.10.4 South Korea Computer Graphics Market Estimates and Forecasts By End-User (2020-2032) (USD Trillion)
11.4.11 Singapore
11.4.11.1 Singapore Computer Graphics Market Estimates and Forecasts By Software (2020-2032) (USD Trillion)
11.4.11.2 Singapore Computer Graphics Market Estimates and Forecasts By Services (2020-2032) (USD Trillion)
11.4.11.3 Singapore Computer Graphics Market Estimates and Forecasts By Verticals (2020-2032) (USD Trillion)
11.4.11.4 Singapore Computer Graphics Market Estimates and Forecasts By End-User (2020-2032) (USD Trillion)
11.4.12 Australia
11.4.12.1 Australia Computer Graphics Market Estimates and Forecasts By Software (2020-2032) (USD Trillion)
11.4.12.2 Australia Computer Graphics Market Estimates and Forecasts By Services (2020-2032) (USD Trillion)
11.4.12.3 Australia Computer Graphics Market Estimates and Forecasts By Verticals (2020-2032) (USD Trillion)
11.4.12.4 Australia Computer Graphics Market Estimates and Forecasts By End-User (2020-2032) (USD Trillion)
11.4.13 Rest of Asia Pacific
11.4.13.1 Rest of Asia Pacific Computer Graphics Market Estimates and Forecasts By Software (2020-2032) (USD Trillion)
11.4.13.2 Rest of Asia Pacific Computer Graphics Market Estimates and Forecasts By Services (2020-2032) (USD Trillion)
11.4.13.3 Rest of Asia Pacific Computer Graphics Market Estimates and Forecasts By Verticals (2020-2032) (USD Trillion)
11.4.13.4 Rest of Asia Pacific Computer Graphics Market Estimates and Forecasts By End-User (2020-2032) (USD Trillion)
11.5 Middle East and Africa
11.5.1 Trend Analysis
11.5.2 Middle East and Africa Computer Graphics Market Estimates and Forecasts by Country (2020-2032) (USD Trillion)
11.5.3 Middle East and Africa Computer Graphics Market Estimates and Forecasts By Software (2020-2032) (USD Trillion)
11.5.4 Middle East and Africa Computer Graphics Market Estimates and Forecasts By Services (2020-2032) (USD Trillion)
11.5.5 Middle East and Africa Computer Graphics Market Estimates and Forecasts By Verticals (2020-2032) (USD Trillion)
11.5.6 Middle East and Africa Computer Graphics Market Estimates and Forecasts By End-User (2020-2032) (USD Trillion)
11.5.7 UAE
11.5.7.1 UAE Computer Graphics Market Estimates and Forecasts By Software (2020-2032) (USD Trillion)
11.5.7.2 UAE Computer Graphics Market Estimates and Forecasts By Services (2020-2032) (USD Trillion)
11.5.7.3 UAE Computer Graphics Market Estimates and Forecasts By Verticals (2020-2032) (USD Trillion)
11.5.7.4 UAE Computer Graphics Market Estimates and Forecasts By End-User (2020-2032) (USD Trillion)
11.5.8 Saudi Arabia
11.5.8.1 Saudi Arabia Computer Graphics Market Estimates and Forecasts By Software (2020-2032) (USD Trillion)
11.5.8.2 Saudi Arabia Computer Graphics Market Estimates and Forecasts By Services (2020-2032) (USD Trillion)
11.5.8.3 Saudi Arabia Computer Graphics Market Estimates and Forecasts By Verticals (2020-2032) (USD Trillion)
11.5.8.4 Saudi Arabia Computer Graphics Market Estimates and Forecasts By End-User (2020-2032) (USD Trillion)
11.5.1.9 Qatar
11.5.9.1 Qatar Computer Graphics Market Estimates and Forecasts By Software (2020-2032) (USD Trillion)
11.5.9.2 Qatar Computer Graphics Market Estimates and Forecasts By Services (2020-2032) (USD Trillion)
11.5.9.3 Qatar Computer Graphics Market Estimates and Forecasts By Verticals (2020-2032) (USD Trillion)
11.5.1.9.4 Qatar Computer Graphics Market Estimates and Forecasts By End-User (2020-2032) (USD Trillion)
11.5.10 South Africa
11.5.10.1 South Africa Computer Graphics Market Estimates and Forecasts By Software (2020-2032) (USD Trillion)
11.5.10.2 South Africa Computer Graphics Market Estimates and Forecasts By Services (2020-2032) (USD Trillion)
11.5.10.3 South Africa Computer Graphics Market Estimates and Forecasts By Verticals (2020-2032) (USD Trillion)
11.5.10.4 South Africa Computer Graphics Market Estimates and Forecasts By End-User (2020-2032) (USD Trillion)
11.5.11 Rest of Middle East & Africa
11.5.11.1 Rest of Middle East & Africa Computer Graphics Market Estimates and Forecasts By Software (2020-2032) (USD Trillion)
11.5.11.2 Rest of Middle East & Africa Computer Graphics Market Estimates and Forecasts By Services (2020-2032) (USD Trillion)
11.5.11.3 Rest of Middle East & Africa Computer Graphics Market Estimates and Forecasts By Verticals (2020-2032) (USD Trillion)
11.5.11.4 Rest of Middle East & Africa Computer Graphics Market Estimates and Forecasts By End-User (2020-2032) (USD Trillion)
11.6 Latin America
11.6.1 Trend Analysis
11.6.2 Latin America Computer Graphics Market Estimates and Forecasts by Country (2020-2032) (USD Trillion)
11.6.3 Latin America Computer Graphics Market Estimates and Forecasts By Software (2020-2032) (USD Trillion)
11.6.4 Latin America Computer Graphics Market Estimates and Forecasts By Services (2020-2032) (USD Trillion)
11.6.5 Latin America Computer Graphics Market Estimates and Forecasts By Verticals (2020-2032) (USD Trillion)
11.6.6 Latin America Computer Graphics Market Estimates and Forecasts By End-User (2020-2032) (USD Trillion)
11.6.7 Brazil
11.6.7.1 Brazil Computer Graphics Market Estimates and Forecasts By Software (2020-2032) (USD Trillion)
11.6.7.2 Brazil Computer Graphics Market Estimates and Forecasts By Services (2020-2032) (USD Trillion)
11.6.7.3 Brazil Computer Graphics Market Estimates and Forecasts By Verticals (2020-2032) (USD Trillion)
11.6.7.4 Brazil Computer Graphics Market Estimates and Forecasts By End-User (2020-2032) (USD Trillion)
11.6.8 Argentina
11.6.8.1 Argentina Computer Graphics Market Estimates and Forecasts By Software (2020-2032) (USD Trillion)
11.6.8.2 Argentina Computer Graphics Market Estimates and Forecasts By Services (2020-2032) (USD Trillion)
11.6.8.3 Argentina Computer Graphics Market Estimates and Forecasts By Verticals (2020-2032) (USD Trillion)
11.6.8.4 Argentina Computer Graphics Market Estimates and Forecasts By End-User (2020-2032) (USD Trillion)
11.6.9 Rest of Latin America
11.6.9.1 Rest of Latin America Computer Graphics Market Estimates and Forecasts By Software (2020-2032) (USD Trillion)
11.6.9.2 Rest of Latin America Computer Graphics Market Estimates and Forecasts By Services (2020-2032) (USD Trillion)
11.6.9.3 Rest of Latin America Computer Graphics Market Estimates and Forecasts By Verticals (2020-2032) (USD Trillion)
11.6.9.4 Rest of Latin America Computer Graphics Market Estimates and Forecasts By End-User (2020-2032) (USD Trillion)
12. Company Profiles
12.1 NVIDIA
12.1.1 Company Overview
12.1.2 Financial
12.1.3 Products/ Services Offered
12.1.4 SWOT Analysis
12.2 AMD
12.2.1 Company Overview
12.2.2 Financial
12.2.3 Products/ Services Offered
12.2.4 SWOT Analysis
12.3 Intel.
12.3.1 Company Overview
12.3.2 Financial
12.3.3 Products/ Services Offered
12.3.4 SWOT Analysis
12.4 Autodesk.
12.4.1 Company Overview
12.4.2 Financial
12.4.3 Products/ Services Offered
12.4.4 SWOT Analysis
12.5 Adobe
12.5.1 Company Overview
12.5.2 Financial
12.5.3 Products/ Services Offered
12.5.4 SWOT Analysis
12.6 Apple
12.6.1 Company Overview
12.6.2 Financial
12.6.3 Products/ Services Offered
12.6.4 SWOT Analysis
12.7 Microsoft
12.7.1 Company Overview
12.7.2 Financial
12.7.3 Products/ Services Offered
12.7.4 SWOT Analysis
12.8 Unity Technologies
12.8.1 Company Overview
12.8.2 Financial
12.8.3 Products/ Services Offered
12.8.4 SWOT Analysis
12.9 Epic Games.
12.9.1 Company Overview
12.9.2 Financial
12.9.3 Products/ Services Offered
12.9.4 SWOT Analysis
12.10 Siemens
12.10.1 Company Overview
12.10.2 Financial
12.10.3 Products/ Services Offered
12.10.4 SWOT Analysis
13. Use Cases and Best Practices
14. Conclusion
An accurate research report requires proper strategizing as well as implementation. There are multiple factors involved in the completion of good and accurate research report and selecting the best methodology to compete the research is the toughest part. Since the research reports we provide play a crucial role in any company’s decision-making process, therefore we at SNS Insider always believe that we should choose the best method which gives us results closer to reality. This allows us to reach at a stage wherein we can provide our clients best and accurate investment to output ratio.
Each report that we prepare takes a timeframe of 350-400 business hours for production. Starting from the selection of titles through a couple of in-depth brain storming session to the final QC process before uploading our titles on our website we dedicate around 350 working hours. The titles are selected based on their current market cap and the foreseen CAGR and growth.
The 5 steps process:
Step 1: Secondary Research:
Secondary Research or Desk Research is as the name suggests is a research process wherein, we collect data through the readily available information. In this process we use various paid and unpaid databases which our team has access to and gather data through the same. This includes examining of listed companies’ annual reports, Journals, SEC filling etc. Apart from this our team has access to various associations across the globe across different industries. Lastly, we have exchange relationships with various university as well as individual libraries.
Step 2: Primary Research
When we talk about primary research, it is a type of study in which the researchers collect relevant data samples directly, rather than relying on previously collected data. This type of research is focused on gaining content specific facts that can be sued to solve specific problems. Since the collected data is fresh and first hand therefore it makes the study more accurate and genuine.
We at SNS Insider have divided Primary Research into 2 parts.
Part 1 wherein we interview the KOLs of major players as well as the upcoming ones across various geographic regions. This allows us to have their view over the market scenario and acts as an important tool to come closer to the accurate market numbers. As many as 45 paid and unpaid primary interviews are taken from both the demand and supply side of the industry to make sure we land at an accurate judgement and analysis of the market.
This step involves the triangulation of data wherein our team analyses the interview transcripts, online survey responses and observation of on filed participants. The below mentioned chart should give a better understanding of the part 1 of the primary interview.
Part 2: In this part of primary research the data collected via secondary research and the part 1 of the primary research is validated with the interviews from individual consultants and subject matter experts.
Consultants are those set of people who have at least 12 years of experience and expertise within the industry whereas Subject Matter Experts are those with at least 15 years of experience behind their back within the same space. The data with the help of two main processes i.e., FGDs (Focused Group Discussions) and IDs (Individual Discussions). This gives us a 3rd party nonbiased primary view of the market scenario making it a more dependable one while collation of the data pointers.
Step 3: Data Bank Validation
Once all the information is collected via primary and secondary sources, we run that information for data validation. At our intelligence centre our research heads track a lot of information related to the market which includes the quarterly reports, the daily stock prices, and other relevant information. Our data bank server gets updated every fortnight and that is how the information which we collected using our primary and secondary information is revalidated in real time.
Step 4: QA/QC Process
After all the data collection and validation our team does a final level of quality check and quality assurance to get rid of any unwanted or undesired mistakes. This might include but not limited to getting rid of the any typos, duplication of numbers or missing of any important information. The people involved in this process include technical content writers, research heads and graphics people. Once this process is completed the title gets uploader on our platform for our clients to read it.
Step 5: Final QC/QA Process:
This is the last process and comes when the client has ordered the study. In this process a final QA/QC is done before the study is emailed to the client. Since we believe in giving our clients a good experience of our research studies, therefore, to make sure that we do not lack at our end in any way humanly possible we do a final round of quality check and then dispatch the study to the client.
Key Segments:
By Software
CAD/CAM
Digital Video
Simulation
Imaging
Animation
By Services
Consulting
Integration
Training and Support
By Verticals
Aerospace and defense
Automobile
Entertainment and Advertising
Academia and Education
Healthcare
Manufacturing
Architecture, Building and Construction
Others
By End-User
Small & Medium Businesses
Large Enterprises
Request for Segment Customization as per your Business Requirement: Segment Customization Request
Regional Coverage:
North America
US
Canada
Mexico
Europe
Germany
France
UK
Italy
Spain
Poland
Turkey
Rest of Europe
Asia Pacific
China
India
Japan
South Korea
Singapore
Australia
Taiwan
Rest of Asia Pacific
Middle East & Africa
UAE
Saudi Arabia
Qatar
South Africa
Rest of Middle East & Africa
Latin America
Brazil
Argentina
Rest of Latin America
Request for Country Level Research Report: Country Level Customization Request
Available Customization
With the given market data, SNS Insider offers customization as per the company’s specific needs. The following customization options are available for the report:
Detailed Volume Analysis
Criss-Cross segment analysis (e.g. Product X Application)
Competitive Product Benchmarking
Geographic Analysis
Additional countries in any of the regions
Customized Data Representation
Detailed analysis and profiling of additional market players
The IoT Connected Machines Market Size was valued at USD 164.34 Billion in 2023 and is expected to grow at a CAGR of 18.49% between 2024-2032.
Analog Servo Motors and Drives Market Size was valued at USD 9.98 billion in 2023 and is expected to reach USD 18.14 billion by 2032 and grow at a CAGR of 6.95% over the forecast period 2024-2032.
The Total Station Market was valued at USD 1.87 billion in 2023 and is expected to reach USD 3.13 billion by 2032, growing at a CAGR of 5.94% over the forecast period 2024-2032.
The Telecom Power System Market Size was valued at USD 3.95 Billion in 2023 and is expected to reach USD 9.60 Billion by 2032 and grow at a CAGR of 10.4% over the forecast period 2024-2032.
The Smart Greenhouse Market Size was valued at USD 1.91 Billion in 2023 and is expected to grow at a CAGR of 9.72% to reach USD 4.39 Billion by 2032.
The Drip Irrigation Market size was valued at USD 5.81 billion in 2023 and is expected to grow to USD 12.29 billion by 2032 and grow at a CAGR of 9.8% over the forecast period of 2024-2032.
Hi! Click one of our member below to chat on Phone