Computer Assisted Coding Market Analysis & Overview:
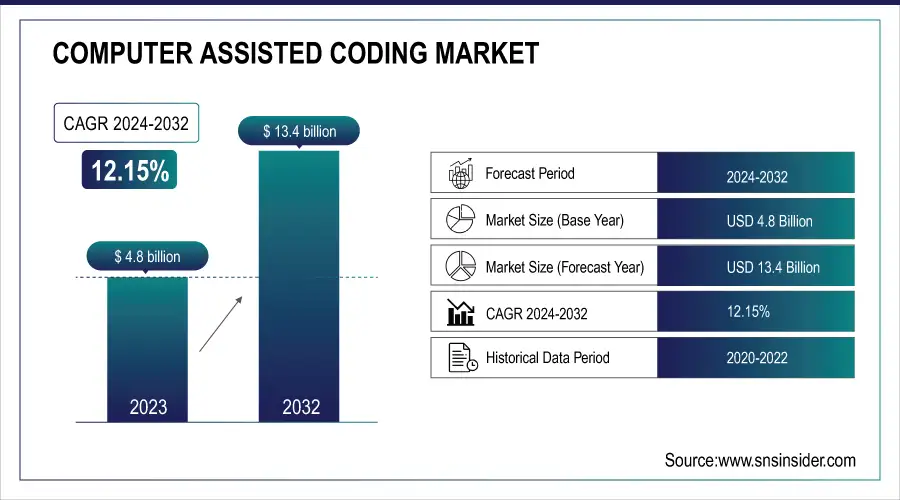
The Computer Assisted Coding Market was valued at USD 4.8 Billion in 2023 and is expected to reach USD 13.4 Billion by 2032, growing at a CAGR of 12.15% from 2024-2032.
This report explores the adoption trends of Computer Assisted Coding software in 2023, driven by automation and accuracy improvements in medical billing. Compliance-focused solutions show significant error reduction, enhancing coding precision across healthcare systems. Security and data privacy investments have risen, with AI-driven encryption playing a key role. However, user satisfaction is influenced by integration challenges, with complexity and training requirements being major adoption barriers. Additionally, the report highlights a growing shift toward cloud-based CAC solutions and AI-powered advancements to streamline coding efficiency and regulatory compliance.
To Get more information on Computer Assisted Coding Market - Request Free Sample Report
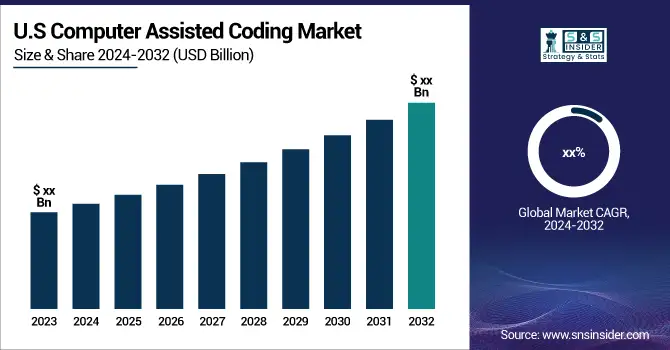
AI-driven CAC solutions have been the pioneer employed solutions by the US healthcare industry to meet the demands of accurate coding, reduce the cost of billing, and increase the efficiency of reimbursement. In addition, government initiatives, such as the transition towards ICD-11 and growth in allocations in the digital health framework also stimulate the growth of the market.
Computer Assisted Coding Market Dynamics
Drivers
-
AI and NLP technologies enhance coding accuracy, reduce errors, and improve workflow efficiency in healthcare.
CAC solutions have witnessed significant market growth due to the growing integration of artificial intelligence and natural language processing in these solutions. Such technologies, broadly improve the accuracy of coding, reduce the chances of human error and enhance the workflow efficiency of the healthcare provider. These AI-powered CAC systems can process through a plethora of medical documentation, pick out the essential information and apply the relevant codes, which helps to ease the workload on medical coders. The epidemic of increasing expenditure on the healthcare system along with the transformation of the healthcare system towards value-based healthcare, has led to an inevitable increase in the requirement of automated coding. Moreover, the use of AI-driven predictive analytics, real-time error detection, etc., boosts the coding efficiency for accurate reimbursement and lower claim denials in the healthcare sector.
Restraint
-
The high upfront costs and continuous updates make CAC adoption challenging for smaller healthcare providers.
Implementing CAC systems requires high costs associated with software licensing, integration, and continuous maintenance. AI-driven solutions may have great offerings, but the sheer upfront investment required often leaves small and mid-sized healthcare facilities behind. CAC software must regularly be updated to meet changes in medical coding regulations like type and amount of changes with ICD-11 and CPT. The added expense of training medical coders and healthcare staff to effectively utilize CAC systems further adds to the overall cost burden. The market growth is constrained by the lack of sufficient financial backing, which restricts many healthcare organizations, especially in developing regions, to not justify switching from the traditional manual coding aspect to automated solution aspect.
Opportunity
-
Cloud-based CAC platforms offer scalability, cost efficiency, and seamless integration with EHRs and telehealth.
Cloud-based CAC solutions are gaining maximum traction, providing a broad growth opportunity for the market. Unlike traditional on-prem solutions, cloud-based systems provide better scalability, improved access to real-time data, and cost effectiveness. This allows healthcare providers to code more quickly and effectively without having to invest in a large IT infrastructure. In addition, cloud-based CAC platforms are more likely to allow seamless integration with electronic health records and telehealth applications, which improves interoperability. The rising trend of remote working in the healthcare industry has also driven the demand for cloud solutions, as coders will now be able to work from anywhere. Cloud-Based CAC systems are likely to witness increased adoption as data security and compliance measures improve.
Challenge
-
Frequent changes in medical coding regulations require continuous updates and compliance monitoring for CAC solutions.
CAC providers will still face a huge challenge to keep up with frequent changes in healthcare regulations and coding guidelines. Ongoing software updates and monitoring for compliance with regulations, including HIPAA, ICD-11, and updates in CPT coding. Healthcare providers that neglect to keep pace with these changing standards risk claim denials, legal penalties, and financial losses. Second, the regulations around coding and billing are very different from country to country, making it very difficult for CAC vendors to create something that is compliant in every country. In addition, patient security and making certain that the data is private, while as yet being in full consistency with worldwide medicinal services principles, is another issue which CAC faces, obliging constant enhancements to CAC innovation.
Computer Assisted Coding Market Segmentation Analysis
By Product & Service
The computer-assisted coding solutions segment dominated the market and accounted for significant revenue share in 2023, which results from rising usage of AI-powered automation in medical coding. With these solutions, hospitals and healthcare providers are improving coding, decreasing human errors, and enhancing reimbursement. The increasing requirement for meeting regulatory standards such as ICD-11 and HIPAA is also supporting adoption. Thanks to advances in AI and natural language processing, these solutions are becoming more efficient and are increasingly embedded within EHRs.
The computer-assisted coding services are expected to register the fastest CAGR during the forecast period, owing to increasing demand for outsourced coding solutions and technical support. Managed services are being adopted by many healthcare organizations, especially smaller and mid-sized providers where operational costs are forcing these providers to evaluate innovative alternatives to overcoming staff shortages. So as medical coding regulations become more complex, the need for expert consultation and compliance monitoring has also risen.
By Mode of Delivery
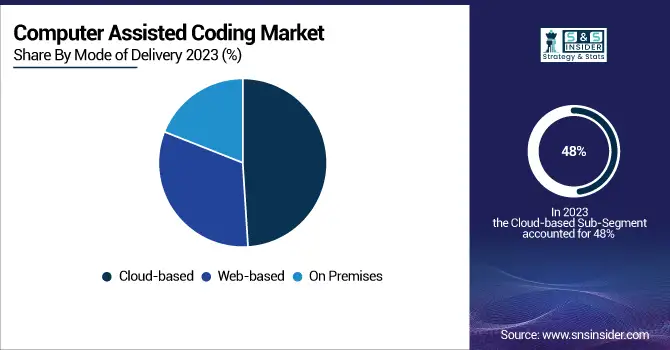
In 2023, Cloud-based CAC segment dominated the market and accounted for the largest share of more than 48% of the CAC market owing to their flexible and less expensive solutions with higher adaptability assisting with EHR integration. The capabilities of cloud-based healthcare solutions to offer timely updates, remote access, and compatibility for ever-changing coding mandates, ICD-11 and HIPAA compliance, because of that, healthcare providers are flocking to the cloud. Increasing usage of AI and NLP for cloud-based CAC also makes it more automated and accurate.
The web-based CAC segment is predicted to register the fastest CAGR during the forecast period, because of its affordability, ease of implementation, and accessibility without extensive IT infrastructure. Web-based CAC solutions are being used extensively by small and mid-sized healthcare providers for better accuracy in medical coding at low costs. In general, Web-based platforms are also highly preferred by those coding professionals who work remotely, because they allow for rapid implementation, automatic updates, and compatibility with multiple devices.
By Application
The Automated Computer‑Assisted Encoding segment dominates the Computer Assisted Coding Market due to its ability to streamline medical coding processes, reduce manual errors, and improve overall efficiency. Healthcare providers increasingly adopt this technology to enhance productivity, ensure accurate reimbursement, and comply with regulatory standards, making it the largest revenue-generating application in the market.
The Clinical Code Auditing segment is the fastest-growing application in the Computer Assisted Coding Market. Rising focus on compliance, error detection, and quality assurance drives adoption. Hospitals and healthcare organizations are increasingly implementing auditing solutions to identify coding inaccuracies, optimize revenue cycles, and improve patient record accuracy, contributing to rapid growth and significant market expansion in this segment.
By End-Use
The providers segment dominated the market and accounted for significant revenue share in 2023, as adoption of Computer-Assisted Coding solutions in hospitals, clinics, and diagnostic centers. CAC is used by healthcare providers to improve medical coding accuracy and speed up billing while ensuring that they comply with constantly-changing regulations such as ICD-11 and HIPAA. As patient volume increases, and the complexity involved in medical coding has forced Hospitals and Clinics to implement AI-driven CAC systems into their practice workflows.
The payers segment is anticipated to register the fastest CAGR during the forecast period due to rising utilization of CAC solutions for automating the claims processing, and fraud detection by insurance companies and health plan administrators. Increasing healthcare costs is making payers embrace AI-powered CAC systems to boost administrative productivity, decrease claim denial, and improve the accuracy of reimbursements. Increasing need for real-time coding verification and regulatory compliance monitoring is propelling the adoption in this segment.
Computer Assisted Coding Market Regional Outlook
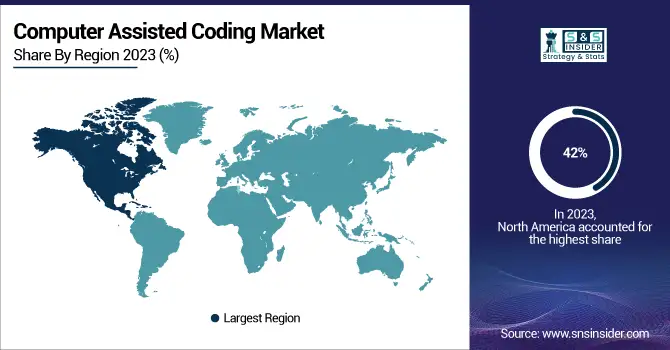
In 2023, North America dominated the market and accounted for the largest share of the market, more than 42%, primarily attributed to the high penetration of advanced healthcare IT solutions, the need to comply with regulatory requirements, and the presence of key CAC vendors.
Get Customized Report as per Your Business Requirement - Enquiry Now
Asia-Pacific region is projected to witness the fastest CAGR owing to swift healthcare digitalization, increasing medical expenditure, and a growing preference for automated coding solutions. The adoption of CAC continues to grow in countries such as China, India, and Japan thanks to efforts from government agencies for healthcare systems modernization and standardized coding mandates. Market Highlights The increasing hospital and insurance provider demand for affordable cloud-based CAC solutions is expected to boost overall market growth.
Key players
The major key players along with their products are
-
3M – 3M 360 Encompass System
-
Optum – Optum CAC
-
Nuance Communications – Nuance Clintegrity
-
Cerner – Cerner CAC
-
Dolbey – Fusion CAC
-
MModal (part of 3M) – MModal Fluency for Coding
-
AI-Med Services – AI-Med CAC
-
ZyDoc – ZyDoc CAC
-
nThrive – nThrive Coding & CDI
-
Streamline Health – eValuator Coding Analysis Platform
-
TruCode – TruCode Encoder
-
Epic Systems – Epic CAC
-
Ciox Health – Ciox Coding Solutions
-
Harris Computer – JustCoding by Harris
-
ezDI – ezCAC
Recent Developments
-
January 2024: 3M Health Information Systems released an updated CAC software featuring enhanced machine learning algorithms for improved coding accuracy and better integration with electronic health record (EHR) systems.
-
March 2024: Optum360 launched a new CAC platform aimed at streamlining coding processes in outpatient settings. This platform incorporates advanced natural language processing capabilities to enhance coding accuracy and efficiency across diverse clinical documentation.
| Report Attributes | Details |
|---|---|
| Market Size in 2023 | USD 4.8 Billion |
| Market Size by 2032 | USD 13.4 Billion |
| CAGR | CAGR of 12.15% From 2024 to 2032 |
| Base Year | 2023 |
| Forecast Period | 2024-2032 |
| Historical Data | 2020-2022 |
| Report Scope & Coverage | Market Size, Segments Analysis, Competitive Landscape, Regional Analysis, DROC & SWOT Analysis, Forecast Outlook |
| Key Segments | • By Product & Service (Computer-assisted coding solutions, Standalone computer-assisted coding software, Integrated computer-assisted coding software, Computer-assisted coding services, Support & maintenance services, Education & training services) • By Mode Of Delivery (Web-based, Cloud-based, On-Premises) • By Application (Automated computer-assisted encoding, Management reporting & analytics, Clinical code auditing) • By End User (Payers, Providers, Hospitals, Physicians/Clinics, Clinical laboratories & diagnostic centers, Academic medical centers, Other healthcare institutions) |
| Regional Analysis/Coverage | North America (US, Canada, Mexico), Europe (Eastern Europe [Poland, Romania, Hungary, Turkey, Rest of Eastern Europe] Western Europe] Germany, France, UK, Italy, Spain, Netherlands, Switzerland, Austria, Rest of Western Europe]), Asia Pacific (China, India, Japan, South Korea, Vietnam, Singapore, Australia, Rest of Asia Pacific), Middle East & Africa (Middle East [UAE, Egypt, Saudi Arabia, Qatar, Rest of Middle East], Africa [Nigeria, South Africa, Rest of Africa], Latin America (Brazil, Argentina, Colombia, Rest of Latin America) |
| Company Profiles | 3M, Optum, Nuance Communications, Cerner, Dolbey, MModal, AI-Med Services, ZyDoc, nThrive, Streamline Health, TruCode, Epic Systems, Ciox Health, Harris Computer, ezDI |
