image

Computed Tomography Market Report Scope & Overview:

Computed Tomography Market Revenue Analysis

Get More Information on Computed Tomography Market - Request Sample Report

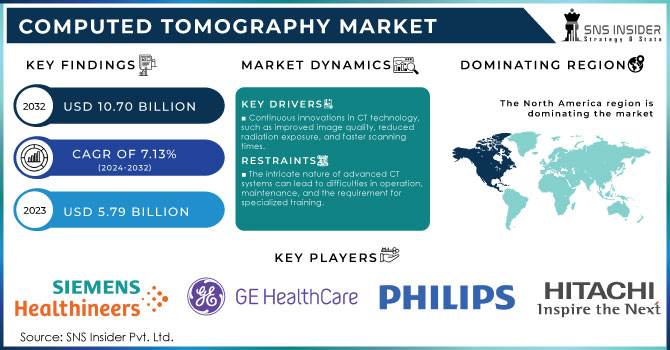
The Computed Tomography Market was worth USD 5.79 billion in 2023 and is predicted to be worth USD 10.70 billion by 2032, growing at a CAGR of 7.13% between 2024 and 2032.

Technological advancements in computed tomography (CT) technology, in combination with the growing prevalence of chronic disorders, such as cancer, orthopedics, and cardiovascular & neurological conditions, are expected to drive market growth. Additionally, increasing awareness and focus on preventive healthcare measures have led to a surge in routine diagnostic procedures, contributing to the expanding market for computed tomography. The advent of CT has significantly enhanced medical care. This technology enhances diagnostic accuracy, reduces the need for unnecessary procedures, aids in better treatment by offering detailed anatomical images, and serves as a cost-effective imaging method.

It is a vital diagnostic tool, particularly for simultaneously scanning bones, soft tissues, and blood vessels. Because CT imaging is fast and straightforward in emergencies, internal injuries can be detected promptly, potentially saving lives. Thus, increasing demand for advanced assessment tools in the emergency department and the rising number of ambulatory emergency care units are the factors anticipated to have a positive impact on market growth.

Numerous private and government organizations are making significant investments in R&D. For example, in 2022, Siemens Healthineers launched a new CT production facility in India to meet the increasing demand for CT devices and strengthen its market position.

The NCBI reports that over 70 million CT scans are conducted annually in the U.S. and 7.1 million in the UK, with a yearly increase of 10%, highlighting the Substantial growth potential of CT in the broader medical imaging market. The rapid expansion of CT scan applications, along with the increasing trend of using CT scans for effective lung cancer screening, is anticipated to drive the demand for CT scanners in both developed and developing countries.

Market Dynamics

Drivers

  • The expanding elderly population, which is more prone to medical conditions that necessitate CT imaging.

  • Continuous innovations in CT technology, such as improved image quality, reduced radiation exposure, and faster scanning times.

  • Risan spending on healthcare services, particularly in emerging markets, drives the demand for advanced diagnostic tools like CT scanners.

The demand for advanced diagnostic tools, such as computed tomography scanners, rises all over the world. In particular, it can be witnessed in developing countries and certain parts of the world. The demand for the equipment is heavily impacted by the increase in healthcare spending. As countries develop their economies, they are likely to experience an increase in the healthcare budget. The phenomenon is also driven by the shift in people’s perception and behavior. As such, developing countries have observed a rise in chronic diseases, an aging population, and related issues. Healthcare providers are more interested in modern imaging technologies. CT scanners are essential because they provide clear images of the inside of the body. They allow identifying and diagnosing a broad array of conditions. The demand for the equipment is also increased by technological developments that make the scanners more efficient in terms of radiation exposure, quality of images, etc.

The market for sophisticated imaging technologies is boosted by the increasing emphasis on the acquisition of innovative tools worldwide. In particular, healthcare providers in emerging markets are interested in modernizing their imaging devices and capabilities. At the same time, the upward pressure is imposed by the shift in the volume of money invested into healthcare in the corresponding areas. At this point, the demand for CT scanners will keep increasing as emerging markets prioritize investments in diagnostic imaging. The interest in modern devices is likely to motivate small clinics and rural hospitals to upgrade their equipment. The demand will be further boosted by the increasing healthcare spending in the corresponding regions. A rise in the sales of the CT scanners is expected to lead to an improvement in healthcare outcomes and patient care.

Furthermore, Continuous advancements in CT technology are significantly improving diagnostic accuracy and patient safety. Enhanced image clarity allows for more detailed scans, leading to more precise diagnoses, while reduced radiation exposure minimizes risks, ensuring patient safety without compromising diagnostic quality. Faster scan times also enhance efficiency, enabling quicker diagnoses and treatments, particularly in emergency situations. These innovations collectively boost the reliability of CT imaging, making it an indispensable tool for diagnosing a wide range of medical conditions and meeting the growing demand for safe, accurate diagnostic solutions.

Restraints

  • The intricate nature of advanced CT systems can lead to difficulties in operation, maintenance, and the requirement for specialized training.

  • The substantial investment required for purchasing and maintaining advanced CT equipment can limit market growth.

  • Increasing concerns about the security of patient data and compliance with data protection regulations can affect market dynamics.

Growing concerns about the security of patient data and adherence to data protection regulations can significantly impact the CT market. As healthcare systems handle more sensitive information, stringent regulations are imposed to safeguard patient privacy and ensure data security. Meeting these regulations usually necessitates the implementation of sophisticated security measures and systems, which can raise costs and add complexity for healthcare providers. Furthermore, breaches or failures in data protection can result in legal consequences and harm to reputation. These issues can impact market dynamics by influencing the adoption of new technologies, increasing operational expenses, and affecting the overall demand for CT scanners and associated services.

The high cost associated with acquiring and maintaining advanced CT equipment can restrict market growth. This significant financial outlay includes not only the initial purchase price but also ongoing expenses for upkeep, repairs, and upgrades. For healthcare providers, especially in budget-constrained environments or developing regions, these costs can be excessive, limiting their ability to invest in and adopt new CT technology. As a result, this financial barrier can slow the overall expansion of the CT market.

Segment Analysis

By Technology

In 2023, The high-end slice CT segment dominated the market and accounted for the maximum revenue share of 35.2%. High-end slice scanners are used in patients with arrhythmia, pediatric patients who tend to move more during scans, and overweight individuals. They cover a larger scanning area within less time. Some of the opretional scanner can scan the whole body in 0.3 sec/per rotation (Siemens 700 Slice), which can enable healthcare providers to offer customized solutions and even produce real-time images. A 320-slice CT scan provides an imaging coverage of 16 cm per rotation. Furthermore, the procedure does not require patients to hold their breath, enhancing patient comfort, particularly for children.

The cone-beam segment is anticipated the fastest CAGR over the forecast period due to an increase in the use of cone-beam CTs in areas, such as dental, orthopedic, ENT, oral surgery, and interventional radiology. The technique offers several benefits, including its compact size, reduced radiation exposure, and lower cost compared to traditional CT systems.

By Application

The oncology segment dominated the market and held the largest revenue share of 27.28% in 2023, and anticipated that expand at the fastest CAGR over the forecast period. CT scans are frequently employed to identify and track tumors, assess the success of cancer treatments, and design radiation therapy plans. They assist oncologists in determining the size, shape, and position of tumors, as well as whether they have metastasized to other areas. The rising incidence of cancer and the expanding use of CT scans for diagnosing various cancers, including lumps and tumors, are anticipated to fuel growth in this segment.

The neurology & musculoskeletal segment is expected to witness a substantial growth rate over the forecast period. Driven by rising prevalence of neurological disorders and musculoskeletal conditions. Increasing demand for advanced imaging techniques for early and accurate diagnosis, combined with technological advancements like 3D imaging and AI integration, are driving this growth. The future forecast points to increased adoption of CT scans for brain, spine, and orthopedic imaging, with continued innovation enhancing diagnostic precision and patient outcomes.

By End-Use

In 2023, The hospital segment dominated the market and accounted for the maximum revenue share of 42.32%.  The increased number of emergency patients in hospitals and the high number of yearly surgeries have facilitated the segment’s share. Hospitals are routinely installing or upgrading medical imaging equipment. Imaging systems like CT, MRI, and ultrasound within hospitals can positively impact several factors, including the length of hospital stays, overall healthcare costs, quality of care, and the availability of emergency services.

The diagnostic imaging centers segment is projected to experience substantial growth during the forecast period. CT scans are essential for diagnosing many medical conditions. Diagnostic imaging centers are often chosen over hospitals because they focus only on imaging services. This focus gives them greater expertise and experience, resulting in improved care and a more positive overall experience for patients.
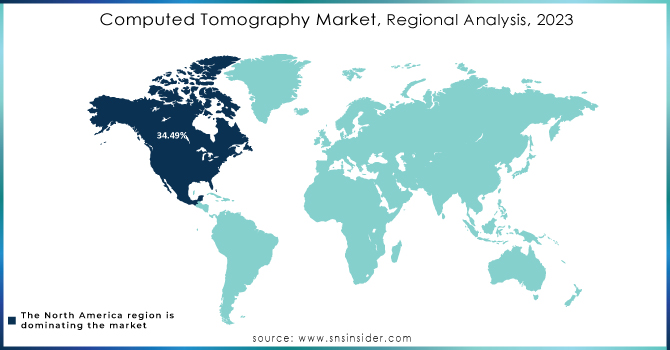
Regional Analysis

In 2023, North America's computed tomography market held the largest share of 34.49%. and is expected to continue its dominance throughout the forecast period. Key factors driving the region's growth include an increasing elderly population, high rates of obesity, and widespread chronic conditions such as breast cancer, cardiovascular issues, and neurological diseases, all of which boost the demand for imaging services. Additionally, advancements in technology are expected to further enhance market expansion.

The Asia Pacific computed tomography market is led by China & Japan and is expected to exhibit the fastest CAGR of 8.79% during the forecast period. The rapid population growth and the surge in R&D activities in this region have contributed to this trend. Moreover, there is a significant demand for advanced devices in the Asia-Pacific region.

Computed-Tomography-Market-Regional-Analysis-2023

Need Any Customization Research On Computed Tomography Market - Inquiry Now

Key Players

The major key players are

  • Siemens Healthineers - (Somatom Definition Edge, Somatom Force)

  • GE Healthcare - (Revolution CT, Discovery CT750 HD)

  • Canon Medical Systems - (Aquilion ONE, Aquilion Prime SP)

  • Philips Healthcare - (IQon Spectral CT, Incisive CT)

  • Hitachi Medical Systems - (Supria CT, Scenaria View)

  • Neusoft Medical Systems - (NeuViz 128, NeuViz Glory)

  • United Imaging Healthcare - (uCT 760, uCT 550)

  • Samsung Neurologica - (CereTom, BodyTom)

  • Shenzhen Anke High-tech - (ANATOM 16, ANATOM 64)

  • Planmed Oy - (Planmed Verity, Planmed Clarity)

  • Fujifilm Holdings Corporation - (FCT Speedia, FCT Embrace)

  • Carestream Health - (OnSight 3D Extremity System, DRX-CT)

  • Medtronic - (StealthStation S8, O-arm Surgical Imaging System)

  • Koning Corporation - (Koning Breast CT, KBCT 1000)

  • Shimadzu Corporation - (Trinias F12 Unity Edition, RadSpeed Pro CT)

  • Neurologica Corporation - (Portable CT Scanner, OmniTom CT)

  • Analogic Corporation - (BK Medical Flex Focus, CT Scanner System)

  • CurveBeam - (InReach CT Imaging, PedCAT CT Imaging)

  • Bruker Corporation - (SkyScan 1276 Micro-CT, BioSpec MRI/CT)

  • Esaote SpA - (O-scan, S-scan)

Recent developments

In January 2024, GE HealthCare announced its acquisition of MIM Software, a leading provider of AI-driven solutions for medical imaging analysis.

In January 2023, GE HealthCare signed an agreement to acquire IMACTIS, a France-based company known for its innovative work in the rapidly growing field of Computed Tomography (CT) interventional guidance across various healthcare settings.

Computed Tomography Market Report Scope:

Report Attributes Details
Market Size in 2023 USD 5.79 Billion
Market Size by 2032 USD 10.70 Billion
CAGR CAGR of 7.13% From 2024 to 2032
Base Year 2023
Forecast Period 2024-2032
Historical Data 2020-2022
Report Scope & Coverage Market Size, Segments Analysis, Competitive  Landscape, Regional Analysis, DROC & SWOT Analysis, Forecast Outlook
Key Segments • By Technology (High-end Slice CT, Mid-end Slice CT, Low-end Slice CT and Cone Beam CT (CBCT))
• By Application (Oncology, Cardiology, Vascular, Neurology, Musculoskeletal and Others)
• By End-Use (Hospitals, Diagnostic Imaging Centers and Others)
Regional Analysis/Coverage North America (US, Canada, Mexico), Europe (Eastern Europe [Poland, Romania, Hungary, Turkey, Rest of Eastern Europe] Western Europe] Germany, France, UK, Italy, Spain, Netherlands, Switzerland, Austria, Rest of Western Europe]), Asia Pacific (China, India, Japan, South Korea, Vietnam, Singapore, Australia, Rest of Asia Pacific), Middle East & Africa (Middle East [UAE, Egypt, Saudi Arabia, Qatar, Rest of Middle East], Africa [Nigeria, South Africa, Rest of Africa], Latin America (Brazil, Argentina, Colombia, Rest of Latin America)
Company Profiles CST Industries, Inc., Balmoral Tanks Ltd, McDermott International Inc., Containment Solutions, Inc., DN Tanks, Caldwell Tanks, Sintex Industries Ltd, Emiliana Serbatoi S.r.l., Carbery Plastics Limited, Nova Plastic Industries L.L.C,PermianLide, Superior Tank Co., Inc, Wheeler Tank Manufacturing, T.F. Warren Group, Highland Tank & Manufacturing Company, Belding Tank Technologies, Inc, Plascore, Inc, Hughes Tank Company, ModuTank, Inc, ZCL | Xerxes
Key Drivers • The expanding elderly population, which is more prone to medical conditions that necessitate CT imaging.
• Continuous innovations in CT technology, such as improved image quality, reduced radiation exposure, and faster scanning times.
RESTRAINTS • The intricate nature of advanced CT systems can lead to difficulties in operation, maintenance, and the requirement for specialized training.
•  The substantial investment required for purchasing and maintaining advanced CT equipment can limit market growth.

Frequently Asked Questions

Ans- Computed Tomography Market was worth USD 5.79 billion in 2023 and is predicted to be worth USD 10.70 billion by 2032, growing at a CAGR of 7.13% between 2024 and 2032.

Ans- The CAGR of Computed Tomography Market during the forecast period is of 7.13% between 2024 and 2032.

Ans- In 2023, North America's computed tomography market held the largest share of 34.49%. and it is expected to continue its dominance throughout the forecast period.

Ans- The expanding elderly population, which is more prone to medical conditions that necessitate CT imaging.

Ans- Challenges in Computed Tomography Market are

  1. The intricate nature of advanced CT systems can lead to difficulties in operation, maintenance, and the requirement for specialized training.
  2. The substantial investment required for purchasing and maintaining advanced CT equipment can limit market growth.

Table of Contents

1. Introduction

1.1 Market Definition

1.2 Scope (Inclusion and Exclusions)

1.3 Research Assumptions

2. Executive Summary

2.1 Market Overview

2.2 Regional Synopsis

2.3 Competitive Summary

3. Research Methodology

3.1 Top-Down Approach

3.2 Bottom-up Approach

3.3. Data Validation

3.4 Primary Interviews

4. Market Dynamics Impact Analysis

4.1 Market Driving Factors Analysis

4.1.1 Drivers

4.1.2 Restraints

4.1.3 Opportunities

4.1.4 Challenges

4.2 PESTLE Analysis

4.3 Porter’s Five Forces Model

5. Statistical Insights and Trends Reporting

5.1 Incidence and Prevalence (2023)

5.2 Prescription Trends, (2023), by Region

5.3 Device Volume, by Region (2020-2032)

5.4 Healthcare Spending, by Region, (Government, Commercial, Private, Out-of-Pocket), 2023

6. Competitive Landscape

6.1 List of Major Companies, By Region

6.2 Market Share Analysis, By Region

6.3 Product Benchmarking

6.3.1 Product specifications and features

6.3.2 Pricing

6.4 Strategic Initiatives

6.4.1 Marketing and promotional activities

6.4.2 Distribution and supply chain strategies

6.4.3 Expansion plans and new product launches

6.4.4 Strategic partnerships and collaborations

6.5 Technological Advancements

6.6 Market Positioning and Branding

7. Computed Tomography Market Segmentation, By Technology

7.1 Chapter Overview

7.2 High-end Slice CT

7.2.1 High-end Slice CTMarket Trends Analysis (2020-2032)

7.2.2 High-end Slice CTMarket Size Estimates and Forecasts to 2032 (USD Billion)

7.3 Mid-end Slice CT

7.3.1 Mid-end Slice CTMarket Trends Analysis (2020-2032)

7.3.2 Mid-end Slice CTMarket Size Estimates and Forecasts to 2032 (USD Billion)


7.4 Low-end Slice CT

7.4.1 Low-end Slice CTMarket Trends Analysis (2020-2032)

7.4.2 Low-end Slice CTMarket Size Estimates and Forecasts to 2032 (USD Billion)

7.5 Cone Beam CT (CBCT)

7.5.1 Cone Beam CT (CBCT)Market Trends Analysis (2020-2032)

7.5.2 Cone Beam CT (CBCT)Market Size Estimates and Forecasts to 2032 (USD Billion)

8. Computed Tomography Market Segmentation, by Application

8.1 Chapter Overview

8.2 Oncology

8.2.1 Oncology Market Trends Analysis (2020-2032)

8.2.2 Oncology Market Size Estimates and Forecasts to 2032 (USD Billion)

8.3 Cardiology

8.3.1 Cardiology Market Trends Analysis (2020-2032)

8.3.2 Cardiology Market Size Estimates and Forecasts to 2032 (USD Billion)

8.4 Vascular

8.4.1 Vascular Market Trends Analysis (2020-2032)

8.4.2 Vascular Market Size Estimates and Forecasts to 2032 (USD Billion)

8.5 Neurology

8.5.1 Neurology Market Trends Analysis (2020-2032)

8.5.2 Neurology Market Size Estimates and Forecasts to 2032 (USD Billion)

8.6 Musculoskeletal

8.6.1 Musculoskeletal Market Trends Analysis (2020-2032)

8.6.2 Musculoskeletal Market Size Estimates and Forecasts to 2032 (USD Billion)

8.7 Others

8.7.1 Others Market Trends Analysis (2020-2032)

8.7.2 Others Market Size Estimates and Forecasts to 2032 (USD Billion)

9. Computed Tomography Market Segmentation, by End User

9.1 Chapter Overview

9.2 Hospitals

9.2.1 Hospitals Market Trends Analysis (2020-2032)

9.2.2 Hospitals Market Size Estimates and Forecasts to 2032 (USD Billion)

9.3 Diagnostic Imaging Centers

9.3.1 Diagnostic Imaging Centers Market Trends Analysis (2020-2032)

9.3.2 Diagnostic Imaging Centers Market Size Estimates and Forecasts to 2032 (USD Billion)

9.4 Others

               9.4.1 Others  Market Trends Analysis (2020-2032)

9.4.2 Others  Market Size Estimates and Forecasts to 2032 (USD Billion)

10. Regional Analysis

10.1 Chapter Overview

10.2 North America

10.2.1 Trends Analysis

10.2.2 North America Computed Tomography Market Estimates and Forecasts, by Country (2020-2032) (USD Billion)

10.2.3 North America Computed Tomography Market Estimates and Forecasts, Technology (2020-2032) (USD Billion)  

10.2.4 North America Computed Tomography Market Estimates and Forecasts, by Application (2020-2032) (USD Billion)

10.2.5 North America Computed Tomography Market Estimates and Forecasts, by End User (2020-2032) (USD Billion)

10.2.6 USA

10.2.6.1 USA Computed Tomography Market Estimates and Forecasts, Technology (2020-2032) (USD Billion)

10.2.6.2 USA Computed Tomography Market Estimates and Forecasts, by Application (2020-2032) (USD Billion)

10.2.6.3 USA Computed Tomography Market Estimates and Forecasts, by End User (2020-2032) (USD Billion)

10.2.7 Canada

10.2.7.1 Canada Computed Tomography Market Estimates and Forecasts, Technology (2020-2032) (USD Billion)

10.2.7.2 Canada Computed Tomography Market Estimates and Forecasts, by Application (2020-2032) (USD Billion)

10.2.7.3 Canada Computed Tomography Market Estimates and Forecasts, by End User (2020-2032) (USD Billion)

10.2.8 Mexico

10.2.8.1 Mexico Computed Tomography Market Estimates and Forecasts, Technology (2020-2032) (USD Billion)

10.2.8.2 Mexico Computed Tomography Market Estimates and Forecasts, by Application (2020-2032) (USD Billion)

10.2.8.3 Mexico Computed Tomography Market Estimates and Forecasts, by End User (2020-2032) (USD Billion)

10.3 Europe

10.3.1 Eastern Europe

10.3.1.1 Trends Analysis

10.3.1.2 Eastern Europe Computed Tomography Market Estimates and Forecasts, by Country (2020-2032) (USD Billion)

10.3.1.3 Eastern Europe Computed Tomography Market Estimates and Forecasts, Technology (2020-2032) (USD Billion)  

10.3.1.4 Eastern Europe Computed Tomography Market Estimates and Forecasts, by Application (2020-2032) (USD Billion)

10.3.1.5 Eastern Europe Computed Tomography Market Estimates and Forecasts, by End User (2020-2032) (USD Billion)

10.3.1.6 Poland

10.3.1.6.1 Poland Computed Tomography Market Estimates and Forecasts, Technology (2020-2032) (USD Billion)

10.3.1.6.2 Poland Computed Tomography Market Estimates and Forecasts, by Application (2020-2032) (USD Billion)

10.3.1.6.3 Poland Computed Tomography Market Estimates and Forecasts, by End User (2020-2032) (USD Billion)

10.3.1.7 Romania

10.3.1.7.1 Romania Computed Tomography Market Estimates and Forecasts, Technology (2020-2032) (USD Billion)

10.3.1.7.2 Romania Computed Tomography Market Estimates and Forecasts, by Application (2020-2032) (USD Billion)

10.3.1.7.3 Romania Computed Tomography Market Estimates and Forecasts, by End User (2020-2032) (USD Billion)

10.3.1.8 Hungary

10.3.1.8.1 Hungary Computed Tomography Market Estimates and Forecasts, Technology (2020-2032) (USD Billion)

10.3.1.8.2 Hungary Computed Tomography Market Estimates and Forecasts, by Application (2020-2032) (USD Billion)

10.3.1.8.3 Hungary Computed Tomography Market Estimates and Forecasts, by End User (2020-2032) (USD Billion)

10.3.1.9 Turkey

10.3.1.9.1 Turkey Computed Tomography Market Estimates and Forecasts, Technology (2020-2032) (USD Billion)

10.3.1.9.2 Turkey Computed Tomography Market Estimates and Forecasts, by Application (2020-2032) (USD Billion)

10.3.1.9.3 Turkey Computed Tomography Market Estimates and Forecasts, by End User (2020-2032) (USD Billion)

10.3.1.10 Rest of Eastern Europe

10.3.1.10.1 Rest of Eastern Europe Computed Tomography Market Estimates and Forecasts, Technology (2020-2032) (USD Billion)

10.3.1.10.2 Rest of Eastern Europe Computed Tomography Market Estimates and Forecasts, by Application (2020-2032) (USD Billion)

10.3.1.10.3 Rest of Eastern Europe Computed Tomography Market Estimates and Forecasts, by End User (2020-2032) (USD Billion)

10.3.2 Western Europe

10.3.2.1 Trends Analysis

10.3.2.2 Western Europe Computed Tomography Market Estimates and Forecasts, by Country (2020-2032) (USD Billion)

10.3.2.3 Western Europe Computed Tomography Market Estimates and Forecasts, Technology (2020-2032) (USD Billion)  

10.3.2.4 Western Europe Computed Tomography Market Estimates and Forecasts, by Application (2020-2032) (USD Billion)

10.3.2.5 Western Europe Computed Tomography Market Estimates and Forecasts, by End User (2020-2032) (USD Billion)

10.3.2.6 Germany

10.3.2.6.1 Germany Computed Tomography Market Estimates and Forecasts, Technology (2020-2032) (USD Billion)

10.3.2.6.2 Germany Computed Tomography Market Estimates and Forecasts, by Application (2020-2032) (USD Billion)

10.3.2.6.3 Germany Computed Tomography Market Estimates and Forecasts, by End User (2020-2032) (USD Billion)

10.3.2.7 France

10.3.2.7.1 France Computed Tomography Market Estimates and Forecasts, Technology (2020-2032) (USD Billion)

10.3.2.7.2 France Computed Tomography Market Estimates and Forecasts, by Application (2020-2032) (USD Billion)

10.3.2.7.3 France Computed Tomography Market Estimates and Forecasts, by End User (2020-2032) (USD Billion)

10.3.2.8 UK

10.3.2.8.1 UK Computed Tomography Market Estimates and Forecasts, Technology (2020-2032) (USD Billion)

10.3.2.8.2 UK Computed Tomography Market Estimates and Forecasts, by Application (2020-2032) (USD Billion)

10.3.2.8.3 UK Computed Tomography Market Estimates and Forecasts, by End User (2020-2032) (USD Billion)

10.3.2.9 Italy

10.3.2.9.1 Italy Computed Tomography Market Estimates and Forecasts, Technology (2020-2032) (USD Billion)

10.3.2.9.2 Italy Computed Tomography Market Estimates and Forecasts, by Application (2020-2032) (USD Billion)

10.3.2.9.3 Italy Computed Tomography Market Estimates and Forecasts, by End User (2020-2032) (USD Billion)

10.3.2.10 Spain

10.3.2.10.1 Spain Computed Tomography Market Estimates and Forecasts, Technology (2020-2032) (USD Billion)

10.3.2.10.2 Spain Computed Tomography Market Estimates and Forecasts, by Application (2020-2032) (USD Billion)

10.3.2.10.3 Spain Computed Tomography Market Estimates and Forecasts, by End User (2020-2032) (USD Billion)

10.3.2.11 Netherlands

10.3.2.11.1 Netherlands Computed Tomography Market Estimates and Forecasts, Technology (2020-2032) (USD Billion)

10.3.2.11.2 Netherlands Computed Tomography Market Estimates and Forecasts, by Application (2020-2032) (USD Billion)

10.3.2.11.3 Netherlands Computed Tomography Market Estimates and Forecasts, by End User (2020-2032) (USD Billion)

10.3.2.12 Switzerland

10.3.2.12.1 Switzerland Computed Tomography Market Estimates and Forecasts, Technology (2020-2032) (USD Billion)

10.3.2.12.2 Switzerland Computed Tomography Market Estimates and Forecasts, by Application (2020-2032) (USD Billion)

10.3.2.12.3 Switzerland Computed Tomography Market Estimates and Forecasts, by End User (2020-2032) (USD Billion)

10.3.2.13 Austria

10.3.2.13.1 Austria Computed Tomography Market Estimates and Forecasts, Technology (2020-2032) (USD Billion)

10.3.2.13.2 Austria Computed Tomography Market Estimates and Forecasts, by Application (2020-2032) (USD Billion)

10.3.2.13.3 Austria Computed Tomography Market Estimates and Forecasts, by End User (2020-2032) (USD Billion)

10.3.2.14 Rest of Western Europe

10.3.2.14.1 Rest of Western Europe Computed Tomography Market Estimates and Forecasts, Technology (2020-2032) (USD Billion)

10.3.2.14.2 Rest of Western Europe Computed Tomography Market Estimates and Forecasts, by Application (2020-2032) (USD Billion)

10.3.2.14.3 Rest of Western Europe Computed Tomography Market Estimates and Forecasts, by End User (2020-2032) (USD Billion)

10.4 Asia Pacific

10.4.1 Trends Analysis

10.4.2 Asia Pacific Computed Tomography Market Estimates and Forecasts, by Country (2020-2032) (USD Billion)

10.4.3 Asia Pacific Computed Tomography Market Estimates and Forecasts, Technology (2020-2032) (USD Billion)  

10.4.4 Asia Pacific Computed Tomography Market Estimates and Forecasts, by Application (2020-2032) (USD Billion)

10.4.5 Asia Pacific Computed Tomography Market Estimates and Forecasts, by End User (2020-2032) (USD Billion)

10.4.6 China

10.4.6.1 China Computed Tomography Market Estimates and Forecasts, Technology (2020-2032) (USD Billion)

10.4.6.2 China Computed Tomography Market Estimates and Forecasts, by Application (2020-2032) (USD Billion)

10.4.6.3 China Computed Tomography Market Estimates and Forecasts, by End User (2020-2032) (USD Billion)

10.4.7 India

10.4.7.1 India Computed Tomography Market Estimates and Forecasts, Technology (2020-2032) (USD Billion)

10.4.7.2 India Computed Tomography Market Estimates and Forecasts, by Application (2020-2032) (USD Billion)

10.4.7.3 India Computed Tomography Market Estimates and Forecasts, by End User (2020-2032) (USD Billion)

10.4.8 Japan

10.4.8.1 Japan Computed Tomography Market Estimates and Forecasts, Technology (2020-2032) (USD Billion)

10.4.8.2 Japan Computed Tomography Market Estimates and Forecasts, by Application (2020-2032) (USD Billion)

10.4.8.3 Japan Computed Tomography Market Estimates and Forecasts, by End User (2020-2032) (USD Billion)

10.4.9 South Korea

10.4.9.1 South Korea Computed Tomography Market Estimates and Forecasts, Technology (2020-2032) (USD Billion)

10.4.9.2 South Korea Computed Tomography Market Estimates and Forecasts, by Application (2020-2032) (USD Billion)

10.4.9.3 South Korea Computed Tomography Market Estimates and Forecasts, by End User (2020-2032) (USD Billion)

10.4.10 Vietnam

10.4.10.1 Vietnam Computed Tomography Market Estimates and Forecasts, Technology (2020-2032) (USD Billion)

10.4.10.2 Vietnam Computed Tomography Market Estimates and Forecasts, by Application (2020-2032) (USD Billion)

10.4.10.3 Vietnam Computed Tomography Market Estimates and Forecasts, by End User (2020-2032) (USD Billion)

10.4.11 Singapore

10.4.11.1 Singapore Computed Tomography Market Estimates and Forecasts, Technology (2020-2032) (USD Billion)

10.4.11.2 Singapore Computed Tomography Market Estimates and Forecasts, by Application (2020-2032) (USD Billion)

10.4.11.3 Singapore Computed Tomography Market Estimates and Forecasts, by End User (2020-2032) (USD Billion)

10.4.12 Australia

10.4.12.1 Australia Computed Tomography Market Estimates and Forecasts, Technology (2020-2032) (USD Billion)

10.4.12.2 Australia Computed Tomography Market Estimates and Forecasts, by Application (2020-2032) (USD Billion)

10.4.12.3 Australia Computed Tomography Market Estimates and Forecasts, by End User (2020-2032) (USD Billion)

10.4.13 Rest of Asia Pacific

10.4.13.1 Rest of Asia Pacific Computed Tomography Market Estimates and Forecasts, Technology (2020-2032) (USD Billion)

10.4.13.2 Rest of Asia Pacific Computed Tomography Market Estimates and Forecasts, by Application (2020-2032) (USD Billion)

10.4.13.3 Rest of Asia Pacific Computed Tomography Market Estimates and Forecasts, by End User (2020-2032) (USD Billion)

10.5 Middle East and Africa

10.5.1 Middle East

10.5.1.1 Trends Analysis

10.5.1.2 Middle East Computed Tomography Market Estimates and Forecasts, by Country (2020-2032) (USD Billion)

10.5.1.3 Middle East Computed Tomography Market Estimates and Forecasts, Technology (2020-2032) (USD Billion)  

10.5.1.4 Middle East Computed Tomography Market Estimates and Forecasts, by Application (2020-2032) (USD Billion)

10.5.1.5 Middle East Computed Tomography Market Estimates and Forecasts, by End User (2020-2032) (USD Billion)

10.5.1.6 UAE

10.5.1.6.1 UAE Computed Tomography Market Estimates and Forecasts, Technology (2020-2032) (USD Billion)

10.5.1.6.2 UAE Computed Tomography Market Estimates and Forecasts, by Application (2020-2032) (USD Billion)

10.5.1.6.3 UAE Computed Tomography Market Estimates and Forecasts, by End User (2020-2032) (USD Billion)

10.5.1.7 Egypt

10.5.1.7.1 Egypt Computed Tomography Market Estimates and Forecasts, Technology (2020-2032) (USD Billion)

10.5.1.7.2 Egypt Computed Tomography Market Estimates and Forecasts, by Application (2020-2032) (USD Billion)

10.5.1.7.3 Egypt Computed Tomography Market Estimates and Forecasts, by End User (2020-2032) (USD Billion)

10.5.1.8 Saudi Arabia

10.5.1.8.1 Saudi Arabia Computed Tomography Market Estimates and Forecasts, Technology (2020-2032) (USD Billion)

10.5.1.8.2 Saudi Arabia Computed Tomography Market Estimates and Forecasts, by Application (2020-2032) (USD Billion)

10.5.1.8.3 Saudi Arabia Computed Tomography Market Estimates and Forecasts, by End User (2020-2032) (USD Billion)

10.5.1.9 Qatar

10.5.1.9.1 Qatar Computed Tomography Market Estimates and Forecasts, Technology (2020-2032) (USD Billion)

10.5.1.9.2 Qatar Computed Tomography Market Estimates and Forecasts, by Application (2020-2032) (USD Billion)

10.5.1.9.3 Qatar Computed Tomography Market Estimates and Forecasts, by End User (2020-2032) (USD Billion)

10.5.1.10 Rest of Middle East

10.5.1.10.1 Rest of Middle East Computed Tomography Market Estimates and Forecasts, Technology (2020-2032) (USD Billion)

10.5.1.10.2 Rest of Middle East Computed Tomography Market Estimates and Forecasts, by Application (2020-2032) (USD Billion)

10.5.1.10.3 Rest of Middle East Computed Tomography Market Estimates and Forecasts, by End User (2020-2032) (USD Billion)

10.5.2 Africa

10.5.2.1 Trends Analysis

10.5.2.2 Africa Computed Tomography Market Estimates and Forecasts, by Country (2020-2032) (USD Billion)

10.5.2.3 Africa Computed Tomography Market Estimates and Forecasts, Technology (2020-2032) (USD Billion)  

10.5.2.4 Africa Computed Tomography Market Estimates and Forecasts, by Application (2020-2032) (USD Billion)

10.5.2.5 Africa Computed Tomography Market Estimates and Forecasts, by End User (2020-2032) (USD Billion)

10.5.2.6 South Africa

10.5.2.6.1 South Africa Computed Tomography Market Estimates and Forecasts, Technology (2020-2032) (USD Billion)

10.5.2.6.2 South Africa Computed Tomography Market Estimates and Forecasts, by Application (2020-2032) (USD Billion)

10.5.2.6.3 South Africa Computed Tomography Market Estimates and Forecasts, by End User (2020-2032) (USD Billion)

10.5.2.7 Nigeria

10.5.2.7.1 Nigeria Computed Tomography Market Estimates and Forecasts, Technology (2020-2032) (USD Billion)

10.5.2.7.2 Nigeria Computed Tomography Market Estimates and Forecasts, by Application (2020-2032) (USD Billion)

10.5.2.7.3 Nigeria Computed Tomography Market Estimates and Forecasts, by End User (2020-2032) (USD Billion)

10.5.2.8 Rest of Africa

10.5.2.8.1 Rest of Africa Computed Tomography Market Estimates and Forecasts, Technology (2020-2032) (USD Billion)

10.5.2.8.2 Rest of Africa Computed Tomography Market Estimates and Forecasts, by Application (2020-2032) (USD Billion)

10.5.2.8.3 Rest of Africa Computed Tomography Market Estimates and Forecasts, by End User (2020-2032) (USD Billion)

10.6 Latin America

10.6.1 Trends Analysis

10.6.2 Latin America Computed Tomography Market Estimates and Forecasts, by Country (2020-2032) (USD Billion)

10.6.3 Latin America Computed Tomography Market Estimates and Forecasts, Technology (2020-2032) (USD Billion)  

10.6.4 Latin America Computed Tomography Market Estimates and Forecasts, by Application (2020-2032) (USD Billion)

10.6.5 Latin America Computed Tomography Market Estimates and Forecasts, by End User (2020-2032) (USD Billion)

10.6.6 Brazil

10.6.6.1 Brazil Computed Tomography Market Estimates and Forecasts, Technology (2020-2032) (USD Billion)

10.6.6.2 Brazil Computed Tomography Market Estimates and Forecasts, by Application (2020-2032) (USD Billion)

10.6.6.3 Brazil Computed Tomography Market Estimates and Forecasts, by End User (2020-2032) (USD Billion)

10.6.7 Argentina

10.6.7.1 Argentina Computed Tomography Market Estimates and Forecasts, Technology (2020-2032) (USD Billion)

10.6.7.2 Argentina Computed Tomography Market Estimates and Forecasts, by Application (2020-2032) (USD Billion)

10.6.7.3 Argentina Computed Tomography Market Estimates and Forecasts, by End User (2020-2032) (USD Billion)

10.6.8 Colombia

10.6.8.1 Colombia Computed Tomography Market Estimates and Forecasts, Technology (2020-2032) (USD Billion)

10.6.8.2 Colombia Computed Tomography Market Estimates and Forecasts, by Application (2020-2032) (USD Billion)

10.6.8.3 Colombia Computed Tomography Market Estimates and Forecasts, by End User (2020-2032) (USD Billion)

10.6.9 Rest of Latin America

10.6.9.1 Rest of Latin America Computed Tomography Market Estimates and Forecasts, Technology (2020-2032) (USD Billion)

10.6.9.2 Rest of Latin America Computed Tomography Market Estimates and Forecasts, by Application (2020-2032) (USD Billion)

10.6.9.3 Rest of Latin America Computed Tomography Market Estimates and Forecasts, by End User (2020-2032) (USD Billion)


11. Company Profiles

11.1 Siemens Healthineers

11.1.1 Company Overview

11.1.2 Financial

11.1.3 Products/ Service Offered

11.1.4 SWOT Analysis

11.2 GE Healthcare 

             11.2.1 Company Overview

11.2.2 Financial

11.2.3 Products/ Service Offered

11.2.4 SWOT Analysis

11.3 Canon Medical Systems 

             11.3.1 Company Overview

11.3.2 Financial

11.3.3 Products/ Service Offered

11.3.4 SWOT Analysis

11.4 Philips Healthcare 

             11.4.1 Company Overview

11.4.2 Financial

11.4.3 Products/ Service Offered

11.4.4 SWOT Analysis

11.5 Hitachi Medical Systems

11.5.1 Company Overview

11.5.2 Financial

11.5.3 Products/ Service Offered

11.5.4 SWOT Analysis

11.6 Neusoft Medical Systems 

              11.6.1 Company Overview

11.6.2 Financial

11.6.3 Products/ Service Offered

11.6.4 SWOT Analysis


11.7 United Imaging Healthcare

11.7.1 Company Overview

11.7.2 Financial

11.7.3 Products/ Service Offered

11.7.4 SWOT Analysis

11.8 Samsung Neurologica

11.8.1 Company Overview

11.8.2 Financial

11.8.3 Products/ Service Offered

11.8.4 SWOT Analysis

11.9 Shenzhen Anke High-tech 

              11.9.1 Company Overview

11.9.2 Financial

11.9.3 Products/ Service Offered

11.9.4 SWOT Analysis

11.10 Planmed Oy 

              11.10.1 Company Overview

11.10.2 Financial

11.10.3 Products/ Service Offered

11.10.4 SWOT Analysis

12. Use Cases and Best Practices

13. Conclusion

An accurate research report requires proper strategizing as well as implementation. There are multiple factors involved in the completion of good and accurate research report and selecting the best methodology to compete the research is the toughest part. Since the research reports we provide play a crucial role in any company’s decision-making process, therefore we at SNS Insider always believe that we should choose the best method which gives us results closer to reality. This allows us to reach at a stage wherein we can provide our clients best and accurate investment to output ratio.

Each report that we prepare takes a timeframe of 350-400 business hours for production. Starting from the selection of titles through a couple of in-depth brain storming session to the final QC process before uploading our titles on our website we dedicate around 350 working hours. The titles are selected based on their current market cap and the foreseen CAGR and growth.


The 5 steps process:

Step 1: Secondary Research:

Secondary Research or Desk Research is as the name suggests is a research process wherein, we collect data through the readily available information. In this process we use various paid and unpaid databases which our team has access to and gather data through the same. This includes examining of listed companies’ annual reports, Journals, SEC filling etc. Apart from this our team has access to various associations across the globe across different industries. Lastly, we have exchange relationships with various university as well as individual libraries.

Secondary Research

Step 2: Primary Research

When we talk about primary research, it is a type of study in which the researchers collect relevant data samples directly, rather than relying on previously collected data.  This type of research is focused on gaining content specific facts that can be sued to solve specific problems. Since the collected data is fresh and first hand therefore it makes the study more accurate and genuine.

We at SNS Insider have divided Primary Research into 2 parts.

Part 1 wherein we interview the KOLs of major players as well as the upcoming ones across various geographic regions. This allows us to have their view over the market scenario and acts as an important tool to come closer to the accurate market numbers. As many as 45 paid and unpaid primary interviews are taken from both the demand and supply side of the industry to make sure we land at an accurate judgement and analysis of the market.

This step involves the triangulation of data wherein our team analyses the interview transcripts, online survey responses and observation of on filed participants. The below mentioned chart should give a better understanding of the part 1 of the primary interview.

Primary Research

Part 2: In this part of primary research the data collected via secondary research and the part 1 of the primary research is validated with the interviews from individual consultants and subject matter experts.

Consultants are those set of people who have at least 12 years of experience and expertise within the industry whereas Subject Matter Experts are those with at least 15 years of experience behind their back within the same space. The data with the help of two main processes i.e., FGDs (Focused Group Discussions) and IDs (Individual Discussions). This gives us a 3rd party nonbiased primary view of the market scenario making it a more dependable one while collation of the data pointers.

Step 3: Data Bank Validation

Once all the information is collected via primary and secondary sources, we run that information for data validation. At our intelligence centre our research heads track a lot of information related to the market which includes the quarterly reports, the daily stock prices, and other relevant information. Our data bank server gets updated every fortnight and that is how the information which we collected using our primary and secondary information is revalidated in real time.

Data Bank Validation

Step 4: QA/QC Process

After all the data collection and validation our team does a final level of quality check and quality assurance to get rid of any unwanted or undesired mistakes. This might include but not limited to getting rid of the any typos, duplication of numbers or missing of any important information. The people involved in this process include technical content writers, research heads and graphics people. Once this process is completed the title gets uploader on our platform for our clients to read it.

Step 5: Final QC/QA Process:

This is the last process and comes when the client has ordered the study. In this process a final QA/QC is done before the study is emailed to the client. Since we believe in giving our clients a good experience of our research studies, therefore, to make sure that we do not lack at our end in any way humanly possible we do a final round of quality check and then dispatch the study to the client.

Key Segments:

By Technology

  • High-end Slice CT

  • Mid-end Slice CT

  • Low-end Slice CT

  • Cone Beam CT (CBCT)

By Application

  • Oncology

  • Cardiology

  • Vascular

  • Neurology

  • Musculoskeletal

  • Others

By End-Use

  • Hospitals

  • Diagnostic Imaging Centers

  • Others

Request for Segment Customization as per your Business Requirement: Segment Customization Request

REGIONAL COVERAGE:

North America

  • US

  • Canada

  • Mexico

Europe

  • Eastern Europe

    • Poland

    • Romania

    • Hungary

    • Turkey

    • Rest of Eastern Europe

  • Western Europe

    • Germany

    • France

    • UK

    • Italy

    • Spain

    • Netherlands

    • Switzerland

    • Austria

    • Rest of Western Europe

Asia Pacific

  • China

  • India

  • Japan

  • South Korea

  • Vietnam

  • Singapore

  • Australia

  • Rest of Asia Pacific

Middle East & Africa

  • Middle East

    • UAE

    • Egypt

    • Saudi Arabia

    • Qatar

    • Rest of the Middle East

  • Africa

    • Nigeria

    • South Africa

    • Rest of Africa

Latin America

  • Brazil

  • Argentina

  • Colombia

  • Rest of Latin America

Request for Country Level Research Report: Country Level Customization Request

Available Customization

With the given market data, SNS Insider offers customization as per the company’s specific needs. The following customization options are available for the report:

  • Product Analysis

  • Criss-Cross segment analysis (e.g. Product X Application)

  • Product Matrix which gives a detailed comparison of product portfolio of each company

  • Geographic Analysis

  • Additional countries in any of the regions

  • Company Information

  • Detailed analysis and profiling of additional market players (Up to five)


  •            5000 (33% Discount)


  •            8950 (40% Discount)


  •            3050 (23% Discount)

Start a Conversation

Hi! Click one of our member below to chat on Phone