image

COMPUTATIONAL PHOTOGRAPHY MARKET KEY INSIGHTS:

Computational Photography Market,Revenue Analysis

To Get More Information on Computational Photography Market - Request Sample Report

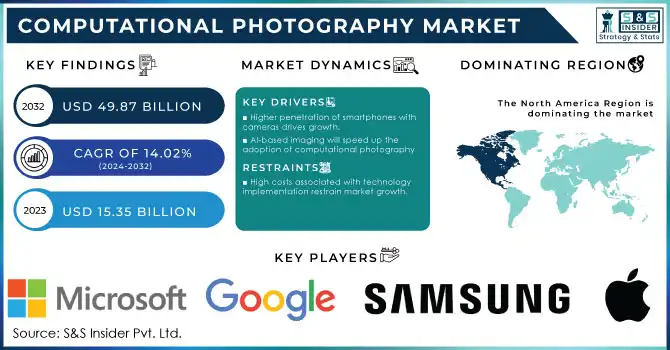
The Computational Photography Market Size was valued at USD 15.35 Billion in 2023 and is expected to reach USD 49.87 Billion by 2032 and grow at a CAGR of 14.02% over the forecast period 2024-2032.

Rapid advancement in the Computational Photography market is due to the rapidly emerging image processing technologies and AI-based improvements. The emerging domain integrates computer vision, artificial intelligence, and advanced imaging algorithms to make images that go far beyond traditional photography capabilities. One of the major driving factors propelling this growth is the high penetration of smartphones with sophisticated camera technology. This broader availability of such photography features in consumer devices has made them rather democratized to access higher-quality images. In 2023, the estimated penetration rate of mobile phones in the global market was around 69%, or about 6.7 billion subscriptions for smartphones worldwide against a total world population of about 7.4 billion. This does draw attention to the size of the user base subscribing to better computational photography features built into mobile devices.
Beside cellular phones, other technologies that have been heavily advanced include standalone cameras and machine vision applications. The technologies are now significant in the healthcare, automotive, and industrial automation industries. In the healthcare industry, quality enhancement in diagnosis images through machine vision cameras helps achieve a higher quality in images. In the automotive industry, they are used in driver-assistance systems that work in very high accuracy conditions. The advantage of machine vision in industrial fields comes from the fact that the inspection process is automated through computation imaging enhancing accuracy and productivity.

Other impacts include adoption in the AR/VR experiences, augmented reality, and social media channels, which have seen significant contributions to growth. They involve sophisticated image processing for more immersive and realistic user experiences; therefore, an enormous amount of research and investment is indispensable. The demand for superior imaging quality is a never-ending trend as users continue to share content on these social media platforms and use AR-based tools.

MARKET DYNAMICS

KEY DRIVERS  

  1. Higher penetration of smartphones with cameras drives growth.

Smartphones, by virtue of their high camera capacities, are one of the primary drivers in the computational photography space. Mobile photography has become highly pertinent, with features such as HDR, Night Mode, portrait improvements, and real-time image processing. These functionalities depend on intricate computational processes that sequentially filter several frames and then put them together to construct an image better than any one of the filtered frames. Though, across Sub-Saharan Africa, the smartphone penetration is only at 55% up to the end of 2023, in North America, and Europe, the same, rests somewhere around 86% and 82% respectively in a humongous user base.

These high adoption rates are stoking consumer demand for cameras that perform truly exceptional in a wide range of conditions. The growth in social media engagement and immediate sharing of quality photographs and videos further perpetuates this trend. More consumers are using camera specifications as a major consideration in the purchase of their smartphone, leading to investments in research and development to achieve further boundaries of computational photography, make the user experience better, and reinforce growth in market share.

  1.  AI-based imaging will speed up the adoption of computational photography

Computational photography underwent tremendous changes in the use of artificial intelligence, which propagated the spread of AI-based imaging technology. Common features include scene recognition, automatic exposure adjustments, and AI-based image correction, all there to give the photo a high quality with minimal user interference. According to data from the National Institute of Standards and Technology, AI technologies increase productivity by as much as 40% in image-related fields.

With integration, devices can regulate settings automatically according to lighting, object recognition, and user preference, achieving ideal results. For example, in the healthcare sector, the use of AI-enabled machine vision cameras in diagnostic imaging is of significant benefit. Automotive sectors employ it to build driver-assist systems. The ability to produce sharper images with higher resolution depth perception and color accuracy also makes for a plausible reason for consumer as well as industrial applications. This has underlined the role AI plays in driving the growth of computational photography technology across different domains.

RESTRAIN

  1. High costs associated with technology implementation restrain market growth.

Even as the computational photography market grows, the high costs that are associated with developing and implementing advanced imaging technology remain a critical challenge. High-end hardware and software development call for considerable resources that are mainly accessible to few devices, thereby hindering adoption. Such innovations in the form of AI processors, custom ISPs, and real-time image processing units can highly invest in R&D. Smaller companies and firms in developing regions sometimes cannot implement such technologies into their products due to these funds. For example, according to the data by the European Commission, funding is a barrier to many SMEs in various technology sectors.

The International Finance Corporation estimates that 65 million firms, or 40% of all formal MSMEs in developing countries, lack financing, equivalent to USD 5.2 trillion annually-a cost barrier that goes not only to device manufacturers but also to end-users who may consider such advanced devices to be out of reach at such costs. In addition to that, the exponential growth of technology requires companies that are keen and prepared to invest to continually update their products so as not to miss the competition. This is costly. After subsidizing or joining forces, the above prohibitive cost factors will minimize this constraint and thus expand the extent of participation.

KEY MARKET SEGMENTS

BY PRODUCT

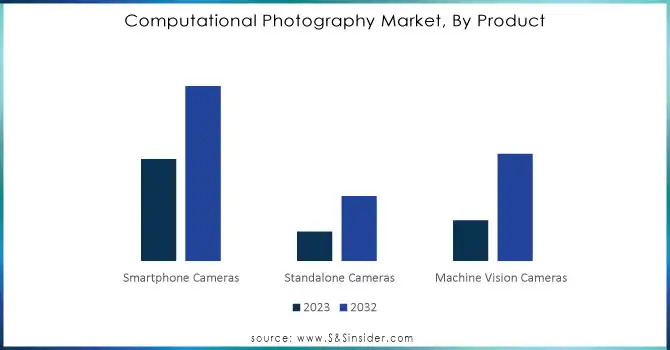
Smartphone Camera captured 51% of the market share in 2023. This aspect of leadership is given through a seamless embedding of cutting-edge technologies, such as multi-frame synthesis, AI-driven upgrades, and optical zoom capabilities, in the smartphone. This makes consumer preferences shift towards devices that offer such professional photography capabilities but in a compact form. For instance, in 2023, the shipments of smart devices from Samsung became approximately 226.5 million around the world. The next is the Apple brand in the list of being the largest smartphone producing company in the world. In 2023, the company shipped more than 232 million iPhones all over the world. The constant developments on mobile camera modules among the tech giants have ensured that camera-equipped smartphones remain a hot product in the market.

The Smartphone Cameras will spearhead the market in terms of growth with the highest CAGR of 14.13% during the forecast period 2024-2032, attributed to continuous innovation through AI, augmented reality capabilities, and computational power.

Standalone cameras are still niche markets due to continued relevance for some users requiring higher resolutions for professional photography or videography applications.
Computational-Photography-Market-By-Product

Do You Need any Customization Research on Computational Photography Market - Inquire Now

BY APPLICATION

3D Imaging with 41% of the market share in 2023 depicted its major role in industries as broad as healthcare to entertainment. This segment will continue to grow at a healthy rate, fueled by requirements for enhanced visuals and the requirement for high-definition imaging, especially in professional services that require medical imaging based on 3D models.

Moreover, 3D Imaging is expected to grow at the fastest CAGR of 14.34% during the forecast period of 2024-2032 due to technological development in creating higher depth and resolution. Augmented reality and mixed reality increased its application areas in gaming, education, and retail thereby demanding the high-quality imaging in that market. While VR and MR applications continue to evolve, AR has found a solid footing in consumer electronics to enhance interactive experiences from smartphones to smart glasses.

Each application area leverages capabilities of computational photography, improving visual fidelity that leads to increased interaction and real-world usability. What is creating the future of the computational photography market is the trend towards mixed-use applications, blending AR, VR, and 3D imaging. Continuous innovation and adoption are expected to define the future of the computational photography market. There is significant regional variation in growth and adoption in the computational photography market.

REGIONAL ANALYSIS

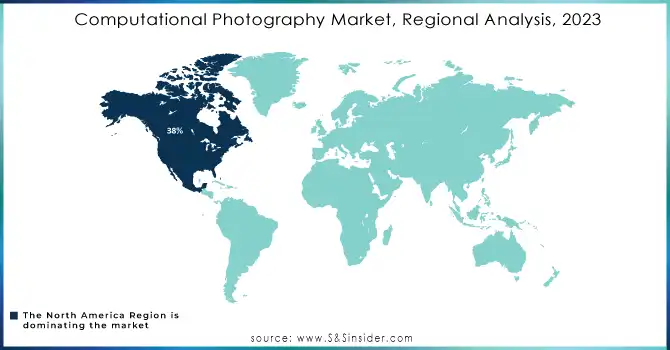
North America held a 38% market share in 2023, primarily due to the high concentration of major tech giants and robust R&D capabilities in the region. Advanced imaging technology has penetrated nearly every type of consumer electronics in this region. Within smartphones and standalone cameras, the U.S. saw robust demand for those features installed with computational photography.

The Asia Pacific market is forecasted to grow at a CAGR of 14.97% during the forecast period 2024-2032. Growth is mainly attributed to prominent factors such as smartphone penetration, growing disposable incomes, and developments in the infrastructure for technology in countries such as China, India, and South Korea. Government efforts toward digital innovation and technological advance further accelerate the rapid expansion of the region. The region's competitive manufacturing landscape coupled with significant investments in AI and machine vision technologies are further expected to support the growth of the Asia Pacific market.
Computational-Photography-Market-Regional-Analysis-2023

KEY PLAYERS

Some of the major players in the Computational Photography Market are 

  • Apple Inc. (iPhone Cameras, iPad Cameras)

  • Samsung Electronics Co., Ltd. (Galaxy Cameras, Smart Camera Solutions)

  • Google LLC (Pixel Cameras, ARCore)

  • Huawei Technologies Co., Ltd. (P Series Cameras, Image Processing Software)

  • Sony Corporation (Alpha Cameras, Image Sensors)

  • Canon Inc. (EOS Cameras, Imaging Software)

  • Nikon Corporation (Z Series Cameras, Image Editing Software)

  • Xiaomi Corporation (Redmi Cameras, MIUI Camera Apps)

  • Oppo (Find Series Cameras, Image Enhancement Software)

  • LG Electronics Inc. (V Series Cameras, Optical Solutions)

  • Microsoft Corporation (HoloLens Cameras, AI Imaging Tools)

  • Panasonic Corporation (Lumix Cameras, Machine Vision Cameras)

  • Fujifilm Holdings Corporation (X Series Cameras, Photo Processing Software)

  • Leica Camera AG (M Series Cameras, Optics)

  • Olympus Corporation (OM-D Cameras, Imaging Equipment)

  • Intel Corporation (RealSense Cameras, Vision Processing Units)

  • Qualcomm Technologies, Inc. (Snapdragon Image Signal Processors, AI Solutions)

  • Adobe Systems Incorporated (Lightroom, Photoshop)

  • HTC Corporation (Vive Cameras, AR/VR Solutions)

  • GoPro, Inc. (HERO Cameras, Editing Software)

MAJOR SUPPLIERS (Components, Technologies)

  • Sony Semiconductor Solutions Corporation

  • ON Semiconductor

  • STMicroelectronics

  • Samsung Foundry

  • TSMC (Taiwan Semiconductor Manufacturing Company)

  • ASE Group (Advanced Semiconductor Engineering)

  • Texas Instruments

  • LG Chem

  • Corning Inc.

  • Sumitomo Electric Industries

  • AMS AG

  • Murata Manufacturing Co., Ltd.

  • Broadcom Inc.

  • Analog Devices, Inc.

  • Toshiba Corporation

  • Micron Technology

  • NXP Semiconductors

  • Infineon Technologies AG

  • Renesas Electronics Corporation

  • Applied Materials, Inc.

MAJOR CLIENTS

  • Apple Inc.: Telecom carriers, Retail chains

  • Samsung Electronics: Mobile service providers, Consumer electronics stores

  • Google LLC: AR/VR companies, App developers

  • Huawei Technologies: Mobile carriers, E-commerce platforms

  • Sony Corporation: Photography professionals, Media companies

  • Canon Inc.: Photography retailers, Printing services

  • Nikon Corporation: Camera shops, Professional photographers

  • Xiaomi Corporation: Online marketplaces, Retail electronics stores

  • Oppo: Distributors, Telecom operators

  • LG Electronics: AR/VR companies, Consumer electronics outlets

  • Microsoft Corporation: Tech developers, AR/VR startups

  • Panasonic Corporation: Industrial automation companies, Medical imaging providers

  • Fujifilm Holdings Corporation: Photography services, Laboratories

  • Leica Camera AG: Professional photographers, High-end camera shops

  • Olympus Corporation: Medical device manufacturers, Scientific research institutions

  • Intel Corporation: Tech startups, Robotics firms

  • Qualcomm Technologies: Smartphone manufacturers, IoT solution providers

  • Adobe Systems: Creative agencies, Marketing firms

  • HTC Corporation: Gaming companies, VR solution providers

  • GoPro, Inc.: Sports retailers, Travel and adventure companies

RECENT TRENDS

  • November 2023: Insta360 unveiled the Ace and Ace Pro, the two new action cameras co-engineered with Leica, in development, to truly promise users spectacular image quality, backed by the fusion of hardware and computational photography, driven by artificial intelligence. The flagship Ace Pro hosts what Insta360 refers to as an industry-first Type 1/1.3 image sensor, which shoots video at up to 8K at 24 fps and captures 4K at 120 fps, and it is able to capture 48-megapixel photos as well. It also brings in a "vlogging-friendly" 2.4-inch flip touchscreen providing live preview and camera control.

  • November 2023: OPPO and Hasselblad had already announced its three-year partnership was going to bring out the sequel to HyperTone Camera Systems in 2024. The announcement came at Paris Photo 2023 and marked an important step forward in OPPO and Hasselblad's relationship, which began with Find X5 series. Breaking down features into solutions planning and meticulous tuning, OPPO pioneers a groundbreaking system ushering the new era of computational photography.

Computational Photography Market Report Scope:

Report Attributes Details
Market Size in 2023 US$ 15.35 Billion
Market Size by 2032 US$ 49.87 Billion
CAGR CAGR of 14.02 % From 2024 to 2032
Base Year 2023
Forecast Period 2024-2032
Historical Data 2020-2022
Report Scope & Coverage Market Size, Segments Analysis, Competitive  Landscape, Regional Analysis, DROC & SWOT Analysis, Forecast Outlook
Key Segments • By Offering (Camera Module, Software),
• By Type (Single- And Dual-Lens Camera, 16- Lens Camera, Others),
• By Product (Smartphone Cameras, Standalone Cameras, Machine Vision Cameras),
• By Application (3D Imaging, Virtual Reality, Augmented Reality, Mixed Reality)
Regional Analysis/Coverage North America (US, Canada, Mexico), Europe (Eastern Europe [Poland, Romania, Hungary, Turkey, Rest of Eastern Europe] Western Europe] Germany, France, UK, Italy, Spain, Netherlands, Switzerland, Austria, Rest of Western Europe]), Asia Pacific (China, India, Japan, South Korea, Vietnam, Singapore, Australia, Rest of Asia Pacific), Middle East & Africa (Middle East [UAE, Egypt, Saudi Arabia, Qatar, Rest of Middle East], Africa [Nigeria, South Africa, Rest of Africa], Latin America (Brazil, Argentina, Colombia, Rest of Latin America)
Company Profiles Apple Inc., Samsung Electronics Co., Ltd., Google LLC, Huawei Technologies Co., Ltd., Sony Corporation, Canon Inc., Nikon Corporation, Xiaomi Corporation, Oppo, LG Electronics Inc., Microsoft Corporation, Panasonic Corporation, Fujifilm Holdings Corporation, Leica Camera AG, Olympus Corporation, Intel Corporation, Qualcomm Technologies, Inc., Adobe Systems Incorporated, HTC Corporation, GoPro, Inc.
Key Drivers
  • Higher penetration of smartphones with cameras drives growth.

  • AI-based imaging will speed up the adoption of computational photography

Restraints
  • High costs associated with technology implementation restrain market growth.

Frequently Asked Questions

Ans: The Computational Photography Market is expected to grow at a CAGR of 14.02% during 2024-2032.

Ans: Computational Photography Market size was USD 15.35 Billion in 2023 and is expected to Reach USD 49.87 Billion by 2032.

Ans: The major growth factors of the Computational Photography Market are Higher Penetration of Smartphones and AI-based Imaging.

Ans: The Smartphone Camera segment dominated the Computational Photography Market.

Ans: North America dominated the Computational Photography Market in 2023.

TABLE OF CONTENTS

1. Introduction

1.1 Market Definition

1.2 Scope (Inclusion and Exclusions)

1.3 Research Assumptions

2. Executive Summary

2.1 Market Overview

2.2 Regional Synopsis

2.3 Competitive Summary

3. Research Methodology

3.1 Top-Down Approach

3.2 Bottom-up Approach

3.3. Data Validation

3.4 Primary Interviews

4. Market Dynamics Impact Analysis

4.1 Market Driving Factors Analysis

4.1.1 Drivers

4.1.2 Restraints

4.1.3 Opportunities

4.1.4 Challenges

4.2 PESTLE Analysis

4.3 Porter’s Five Forces Model

5. Statistical Insights and Trends Reporting

5.1 Feature Analysis, 2023

5.2 User Demographics, 2023

5.3 Integration Capabilities, by Software, 2023

5.4 Impact on Decision-making

6. Competitive Landscape

6.1 List of Major Companies, By Region

6.2 Market Share Analysis, By Region

6.3 Product Benchmarking

6.3.1 Product specifications and features

6.3.2 Pricing

6.4 Strategic Initiatives

6.4.1 Marketing and promotional activities

6.4.2 Distribution and supply chain strategies

6.4.3 Expansion plans and new product launches

6.4.4 Strategic partnerships and collaborations

6.5 Technological Advancements

6.6 Market Positioning and Branding

7. Computational Photography Market Segmentation, By Offering

7.1 Chapter Overview

7.2 Camera Module

7.2.1 Camera Module Market Trends Analysis (2020-2032)

7.2.2 Camera Module Market Size Estimates and Forecasts to 2032 (USD Billion)

7.3 Software

7.3.1 Software Market Trends Analysis (2020-2032)

7.3.2 Software Market Size Estimates and Forecasts to 2032 (USD Billion)

8. Computational Photography Market Segmentation, By Application

8.1 Chapter Overview

8.2 3D Imaging

8.2.1 3D Imaging Market Trends Analysis (2020-2032)

8.2.2 3D Imaging Market Size Estimates and Forecasts to 2032 (USD Billion)

8.3 Virtual Reality

8.3.1 Virtual Reality Market Trends Analysis (2020-2032)

8.3.2 Virtual Reality Market Size Estimates and Forecasts to 2032 (USD Billion)

8.4 Augmented Reality

8.4.1 Augmented Reality Market Trends Analysis (2020-2032)

8.4.2 Augmented Reality Market Size Estimates and Forecasts to 2032 (USD Billion)

8.5 Mixed Reality

8.5.1 Mixed Reality Market Trends Analysis (2020-2032)

8.5.2 Mixed Reality Market Size Estimates and Forecasts to 2032 (USD Billion)

9. Computational Photography Market Segmentation, By Type

9.1 Chapter Overview

9.2 Single- And Dual-Lens Camera

9.2.1 Single- And Dual-Lens Camera Market Trends Analysis (2020-2032)

9.2.2 Single- And Dual-Lens Camera Market Size Estimates and Forecasts to 2032 (USD Billion)

9.3 16- Lens Camera

9.3.1 16- Lens Camera Market Trends Analysis (2020-2032)

9.3.2 16- Lens Camera Market Size Estimates and Forecasts to 2032 (USD Billion)

9.4 Others

              9.4.1 Others Market Trends Analysis (2020-2032)

9.4.2 Others Market Size Estimates and Forecasts to 2032 (USD Billion)

10. Computational Photography Market Segmentation, By Product

10.1 Chapter Overview

10.2 Smartphone Cameras

10.2.1 Smartphone Cameras Market Trends Analysis (2020-2032)

10.2.2 Smartphone Cameras Market Size Estimates and Forecasts to 2032 (USD Billion)

10.3 Standalone Cameras

10.3.1 Standalone Cameras Market Trends Analysis (2020-2032)

10.3.2 Standalone Cameras Market Size Estimates and Forecasts to 2032 (USD Billion)

10.4 Machine Vision Cameras

10.4.1 Machine Vision Cameras Market Trends Analysis (2020-2032)

10.4.2 Machine Vision Cameras Market Size Estimates and Forecasts to 2032 (USD Billion)

11. Regional Analysis

11.1 Chapter Overview

11.2 North America

11.2.1 Trends Analysis

11.2.2 North America Computational Photography Market Estimates and Forecasts, by Country (2020-2032) (USD Billion)

11.2.3 North America Computational Photography Market Estimates and Forecasts, By Offering (2020-2032) (USD Billion

11.2.4 North America Computational Photography Market Estimates and Forecasts, by Application (2020-2032) (USD Billion)

11.2.5 North America Computational Photography Market Estimates and Forecasts, By Type (2020-2032) (USD Billion)

11.2.6 North America Computational Photography Market Estimates and Forecasts, By Product (2020-2032) (USD Billion)

11.2.7 USA

11.2.7.1 USA Computational Photography Market Estimates and Forecasts, By Offering (2020-2032) (USD Billion)

11.2.7.2 USA Computational Photography Market Estimates and Forecasts, by Application (2020-2032) (USD Billion)

11.2.7.3 USA Computational Photography Market Estimates and Forecasts, By Type (2020-2032) (USD Billion)

11.2.7.4 USA Computational Photography Market Estimates and Forecasts, By Product (2020-2032) (USD Billion)

11.2.8 Canada

11.2.8.1 Canada Computational Photography Market Estimates and Forecasts, By Offering (2020-2032) (USD Billion)

11.2.8.2 Canada Computational Photography Market Estimates and Forecasts, by Application (2020-2032) (USD Billion)

11.2.8.3 Canada Computational Photography Market Estimates and Forecasts, By Type (2020-2032) (USD Billion)

11.2.8.4 Canada Computational Photography Market Estimates and Forecasts, By Product (2020-2032) (USD Billion)

11.2.9 Mexico

11.2.9.1 Mexico Computational Photography Market Estimates and Forecasts, By Offering (2020-2032) (USD Billion)

11.2.9.2 Mexico Computational Photography Market Estimates and Forecasts, by Application (2020-2032) (USD Billion)

11.2.9.3 Mexico Computational Photography Market Estimates and Forecasts, By Type (2020-2032) (USD Billion)

11.2.9.4 Mexico Computational Photography Market Estimates and Forecasts, By Product (2020-2032) (USD Billion)

11.3 Europe

11.3.1 Eastern Europe

11.3.1.1 Trends Analysis

11.3.1.2 Eastern Europe Computational Photography Market Estimates and Forecasts, by Country (2020-2032) (USD Billion)

11.3.1.3 Eastern Europe Computational Photography Market Estimates and Forecasts, By Offering (2020-2032) (USD Billion

11.3.1.4 Eastern Europe Computational Photography Market Estimates and Forecasts, by Application (2020-2032) (USD Billion)

11.3.1.5 Eastern Europe Computational Photography Market Estimates and Forecasts, By Type (2020-2032) (USD Billion)

11.3.1.6 Eastern Europe Computational Photography Market Estimates and Forecasts, By Product (2020-2032) (USD Billion)

11.3.1.7 Poland

11.3.1.7.1 Poland Computational Photography Market Estimates and Forecasts, By Offering (2020-2032) (USD Billion)

11.3.1.7.2 Poland Computational Photography Market Estimates and Forecasts, by Application (2020-2032) (USD Billion)

11.3.1.7.3 Poland Computational Photography Market Estimates and Forecasts, By Type (2020-2032) (USD Billion)

11.3.1.7.4 Poland Computational Photography Market Estimates and Forecasts, By Product (2020-2032) (USD Billion)

11.3.1.8 Romania

11.3.1.8.1 Romania Computational Photography Market Estimates and Forecasts, By Offering (2020-2032) (USD Billion)

11.3.1.8.2 Romania Computational Photography Market Estimates and Forecasts, by Application (2020-2032) (USD Billion)

11.3.1.8.3 Romania Computational Photography Market Estimates and Forecasts, By Type (2020-2032) (USD Billion)

11.3.1.8.4 Romania Computational Photography Market Estimates and Forecasts, By Product (2020-2032) (USD Billion)

11.3.1.9 Hungary

11.3.1.9.1 Hungary Computational Photography Market Estimates and Forecasts, By Offering (2020-2032) (USD Billion)

11.3.1.9.2 Hungary Computational Photography Market Estimates and Forecasts, by Application (2020-2032) (USD Billion)

11.3.1.9.3 Hungary Computational Photography Market Estimates and Forecasts, By Type (2020-2032) (USD Billion)

11.3.1.9.4 Hungary Computational Photography Market Estimates and Forecasts, By Product (2020-2032) (USD Billion)

11.3.1.10 Turkey

11.3.1.10.1 Turkey Computational Photography Market Estimates and Forecasts, By Offering (2020-2032) (USD Billion)

11.3.1.10.2 Turkey Computational Photography Market Estimates and Forecasts, by Application (2020-2032) (USD Billion)

11.3.1.10.3 Turkey Computational Photography Market Estimates and Forecasts, By Type (2020-2032) (USD Billion)

11.3.1.10.4 Turkey Computational Photography Market Estimates and Forecasts, By Product (2020-2032) (USD Billion)

11.3.1.11 Rest of Eastern Europe

11.3.1.11.1 Rest of Eastern Europe Computational Photography Market Estimates and Forecasts, By Offering (2020-2032) (USD Billion)

11.3.1.11.2 Rest of Eastern Europe Computational Photography Market Estimates and Forecasts, by Application (2020-2032) (USD Billion)

11.3.1.11.3 Rest of Eastern Europe Computational Photography Market Estimates and Forecasts, By Type (2020-2032) (USD Billion)

11.3.1.11.4 Rest of Eastern Europe Computational Photography Market Estimates and Forecasts, By Product (2020-2032) (USD Billion)

11.3.2 Western Europe

11.3.2.1 Trends Analysis

11.3.2.2 Western Europe Computational Photography Market Estimates and Forecasts, by Country (2020-2032) (USD Billion)

11.3.2.3 Western Europe Computational Photography Market Estimates and Forecasts, By Offering (2020-2032) (USD Billion

11.3.2.4 Western Europe Computational Photography Market Estimates and Forecasts, by Application (2020-2032) (USD Billion)

11.3.2.5 Western Europe Computational Photography Market Estimates and Forecasts, By Type (2020-2032) (USD Billion)

11.3.2.6 Western Europe Computational Photography Market Estimates and Forecasts, By Product (2020-2032) (USD Billion)

11.3.2.7 Germany

11.3.2.7.1 Germany Computational Photography Market Estimates and Forecasts, By Offering (2020-2032) (USD Billion)

11.3.2.7.2 Germany Computational Photography Market Estimates and Forecasts, by Application (2020-2032) (USD Billion)

11.3.2.7.3 Germany Computational Photography Market Estimates and Forecasts, By Type (2020-2032) (USD Billion)

11.3.2.7.4 Germany Computational Photography Market Estimates and Forecasts, By Product (2020-2032) (USD Billion)

11.3.2.8 France

11.3.2.8.1 France Computational Photography Market Estimates and Forecasts, By Offering (2020-2032) (USD Billion)

11.3.2.8.2 France Computational Photography Market Estimates and Forecasts, by Application (2020-2032) (USD Billion)

11.3.2.8.3 France Computational Photography Market Estimates and Forecasts, By Type (2020-2032) (USD Billion)

11.3.2.8.4 France Computational Photography Market Estimates and Forecasts, By Product (2020-2032) (USD Billion)

11.3.2.9 UK

11.3.2.9.1 UK Computational Photography Market Estimates and Forecasts, By Offering (2020-2032) (USD Billion)

11.3.2.9.2 UK Computational Photography Market Estimates and Forecasts, by Application (2020-2032) (USD Billion)

11.3.2.9.3 UK Computational Photography Market Estimates and Forecasts, By Type (2020-2032) (USD Billion)

11.3.2.9.4 UK Computational Photography Market Estimates and Forecasts, By Product (2020-2032) (USD Billion)

11.3.2.10 Italy

11.3.2.10.1 Italy Computational Photography Market Estimates and Forecasts, By Offering (2020-2032) (USD Billion)

11.3.2.10.2 Italy Computational Photography Market Estimates and Forecasts, by Application (2020-2032) (USD Billion)

11.3.2.10.3 Italy Computational Photography Market Estimates and Forecasts, By Type (2020-2032) (USD Billion)

11.3.2.10.4 Italy Computational Photography Market Estimates and Forecasts, By Product (2020-2032) (USD Billion)

11.3.2.11 Spain

11.3.2.11.1 Spain Computational Photography Market Estimates and Forecasts, By Offering (2020-2032) (USD Billion)

11.3.2.11.2 Spain Computational Photography Market Estimates and Forecasts, by Application (2020-2032) (USD Billion)

11.3.2.11.3 Spain Computational Photography Market Estimates and Forecasts, By Type (2020-2032) (USD Billion)

11.3.2.11.4 Spain Computational Photography Market Estimates and Forecasts, By Product (2020-2032) (USD Billion)

11.3.2.12 Netherlands

11.3.2.12.1 Netherlands Computational Photography Market Estimates and Forecasts, By Offering (2020-2032) (USD Billion)

11.3.2.12.2 Netherlands Computational Photography Market Estimates and Forecasts, by Application (2020-2032) (USD Billion)

11.3.2.12.3 Netherlands Computational Photography Market Estimates and Forecasts, By Type (2020-2032) (USD Billion)

11.3.2.12.4 Netherlands Computational Photography Market Estimates and Forecasts, By Product (2020-2032) (USD Billion)

11.3.2.13 Switzerland

11.3.2.13.1 Switzerland Computational Photography Market Estimates and Forecasts, By Offering (2020-2032) (USD Billion)

11.3.2.13.2 Switzerland Computational Photography Market Estimates and Forecasts, by Application (2020-2032) (USD Billion)

11.3.2.13.3 Switzerland Computational Photography Market Estimates and Forecasts, By Type (2020-2032) (USD Billion)

11.3.2.13.4 Switzerland Computational Photography Market Estimates and Forecasts, By Product (2020-2032) (USD Billion)

11.3.2.14 Austria

11.3.2.14.1 Austria Computational Photography Market Estimates and Forecasts, By Offering (2020-2032) (USD Billion)

11.3.2.14.2 Austria Computational Photography Market Estimates and Forecasts, by Application (2020-2032) (USD Billion)

11.3.2.14.3 Austria Computational Photography Market Estimates and Forecasts, By Type (2020-2032) (USD Billion)

11.3.2.14.4 Austria Computational Photography Market Estimates and Forecasts, By Product (2020-2032) (USD Billion)

11.3.2.15 Rest of Western Europe

11.3.2.15.1 Rest of Western Europe Computational Photography Market Estimates and Forecasts, By Offering (2020-2032) (USD Billion)

11.3.2.15.2 Rest of Western Europe Computational Photography Market Estimates and Forecasts, by Application (2020-2032) (USD Billion)

11.3.2.15.3 Rest of Western Europe Computational Photography Market Estimates and Forecasts, By Type (2020-2032) (USD Billion)

11.3.2.15.4 Rest of Western Europe Computational Photography Market Estimates and Forecasts, By Product (2020-2032) (USD Billion)

11.4 Asia Pacific

11.4.1 Trends Analysis

11.4.2 Asia Pacific Computational Photography Market Estimates and Forecasts, by Country (2020-2032) (USD Billion)

11.4.3 Asia Pacific Computational Photography Market Estimates and Forecasts, By Offering (2020-2032) (USD Billion

11.4.4 Asia Pacific Computational Photography Market Estimates and Forecasts, by Application (2020-2032) (USD Billion)

11.4.5 Asia Pacific Computational Photography Market Estimates and Forecasts, By Type (2020-2032) (USD Billion)

11.4.6 Asia Pacific Computational Photography Market Estimates and Forecasts, By Product (2020-2032) (USD Billion)

11.4.7 China

11.4.7.1 China Computational Photography Market Estimates and Forecasts, By Offering (2020-2032) (USD Billion)

11.4.7.2 China Computational Photography Market Estimates and Forecasts, by Application (2020-2032) (USD Billion)

11.4.7.3 China Computational Photography Market Estimates and Forecasts, By Type (2020-2032) (USD Billion)

11.4.7.4 China Computational Photography Market Estimates and Forecasts, By Product (2020-2032) (USD Billion)

11.4.8 India

11.4.8.1 India Computational Photography Market Estimates and Forecasts, By Offering (2020-2032) (USD Billion)

11.4.8.2 India Computational Photography Market Estimates and Forecasts, by Application (2020-2032) (USD Billion)

11.4.8.3 India Computational Photography Market Estimates and Forecasts, By Type (2020-2032) (USD Billion)

11.4.8.4 India Computational Photography Market Estimates and Forecasts, By Product (2020-2032) (USD Billion)

11.4.9 Japan

11.4.9.1 Japan Computational Photography Market Estimates and Forecasts, By Offering (2020-2032) (USD Billion)

11.4.9.2 Japan Computational Photography Market Estimates and Forecasts, by Application (2020-2032) (USD Billion)

11.4.9.3 Japan Computational Photography Market Estimates and Forecasts, By Type (2020-2032) (USD Billion)

11.4.9.4 Japan Computational Photography Market Estimates and Forecasts, By Product (2020-2032) (USD Billion)

11.4.10 South Korea

11.4.10.1 South Korea Computational Photography Market Estimates and Forecasts, By Offering (2020-2032) (USD Billion)

11.4.10.2 South Korea Computational Photography Market Estimates and Forecasts, by Application (2020-2032) (USD Billion)

11.4.10.3 South Korea Computational Photography Market Estimates and Forecasts, By Type (2020-2032) (USD Billion)

11.4.10.4 South Korea Computational Photography Market Estimates and Forecasts, By Product (2020-2032) (USD Billion)

11.4.11 Vietnam

11.4.11.1 Vietnam Computational Photography Market Estimates and Forecasts, By Offering (2020-2032) (USD Billion)

11.4.11.2 Vietnam Computational Photography Market Estimates and Forecasts, by Application (2020-2032) (USD Billion)

11.4.11.3 Vietnam Computational Photography Market Estimates and Forecasts, By Type (2020-2032) (USD Billion)

11.4.11.4 Vietnam Computational Photography Market Estimates and Forecasts, By Product (2020-2032) (USD Billion)

11.4.12 Singapore

11.4.12.1 Singapore Computational Photography Market Estimates and Forecasts, By Offering (2020-2032) (USD Billion)

11.4.12.2 Singapore Computational Photography Market Estimates and Forecasts, by Application (2020-2032) (USD Billion)

11.4.12.3 Singapore Computational Photography Market Estimates and Forecasts, By Type (2020-2032) (USD Billion)

11.4.12.4 Singapore Computational Photography Market Estimates and Forecasts, By Product (2020-2032) (USD Billion)

11.4.13 Australia

11.4.13.1 Australia Computational Photography Market Estimates and Forecasts, By Offering (2020-2032) (USD Billion)

11.4.13.2 Australia Computational Photography Market Estimates and Forecasts, by Application (2020-2032) (USD Billion)

11.4.13.3 Australia Computational Photography Market Estimates and Forecasts, By Type (2020-2032) (USD Billion)

11.4.13.4 Australia Computational Photography Market Estimates and Forecasts, By Product (2020-2032) (USD Billion)

11.4.14 Rest of Asia Pacific

11.4.14.1 Rest of Asia Pacific Computational Photography Market Estimates and Forecasts, By Offering (2020-2032) (USD Billion)

11.4.14.2 Rest of Asia Pacific Computational Photography Market Estimates and Forecasts, by Application (2020-2032) (USD Billion)

11.4.14.3 Rest of Asia Pacific Computational Photography Market Estimates and Forecasts, By Type (2020-2032) (USD Billion)

11.4.14.4 Rest of Asia Pacific Computational Photography Market Estimates and Forecasts, By Product (2020-2032) (USD Billion)

11.5 Middle East and Africa

11.5.1 Middle East

11.5.1.1 Trends Analysis

11.5.1.2 Middle East Computational Photography Market Estimates and Forecasts, by Country (2020-2032) (USD Billion)

11.5.1.3 Middle East Computational Photography Market Estimates and Forecasts, By Offering (2020-2032) (USD Billion

11.5.1.4 Middle East Computational Photography Market Estimates and Forecasts, by Application (2020-2032) (USD Billion)

11.5.1.5 Middle East Computational Photography Market Estimates and Forecasts, By Type (2020-2032) (USD Billion)

11.5.1.6 Middle East Computational Photography Market Estimates and Forecasts, By Product (2020-2032) (USD Billion)

11.5.1.7 UAE

11.5.1.7.1 UAE Computational Photography Market Estimates and Forecasts, By Offering (2020-2032) (USD Billion)

11.5.1.7.2 UAE Computational Photography Market Estimates and Forecasts, by Application (2020-2032) (USD Billion)

11.5.1.7.3 UAE Computational Photography Market Estimates and Forecasts, By Type (2020-2032) (USD Billion)

11.5.1.7.4 UAE Computational Photography Market Estimates and Forecasts, By Product  (2020-2032) (USD Billion)

11.5.1.8 Egypt

11.5.1.8.1 Egypt Computational Photography Market Estimates and Forecasts, By Offering (2020-2032) (USD Billion)

11.5.1.8.2 Egypt Computational Photography Market Estimates and Forecasts, by Application (2020-2032) (USD Billion)

11.5.1.8.3 Egypt Computational Photography Market Estimates and Forecasts, By Type (2020-2032) (USD Billion)

11.5.1.8.4 Egypt Computational Photography Market Estimates and Forecasts, By Product (2020-2032) (USD Billion)

11.5.1.9 Saudi Arabia

11.5.1.9.1 Saudi Arabia Computational Photography Market Estimates and Forecasts, By Offering (2020-2032) (USD Billion)

11.5.1.9.2 Saudi Arabia Computational Photography Market Estimates and Forecasts, by Application (2020-2032) (USD Billion)

11.5.1.9.3 Saudi Arabia Computational Photography Market Estimates and Forecasts, By Type (2020-2032) (USD Billion)

11.5.1.9.4 Saudi Arabia Computational Photography Market Estimates and Forecasts, By Product (2020-2032) (USD Billion)

11.5.1.10 Qatar

11.5.1.10.1 Qatar Computational Photography Market Estimates and Forecasts, By Offering (2020-2032) (USD Billion)

11.5.1.10.2 Qatar Computational Photography Market Estimates and Forecasts, by Application (2020-2032) (USD Billion)

11.5.1.10.3 Qatar Computational Photography Market Estimates and Forecasts, By Type (2020-2032) (USD Billion)

11.5.1.10.4 Qatar Computational Photography Market Estimates and Forecasts, By Product (2020-2032) (USD Billion)

11.5.1.11 Rest of Middle East

11.5.1.11.1 Rest of Middle East Computational Photography Market Estimates and Forecasts, By Offering (2020-2032) (USD Billion)

11.5.1.11.2 Rest of Middle East Computational Photography Market Estimates and Forecasts, by Application (2020-2032) (USD Billion)

11.5.1.11.3 Rest of Middle East Computational Photography Market Estimates and Forecasts, By Type (2020-2032) (USD Billion)

11.5.1.11.4 Rest of Middle East Computational Photography Market Estimates and Forecasts, By Product (2020-2032) (USD Billion)

11.5.2 Africa

11.5.2.1 Trends Analysis

11.5.2.2 Africa Computational Photography Market Estimates and Forecasts, by Country (2020-2032) (USD Billion)

11.5.2.3 Africa Computational Photography Market Estimates and Forecasts, By Offering (2020-2032) (USD Billion

11.5.2.4 Africa Computational Photography Market Estimates and Forecasts, by Application (2020-2032) (USD Billion)

11.5.2.5 Africa Computational Photography Market Estimates and Forecasts, By Type (2020-2032) (USD Billion)

11.5.2.6 Africa Computational Photography Market Estimates and Forecasts, By Product (2020-2032) (USD Billion)

11.5.2.7 South Africa

11.5.2.7.1 South Africa Computational Photography Market Estimates and Forecasts, By Offering (2020-2032) (USD Billion)

11.5.2.7.2 South Africa Computational Photography Market Estimates and Forecasts, by Application (2020-2032) (USD Billion)

11.5.2.7.3 South Africa Computational Photography Market Estimates and Forecasts, By Type (2020-2032) (USD Billion)

11.5.2.7.4 South Africa Computational Photography Market Estimates and Forecasts, By Product (2020-2032) (USD Billion)

11.5.2.8 Nigeria

11.5.2.8.1 Nigeria Computational Photography Market Estimates and Forecasts, By Offering (2020-2032) (USD Billion)

11.5.2.8.2 Nigeria Computational Photography Market Estimates and Forecasts, by Application (2020-2032) (USD Billion)

11.5.2.8.3 Nigeria Computational Photography Market Estimates and Forecasts, By Type (2020-2032) (USD Billion)

11.5.2.8.4 Nigeria Computational Photography Market Estimates and Forecasts, By Product (2020-2032) (USD Billion)

11.5.2.9 Rest of Africa

11.5.2.9.1 Rest of Africa Computational Photography Market Estimates and Forecasts, By Offering (2020-2032) (USD Billion)

11.5.2.9.2 Rest of Africa Computational Photography Market Estimates and Forecasts, by Application (2020-2032) (USD Billion)

11.5.2.9.3 Rest of Africa Computational Photography Market Estimates and Forecasts, By Type (2020-2032) (USD Billion)

11.5.2.9.4 Rest of Africa Computational Photography Market Estimates and Forecasts, By Product (2020-2032) (USD Billion)

11.6 Latin America

11.6.1 Trends Analysis

11.6.2 Latin America Computational Photography Market Estimates and Forecasts, by Country (2020-2032) (USD Billion)

11.6.3 Latin America Computational Photography Market Estimates and Forecasts, By Offering (2020-2032) (USD Billion

11.6.4 Latin America Computational Photography Market Estimates and Forecasts, by Application (2020-2032) (USD Billion)

11.6.5 Latin America Computational Photography Market Estimates and Forecasts, By Type (2020-2032) (USD Billion)

11.6.6 Latin America Computational Photography Market Estimates and Forecasts, By Product (2020-2032) (USD Billion)

11.6.7 Brazil

11.6.7.1 Brazil Computational Photography Market Estimates and Forecasts, By Offering (2020-2032) (USD Billion)

11.6.7.2 Brazil Computational Photography Market Estimates and Forecasts, by Application (2020-2032) (USD Billion)

11.6.7.3 Brazil Computational Photography Market Estimates and Forecasts, By Type (2020-2032) (USD Billion)

11.6.7.4 Brazil Computational Photography Market Estimates and Forecasts, By Product (2020-2032) (USD Billion)

11.6.8 Argentina

11.6.8.1 Argentina Computational Photography Market Estimates and Forecasts, By Offering (2020-2032) (USD Billion)

11.6.8.2 Argentina Computational Photography Market Estimates and Forecasts, by Application (2020-2032) (USD Billion)

11.6.8.3 Argentina Computational Photography Market Estimates and Forecasts, By Type (2020-2032) (USD Billion)

11.6.8.4 Argentina Computational Photography Market Estimates and Forecasts, By Product (2020-2032) (USD Billion)

11.6.9 Colombia

11.6.9.1 Colombia Computational Photography Market Estimates and Forecasts, By Offering (2020-2032) (USD Billion)

11.6.9.2 Colombia Computational Photography Market Estimates and Forecasts, by Application (2020-2032) (USD Billion)

11.6.9.3 Colombia Computational Photography Market Estimates and Forecasts, By Type (2020-2032) (USD Billion)

11.6.9.4 Colombia Computational Photography Market Estimates and Forecasts, By Product (2020-2032) (USD Billion)

11.6.10 Rest of Latin America

11.6.10.1 Rest of Latin America Computational Photography Market Estimates and Forecasts, By Offering (2020-2032) (USD Billion)

11.6.10.2 Rest of Latin America Computational Photography Market Estimates and Forecasts, by Application (2020-2032) (USD Billion)

11.6.10.3 Rest of Latin America Computational Photography Market Estimates and Forecasts, By Type (2020-2032) (USD Billion)

11.6.10.4 Rest of Latin America Computational Photography Market Estimates and Forecasts, By Product (2020-2032) (USD Billion)

12. Company Profiles

12.1 Apple Inc.

12.1.1 Company Overview

12.1.2 Financial

12.1.3 Products/ Services Offered

12.1.4 SWOT Analysis

12.2 Samsung Electronics Co., Ltd.

12.2.1 Company Overview

12.2.2 Financial

12.2.3 Products/ Services Offered

12.2.4 SWOT Analysis

12.3 Google LLC

12.3.1 Company Overview

12.3.2 Financial

12.3.3 Products/ Services Offered

12.3.4 SWOT Analysis

12.4 Huawei Technologies Co., Ltd.

12.4.1 Company Overview

12.4.2 Financial

12.4.3 Products/ Services Offered

12.4.4 SWOT Analysis

12.5 Sony Corporation

12.5.1 Company Overview

12.5.2 Financial

12.5.3 Products/ Services Offered

12.5.4 SWOT Analysis

12.6 Canon Inc.

12.6.1 Company Overview

12.6.2 Financial

12.6.3 Products/ Services Offered

12.6.4 SWOT Analysis

12.7 Nikon Corporation

12.7.1 Company Overview

12.7.2 Financial

12.7.3 Products/ Services Offered

12.7.4 SWOT Analysis

12.8 Oppo

12.8.1 Company Overview

12.8.2 Financial

12.8.3 Products/ Services Offered

12.8.4 SWOT Analysis

12.9 LG Electronics Inc.

12.9.1 Company Overview

12.9.2 Financial

12.9.3 Products/ Services Offered

12.9.4 SWOT Analysis

12.10 Xiaomi Corporation

12.10.1 Company Overview

12.10.2 Financial

12.10.3 Products/ Services Offered

12.10.4 SWOT Analysis

13. Use Cases and Best Practices

14. Conclusion

An accurate research report requires proper strategizing as well as implementation. There are multiple factors involved in the completion of good and accurate research report and selecting the best methodology to compete the research is the toughest part. Since the research reports we provide play a crucial role in any company’s decision-making process, therefore we at SNS Insider always believe that we should choose the best method which gives us results closer to reality. This allows us to reach at a stage wherein we can provide our clients best and accurate investment to output ratio.

Each report that we prepare takes a timeframe of 350-400 business hours for production. Starting from the selection of titles through a couple of in-depth brain storming session to the final QC process before uploading our titles on our website we dedicate around 350 working hours. The titles are selected based on their current market cap and the foreseen CAGR and growth.


The 5 steps process:

Step 1: Secondary Research:

Secondary Research or Desk Research is as the name suggests is a research process wherein, we collect data through the readily available information. In this process we use various paid and unpaid databases which our team has access to and gather data through the same. This includes examining of listed companies’ annual reports, Journals, SEC filling etc. Apart from this our team has access to various associations across the globe across different industries. Lastly, we have exchange relationships with various university as well as individual libraries.

Secondary Research

Step 2: Primary Research

When we talk about primary research, it is a type of study in which the researchers collect relevant data samples directly, rather than relying on previously collected data.  This type of research is focused on gaining content specific facts that can be sued to solve specific problems. Since the collected data is fresh and first hand therefore it makes the study more accurate and genuine.

We at SNS Insider have divided Primary Research into 2 parts.

Part 1 wherein we interview the KOLs of major players as well as the upcoming ones across various geographic regions. This allows us to have their view over the market scenario and acts as an important tool to come closer to the accurate market numbers. As many as 45 paid and unpaid primary interviews are taken from both the demand and supply side of the industry to make sure we land at an accurate judgement and analysis of the market.

This step involves the triangulation of data wherein our team analyses the interview transcripts, online survey responses and observation of on filed participants. The below mentioned chart should give a better understanding of the part 1 of the primary interview.

Primary Research

Part 2: In this part of primary research the data collected via secondary research and the part 1 of the primary research is validated with the interviews from individual consultants and subject matter experts.

Consultants are those set of people who have at least 12 years of experience and expertise within the industry whereas Subject Matter Experts are those with at least 15 years of experience behind their back within the same space. The data with the help of two main processes i.e., FGDs (Focused Group Discussions) and IDs (Individual Discussions). This gives us a 3rd party nonbiased primary view of the market scenario making it a more dependable one while collation of the data pointers.

Step 3: Data Bank Validation

Once all the information is collected via primary and secondary sources, we run that information for data validation. At our intelligence centre our research heads track a lot of information related to the market which includes the quarterly reports, the daily stock prices, and other relevant information. Our data bank server gets updated every fortnight and that is how the information which we collected using our primary and secondary information is revalidated in real time.

Data Bank Validation

Step 4: QA/QC Process

After all the data collection and validation our team does a final level of quality check and quality assurance to get rid of any unwanted or undesired mistakes. This might include but not limited to getting rid of the any typos, duplication of numbers or missing of any important information. The people involved in this process include technical content writers, research heads and graphics people. Once this process is completed the title gets uploader on our platform for our clients to read it.

Step 5: Final QC/QA Process:

This is the last process and comes when the client has ordered the study. In this process a final QA/QC is done before the study is emailed to the client. Since we believe in giving our clients a good experience of our research studies, therefore, to make sure that we do not lack at our end in any way humanly possible we do a final round of quality check and then dispatch the study to the client.

KEY MARKET SEGMENTATION

BY OFFERING

  • Camera Module

  • Software

BY TYPE

  • Single- And Dual-Lens Camera

  • 16-Lens Camera

  • Others

BY PRODUCT

  • Smartphone Cameras

  • Standalone Cameras

  • Machine Vision Cameras

BY APPLICATION

  • 3D Imaging

  • Virtual Reality

  • Augmented Reality

  • Mixed Reality

Request for Segment Customization as per your Business Requirement: Segment Customization Request


REGIONAL COVERAGE:

North America

  • US

  • Canada

  • Mexico

Europe

  • Eastern Europe

    • Poland

    • Romania

    • Hungary

    • Turkey

    • Rest of Eastern Europe

  • Western Europe

    • Germany

    • France

    • UK

    • Italy

    • Spain

    • Netherlands

    • Switzerland

    • Austria

    • Rest of Western Europe

Asia Pacific

  • China

  • India

  • Japan

  • South Korea

  • Vietnam

  • Singapore

  • Australia

  • Rest of Asia Pacific

Middle East & Africa

  • Middle East

    • UAE

    • Egypt

    • Saudi Arabia

    • Qatar

    • Rest of the Middle East

  • Africa

    • Nigeria

    • South Africa

    • Rest of Africa

Latin America

  • Brazil

  • Argentina

  • Colombia

  • Rest of Latin America

Request for Country Level Research Report: Country Level Customization Request

Available Customization

With the given market data, SNS Insider offers customization as per the company’s specific needs. The following customization options are available for the report:

  • Product Analysis

  • Criss-Cross segment analysis (e.g. Product X Application)

  • Product Matrix which gives a detailed comparison of product portfolio of each company

  • Geographic Analysis

  • Additional countries in any of the regions

  • Company Information

  • Detailed analysis and profiling of additional market players (Up to five)


  •            5000 (33% Discount)


  •            8950 (40% Discount)


  •            3050 (23% Discount)

Start a Conversation

Hi! Click one of our member below to chat on Phone