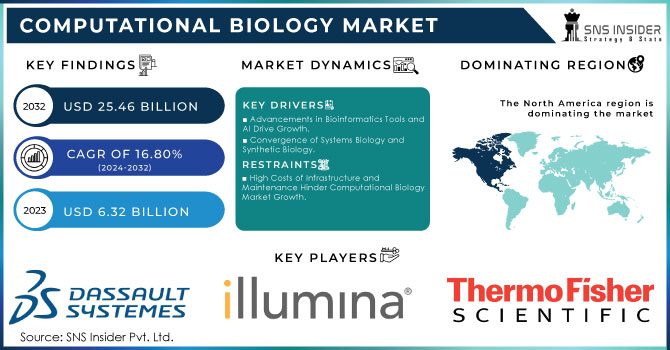
The Computational Biology Market size was valued at USD 6.32 Billion in 2023 and is projected to reach USD 25.46 Billion by 2032, growing at a 16.80% CAGR from 2024-2032.
Get More Information on Computational Biology Market - Request Sample Report
The computational biology market has gained significant traction in recent years as advancements in technology, big data analytics, and biological research converge to offer powerful tools for understanding complex biological systems. Computational biology has greatly transformed genetic data analysis in genomics, becoming one of its most significant applications. Genomics is crucial in oncology research, utilized in 65% of cancer studies, and in identifying rare diseases, 80% of which are genetically linked. The genomics workforce in the U.S. is growing at a projected annual rate of 12% to keep up with the increasing need for experts. Significant financial support, such as USD 3.5 billion from the National Institutes of Health (NIH) and USD 1.5 billion for the All of Us Research Program, showcases the government's dedication to genomics. Around, 90% of hospitals in the United States are incorporating precision medicine, which utilizes genomic data, and the global precision medicine market is worth USD 65.85 billion with the U.S. leading the way. The popularity of genetic testing is increasing, with 10% of American adults having been tested in 2022. The capacity to sequence complete genomes and interpret vast quantities of data has created new opportunities for comprehending the genetic foundation of diseases, evolutionary biology, and human growth. Computational tools enable the discovery of genetic mutations linked to illnesses, resulting in improved diagnosis and customized treatment strategies.
Computational biology has revolutionized the pharmaceutical industry in drug discovery by accelerating the identification of potential drug candidates and forecasting their impacts on human health. Conventional drug discovery techniques are frequently long and expensive, while computational methods can rapidly assess the composition of biological substances and predict the interactions of new compounds with them. This greatly diminishes the necessity for expensive laboratory experiments and trials. Additionally, computational biology allows for the examination of biological pathways and networks to find potential drug targets, providing new approaches for treating complicated illnesses such as cancer, neurodegenerative disorders, and autoimmune diseases. In addition, computational models help researchers forecast the impact of changes in one section of a biological system on other sections, facilitating the creation of specific treatments.
Drivers
Advancements in Bioinformatics Tools and AI Drive Growth.
Progress in bioinformatics software and algorithms has been crucial in the expansion of the computational biology industry. The demand for accurate and effective analysis of biological data has dramatically increased as datasets from genomics, proteomics, and systems biology have become larger and more complex. The creation of advanced bioinformatics tools like BLAST and software packages such as Bioconductor has allowed researchers to effectively analyze extensive biological datasets. Machine learning and artificial intelligence (AI) play a crucial role in analyzing intricate biological systems, enhancing prediction models, and aiding in the comprehension of diseases on a molecular scale. AI is used to improve computational models for predicting drug interactions, protein folding, and genetic sequencing, resulting in quicker and more precise outcomes. In addition, improvements in computing capabilities, such as cloud computing, have simplified the analysis of large datasets for organizations and researchers, leading to significant savings in time and resources. Advancements like next-generation sequencing (NGS) have generated large volumes of data, resulting in the need for sophisticated bioinformatics tools to analyze and understand this data.
Convergence of Systems Biology and Synthetic Biology.
Systems biology, which focuses on examining the relationships among different biological elements like DNA, RNA, proteins, and cells, has become increasingly popular in recent times. Computational biology is essential in systems biology because it offers the necessary tools for simulating intricate biological processes. These models aid researchers in grasping the interactions between various biological systems, providing an understanding of disease mechanisms and possible targets for therapy. In the same way, computational biology plays a vital role in synthetic biology, which entails creating and manipulating biological systems for practical reasons. Computational models are utilized to create synthetic biological systems, forecasting how they will act, and enhancing their efficiency. The increasing enthusiasm for utilizing synthetic biology in fields such as biofuels, agriculture, and pharmaceuticals is fueling the need for computational biology tools. The merging of systems biology and synthetic biology is likely to create new opportunities for research and advancement, especially in gene editing, metabolic engineering, and biomanufacturing fields.
Restraints
High Costs of Infrastructure and Maintenance Hinder Computational Biology Market Growth.
The significant obstacle to the expansion of the computational biology market is the expensive setup and maintenance of computational infrastructure. Sophisticated bioinformatics software and algorithms demand significant computational capacity, typically utilizing high-performance computing (HPC) systems, cloud infrastructure, and extensive data storage solutions. Obtaining and maintaining these systems can be too costly for smaller organizations and research institutions. The requirement for specialized hardware, custom software, and skilled personnel to manage and operate the systems further exacerbates this financial burden. Despite offering scalable and cost-efficient computing resources, many organizations still face challenges regarding the enduring expenses linked to storing and processing large quantities of data. These costs can significantly hinder the use of computational biology technologies in smaller institutions and impede overall market expansion. Finding solutions that are budget-friendly is essential to enable a broader range of organizations to access advanced computational biology tools and overcome this obstacle.
By Service
The software platforms segment held a market share of 40% in 2023. These platforms offer necessary resources for analyzing, modeling, and simulating biological data. They allow researchers to carry out extensive studies in genomics, proteomics, and drug discovery, proving essential for a range of uses like molecular modeling, sequence analysis, and systems biology. The rapid progress of personalized medicine and the increasing complexity of biological data have led to a surge in the need for bioinformatics tools and platforms. Some examples are Thermo Fisher Scientific's "Ion Torrent Software Suite" for genomic analysis and Illumina’s BaseSpace for bioinformatics in the cloud.
The databases sector is to become the fastest-growing segment during 2024-2032, due to the rise in biological data generation in the Computational Biology Market. There is a demand for organized data storage and retrieval systems to handle large volumes of information due to advances in next-generation sequencing (NGS) and genomics. Biological databases help in sharing, annotating, and analyzing data in different areas like genomics, proteomics, and systems biology. GenBank and EMBL-EBI both offer services for nucleotide and protein sequences, respectively.
By End-User
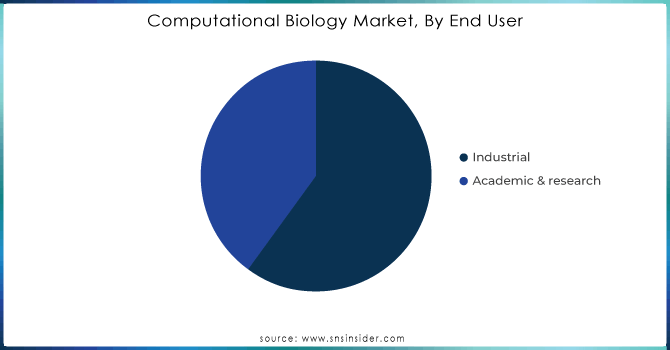
The industrial sector dominated the segment in 2023 with 59.88% market share, fueled by the increasing adoption of computational methods in pharmaceuticals, biotechnology, and healthcare. Computational biology plays a crucial role in drug design, clinical trials, and predictive modeling, resulting in a substantial decrease in the time and cost needed to introduce new drugs to the market. Pharmaceutical firms such as Pfizer and Roche utilize computational biology to improve drug discovery processes, study genetic differences, and forecast patient reactions to treatments. Moreover, biotech companies are incorporating computational techniques to enhance efficiency in tasks like protein modification and molecular modeling.
The academic & research is accounted to have a significant growth rate during the forecast period. Driven by the rising use of computational tools in biological research, this segment is currently the most dominant. Universities and research institutions utilize computational biology for genomics, proteomics, and bioinformatics research, leading to progress in personalized medicine, drug discovery, and disease modeling. As the amount of biological data increases rapidly, scientists are increasingly using computational techniques to analyze intricate datasets, which helps speed up research and cut down on expenses. For example, Thermo Fisher Scientific offers bioinformatics platforms and software for academic use.
Need any customization research on Computational Biology Market - Enquiry Now
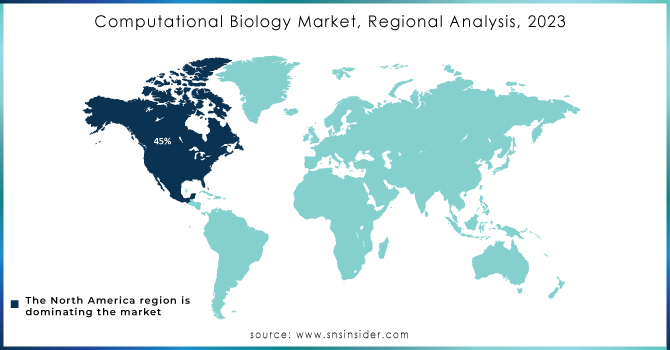
North America led the market in 2023 with a 45% market share due to significant investments in research and development, the presence of leading biotech and pharma firms, and top-notch healthcare facilities. The universities and research institutions in the area, especially in the United States, play a crucial role in driving progress in computational biology areas like genomics, drug discovery, and personalized medicine. Thermo Fisher Scientific and IBM Watson Health are leading in the use of computational biology for drug discovery and data analysis. Government funding supports the rise of precision medicine initiatives, strengthening the region's dominance.
The Asia-Pacific region is going to be the fastest-growing region during the forecast period 2024-2032, because of increasing healthcare investments, expanding biotechnology industries, and greater use of computational techniques in research. Nations such as China, India, and Japan are quickly enhancing their pharmaceutical and bioinformatics capacities, leading to an increase in market expansion. Research institutions in APAC are partnering with international companies to speed up progress in drug discovery and disease modeling. WuXi AppTec in China and Infosys in India are growing their computational biology offerings, with a focus on genomics, molecular dynamics, and bioinformatics services.
F. Hoffmann-La Roche Ltd – Bioinformatics and computational biology tools
Illumina, Inc. – Sequencing and bioinformatics software
Thermo Fisher Scientific, Inc. – Computational biology tools and services
Dassault Systèmes – BIOVIA
Genedata AG – Genedata Biopharma Platform, including Screener, Expressionist, Selector, Biologics, Profiler, Bioprocess, Chromatics
Chemical Computing Group – Molecular modeling software
Schrödinger, Inc. – LiveDesign, PyMOL
Certara, Inc. – Biosimulation software
Insilico Medicine – AI-driven drug discovery platforms
Nimbus Therapeutics – Computational drug discovery platforms
Compugen Ltd. – Computational discovery platforms
GNS Healthcare – AI-driven precision medicine solutions
Evotec SE – Computational drug discovery solutions
Genomatica, Inc. – Computational biology-based industrial biotech solutions
3BioMed – Computational biology applications in biomedicine
June 2023: Illumina, a major genomics company, extended the capabilities of TruSight Oncology 500 assay, a comprehensive genomic profiling solution. The latter has now received integration with computational biology algorithms for promoting a higher degree of cancer variant detection. As a result, the Drug Discovery & Disease Modelling and planning of oncological treatment become more accurate.
April 2023: Insitro, a biotechnological company, has released a novel computational platform for finding therapies for Non-Alcoholic Steatohepatitis. The flagship platform employs advanced machine learning applications to recreate simulation of disease progression with the help of computational biology. This approach ensures an acceleration of the research aimed at finding a cure for NASH.
| Report Attributes | Details |
|---|---|
| Market Size in 2023 | USD 6.32 Billion |
| Market Size by 2032 | USD 15.46 Billion |
| CAGR | CAGR of 16.80% From 2024 to 2032 |
| Base Year | 2023 |
| Forecast Period | 2024-2032 |
| Historical Data | 2020-2022 |
| Report Scope & Coverage | Market Size, Segments Analysis, Competitive Landscape, Regional Analysis, DROC & SWOT Analysis, Forecast Outlook |
| Key Segments | • By Product (Databases, Infrastructure & Hardware, Software platforms) • By Application (Drug Discovery & Disease Modelling, Preclinical Drug Development, Clinical Trials, Computational Genomics, Computational Proteomics, Others) • By End User (Academic & Research, Industrial) |
| Regional Analysis/Coverage | North America (US, Canada, Mexico), Europe (Eastern Europe [Poland, Romania, Hungary, Turkey, Rest of Eastern Europe] Western Europe] Germany, France, UK, Italy, Spain, Netherlands, Switzerland, Austria, Rest of Western Europe]), Asia Pacific (China, India, Japan, South Korea, Vietnam, Singapore, Australia, Rest of Asia Pacific), Middle East & Africa (Middle East [UAE, Egypt, Saudi Arabia, Qatar, Rest of Middle East], Africa [Nigeria, South Africa, Rest of Africa], Latin America (Brazil, Argentina, Colombia, Rest of Latin America) |
| Company Profiles | F. Hoffmann-La Roche Ltd, Illumina, Inc., Thermo Fisher Scientific, Inc., Dassault Systèmes, Genedata AG, Chemical Computing Group, Schrodinger, Inc., Certara, Inc., Insilico Medicine, Nimbus Therapeutics, Compugen Ltd., GNS Healthcare, Evotec SE, Genomatica, Inc., 3BioMed |
| Key Drivers | • Advancements in Bioinformatics Tools and AI Drive Growth. • Convergence of Systems Biology and Synthetic Biology. |
| Restraints | • High Costs of Infrastructure and Maintenance Hinder Computational Biology Market Growth. |
Ans: The Computational Biology Market is expected to grow at a CAGR of 16.80% during 2024-2032.
Ans: The Computational Biology Market size was USD 6.32 Billion in 2023 and is expected to Reach USD 25.46 Billion by 2032.
Ans: Advancements in bioinformatics tools and AI drive growth is a major growth factor in the Computational Biology Market.
Ans: The software platforms segment dominated the Computational Biology Market.
Ans: North America dominated the Computational Biology Market in 2023.
Table of Contents
1. Introduction
1.1 Market Definition
1.2 Scope (Inclusion and Exclusions)
1.3 Research Assumptions
2. Executive Summary
2.1 Market Overview
2.2 Regional Synopsis
2.3 Competitive Summary
3. Research Methodology
3.1 Top-Down Approach
3.2 Bottom-up Approach
3.3. Data Validation
3.4 Primary Interviews
4. Market Dynamics Impact Analysis
4.1 Market Driving Factors Analysis
4.1.1 Drivers
4.1.2 Restraints
4.1.3 Opportunities
4.1.4 Challenges
4.2 PESTLE Analysis
4.3 Porter’s Five Forces Model
5. Statistical Insights and Trends Reporting
5.1 Computational Biology Adoption Rates, 2023
5.2 Computational Biology User Demographics, By User Type and Roles, 2023
5.3 Computational Biology Feature Analysis, by Feature Type
5.4 Computational Biology Cost Analysis, by Software
5.5 Computational Biology Integration Capabilities
5.6 Regulatory Compliance, by Region
6. Competitive Landscape
6.1 List of Major Companies, By Region
6.2 Market Share Analysis, By Region
6.3 Product Benchmarking
6.3.1 Product specifications and features
6.3.2 Pricing
6.4 Strategic Initiatives
6.4.1 Marketing and promotional activities
6.4.2 Distribution and Supply Chain Strategies
6.4.3 Expansion plans and new product launches
6.4.4 Strategic partnerships and collaborations
6.5 Technological Advancements
6.6 Market Positioning and Branding
7. Computational Biology Market Segmentation, by Product
7.1 Chapter Overview
7.2 Databases
7.2.1 Databases Market Trends Analysis (2020-2032)
7.2.2 Databases Market Size Estimates and Forecasts to 2032 (USD Billion)
7.3 Infrastructure & Hardware
7.3.1 Infrastructure & Hardware Market Trends Analysis (2020-2032)
7.3.2 Infrastructure & Hardware Market Size Estimates and Forecasts to 2032 (USD Billion)
7.4 Software Platforms
7.4.1 Software Platforms Market Trends Analysis (2020-2032)
7.4.2 Software Platforms Market Size Estimates and Forecasts to 2032 (USD Billion)
8. Computational Biology Market Segmentation, by Application
8.1 Chapter Overview
8.2 Drug Discovery & Disease Modelling
8.2.1 Drug Discovery & Disease Modelling Market Trends Analysis (2020-2032)
8.2.2 Drug Discovery & Disease Modelling Market Size Estimates and Forecasts to 2032 (USD Billion)
8.2.1.1 Target Identification Market Trends Analysis (2020-2032)
8.2.1.2 Target Identification Market Size Estimates and Forecasts to 2032 (USD Billion)
8.2.1.3 Target Validation Market Trends Analysis (2020-2032)
8.2.1.4 Target Validation Market Size Estimates and Forecasts to 2032 (USD Billion)
8.2.1.5 Lead Discovery Market Trends Analysis (2020-2032)
8.2.1.6 Lead Discovery Market Size Estimates and Forecasts to 2032 (USD Billion)
8.2.1.7 Lead Optimization Market Trends Analysis (2020-2032)
8.2.1.8 Lead Optimization Market Size Estimates and Forecasts to 2032 (USD Billion)
8.3 Preclinical Drug Development
8.3.1 Preclinical Drug Development Market Trends Analysis (2020-2032)
8.3.2 Preclinical Drug Development Market Size Estimates and Forecasts to 2032 (USD Billion)
8.3.1.1 Pharmacokinetics Market Trends Analysis (2020-2032)
8.3.1.2 Pharmacokinetics Market Size Estimates and Forecasts to 2032 (USD Billion)
8.3.1.3 Pharmacodynamics Market Trends Analysis (2020-2032)
8.3.1.4 Pharmacodynamics Market Size Estimates and Forecasts to 2032 (USD Billion)
8.4 Clinical Trials
8.4.1 Clinical Trials Market Trends Analysis (2020-2032)
8.4.2 Clinical Trials Market Size Estimates and Forecasts to 2032 (USD Billion)
8.4.1.1 Phase I Market Trends Analysis (2020-2032)
8.4.1.2 Phase I Market Size Estimates and Forecasts to 2032 (USD Billion)
8.4.1.3 Phase II Market Trends Analysis (2020-2032)
8.4.1.4 Phase II Market Size Estimates and Forecasts to 2032 (USD Billion)
8.4.1.5 Phase III Market Trends Analysis (2020-2032)
8.4.1.6 Phase III Market Size Estimates and Forecasts to 2032 (USD Billion)
8.4.1.7 Phase IV Market Trends Analysis (2020-2032)
8.4.1.8 Phase IV Market Size Estimates and Forecasts to 2032 (USD Billion)
8.5 Computational Genomics
8.5.1 Computational Genomics Market Trends Analysis (2020-2032)
8.5.2 Computational Genomics Market Size Estimates and Forecasts to 2032 (USD Billion)
8.6 Computational Proteomics
8.6.1 Computational Proteomics Market Trends Analysis (2020-2032)
8.6.2 Computational Proteomics Market Size Estimates and Forecasts to 2032 (USD Billion)
8.7 Others
8.7.1 Others Market Trends Analysis (2020-2032)
8.7.2 Others Market Size Estimates and Forecasts to 2032 (USD Billion)
9. Computational Biology Market Segmentation, by End User
9.1 Chapter Overview
9.2 Academic & Research
9.2.1 Academic & Research Market Trends Analysis (2020-2032)
9.2.2 Academic & Research Market Size Estimates and Forecasts to 2032 (USD Billion)
9.3 Industrial
9.3.1 Industrial Market Trends Analysis (2020-2032)
9.3.2 Industrial Market Size Estimates and Forecasts to 2032 (USD Billion)
10. Regional Analysis
10.1 Chapter Overview
10.2 North America
10.2.1 Trends Analysis
10.2.2 North America Computational Biology Market Estimates and Forecasts, by Country (2020-2032) (USD Billion)
10.2.3 North America Computational Biology Market Estimates and Forecasts, by Product (2020-2032) (USD Billion)
10.2.4 North America Computational Biology Market Estimates and Forecasts, by Application (2020-2032) (USD Billion)
10.2.5 North America Computational Biology Market Estimates and Forecasts, by End User (2020-2032) (USD Billion)
10.2.6 USA
10.2.6.1 USA Computational Biology Market Estimates and Forecasts, by Product (2020-2032) (USD Billion)
10.2.6.2 USA Computational Biology Market Estimates and Forecasts, by Application (2020-2032) (USD Billion)
10.2.6.3 USA Computational Biology Market Estimates and Forecasts, by End User (2020-2032) (USD Billion)
10.2.7 Canada
10.2.7.1 Canada Computational Biology Market Estimates and Forecasts, by Product (2020-2032) (USD Billion)
10.2.7.2 Canada Computational Biology Market Estimates and Forecasts, by Application (2020-2032) (USD Billion)
10.2.7.3 Canada Computational Biology Market Estimates and Forecasts, by End User (2020-2032) (USD Billion)
10.2.8 Mexico
10.2.8.1 Mexico Computational Biology Market Estimates and Forecasts, by Product (2020-2032) (USD Billion)
10.2.8.2 Mexico Computational Biology Market Estimates and Forecasts, by Application (2020-2032) (USD Billion)
10.2.8.3 Mexico Computational Biology Market Estimates and Forecasts, by End User (2020-2032) (USD Billion)
10.3 Europe
10.3.1 Eastern Europe
10.3.1.1 Trends Analysis
10.3.1.2 Eastern Europe Computational Biology Market Estimates and Forecasts, by Country (2020-2032) (USD Billion)
10.3.1.3 Eastern Europe Computational Biology Market Estimates and Forecasts, by Product (2020-2032) (USD Billion)
10.3.1.4 Eastern Europe Computational Biology Market Estimates and Forecasts, by Application (2020-2032) (USD Billion)
10.3.1.5 Eastern Europe Computational Biology Market Estimates and Forecasts, by End User (2020-2032) (USD Billion)
10.3.1.6 Poland
10.3.1.6.1 Poland Computational Biology Market Estimates and Forecasts, by Product (2020-2032) (USD Billion)
10.3.1.6.2 Poland Computational Biology Market Estimates and Forecasts, by Application (2020-2032) (USD Billion)
10.3.1.6.3 Poland Computational Biology Market Estimates and Forecasts, by End User (2020-2032) (USD Billion)
10.3.1.7 Romania
10.3.1.7.1 Romania Computational Biology Market Estimates and Forecasts, by Product (2020-2032) (USD Billion)
10.3.1.7.2 Romania Computational Biology Market Estimates and Forecasts, by Application (2020-2032) (USD Billion)
10.3.1.7.3 Romania Computational Biology Market Estimates and Forecasts, by End User (2020-2032) (USD Billion)
10.3.1.8 Hungary
10.3.1.8.1 Hungary Computational Biology Market Estimates and Forecasts, by Product (2020-2032) (USD Billion)
10.3.1.8.2 Hungary Computational Biology Market Estimates and Forecasts, by Application (2020-2032) (USD Billion)
10.3.1.8.3 Hungary Computational Biology Market Estimates and Forecasts, by End User (2020-2032) (USD Billion)
10.3.1.9 Turkey
10.3.1.9.1 Turkey Computational Biology Market Estimates and Forecasts, by Product (2020-2032) (USD Billion)
10.3.1.9.2 Turkey Computational Biology Market Estimates and Forecasts, by Application (2020-2032) (USD Billion)
10.3.1.9.3 Turkey Computational Biology Market Estimates and Forecasts, by End User (2020-2032) (USD Billion)
10.3.1.10 Rest of Eastern Europe
10.3.1.10.1 Rest of Eastern Europe Computational Biology Market Estimates and Forecasts, by Product (2020-2032) (USD Billion)
10.3.1.10.2 Rest of Eastern Europe Computational Biology Market Estimates and Forecasts, by Application (2020-2032) (USD Billion)
10.3.1.10.3 Rest of Eastern Europe Computational Biology Market Estimates and Forecasts, by End User (2020-2032) (USD Billion)
10.3.2 Western Europe
10.3.2.1 Trends Analysis
10.3.2.2 Western Europe Computational Biology Market Estimates and Forecasts, by Country (2020-2032) (USD Billion)
10.3.2.3 Western Europe Computational Biology Market Estimates and Forecasts, by Product (2020-2032) (USD Billion)
10.3.2.4 Western Europe Computational Biology Market Estimates and Forecasts, by Application (2020-2032) (USD Billion)
10.3.2.5 Western Europe Computational Biology Market Estimates and Forecasts, by End User (2020-2032) (USD Billion)
10.3.2.6 Germany
10.3.2.6.1 Germany Computational Biology Market Estimates and Forecasts, by Product (2020-2032) (USD Billion)
10.3.2.6.2 Germany Computational Biology Market Estimates and Forecasts, by Application (2020-2032) (USD Billion)
10.3.2.6.3 Germany Computational Biology Market Estimates and Forecasts, by End User (2020-2032) (USD Billion)
10.3.2.7 France
10.3.2.7.1 France Computational Biology Market Estimates and Forecasts, by Product (2020-2032) (USD Billion)
10.3.2.7.2 France Computational Biology Market Estimates and Forecasts, by Application (2020-2032) (USD Billion)
10.3.2.7.3 France Computational Biology Market Estimates and Forecasts, by End User (2020-2032) (USD Billion)
10.3.2.8 UK
10.3.2.8.1 UK Computational Biology Market Estimates and Forecasts, by Product (2020-2032) (USD Billion)
10.3.2.8.2 UK Computational Biology Market Estimates and Forecasts, by Application (2020-2032) (USD Billion)
10.3.2.8.3 UK Computational Biology Market Estimates and Forecasts, by End User (2020-2032) (USD Billion)
10.3.2.9 Italy
10.3.2.9.1 Italy Computational Biology Market Estimates and Forecasts, by Product (2020-2032) (USD Billion)
10.3.2.9.2 Italy Computational Biology Market Estimates and Forecasts, by Application (2020-2032) (USD Billion)
10.3.2.9.3 Italy Computational Biology Market Estimates and Forecasts, by End User (2020-2032) (USD Billion)
10.3.2.10 Spain
10.3.2.10.1 Spain Computational Biology Market Estimates and Forecasts, by Product (2020-2032) (USD Billion)
10.3.2.10.2 Spain Computational Biology Market Estimates and Forecasts, by Application (2020-2032) (USD Billion)
10.3.2.10.3 Spain Computational Biology Market Estimates and Forecasts, by End User (2020-2032) (USD Billion)
10.3.2.11 Netherlands
10.3.2.11.1 Netherlands Computational Biology Market Estimates and Forecasts, by Product (2020-2032) (USD Billion)
10.3.2.11.2 Netherlands Computational Biology Market Estimates and Forecasts, by Application (2020-2032) (USD Billion)
10.3.2.11.3 Netherlands Computational Biology Market Estimates and Forecasts, by End User (2020-2032) (USD Billion)
10.3.2.12 Switzerland
10.3.2.12.1 Switzerland Computational Biology Market Estimates and Forecasts, by Product (2020-2032) (USD Billion)
10.3.2.12.2 Switzerland Computational Biology Market Estimates and Forecasts, by Application (2020-2032) (USD Billion)
10.3.2.12.3 Switzerland Computational Biology Market Estimates and Forecasts, by End User (2020-2032) (USD Billion)
10.3.2.13 Austria
10.3.2.13.1 Austria Computational Biology Market Estimates and Forecasts, by Product (2020-2032) (USD Billion)
10.3.2.13.2 Austria Computational Biology Market Estimates and Forecasts, by Application (2020-2032) (USD Billion)
10.3.2.13.3 Austria Computational Biology Market Estimates and Forecasts, by End User (2020-2032) (USD Billion)
10.3.2.14 Rest of Western Europe
10.3.2.14.1 Rest of Western Europe Computational Biology Market Estimates and Forecasts, by Product (2020-2032) (USD Billion)
10.3.2.14.2 Rest of Western Europe Computational Biology Market Estimates and Forecasts, by Application (2020-2032) (USD Billion)
10.3.2.14.3 Rest of Western Europe Computational Biology Market Estimates and Forecasts, by End User (2020-2032) (USD Billion)
10.4 Asia Pacific
10.4.1 Trends Analysis
10.4.2 Asia Pacific Computational Biology Market Estimates and Forecasts, by Country (2020-2032) (USD Billion)
10.4.3 Asia Pacific Computational Biology Market Estimates and Forecasts, by Product (2020-2032) (USD Billion)
10.4.4 Asia Pacific Computational Biology Market Estimates and Forecasts, by Application (2020-2032) (USD Billion)
10.4.5 Asia Pacific Computational Biology Market Estimates and Forecasts, by End User (2020-2032) (USD Billion)
10.4.6 China
10.4.6.1 China Computational Biology Market Estimates and Forecasts, by Product (2020-2032) (USD Billion)
10.4.6.2 China Computational Biology Market Estimates and Forecasts, by Application (2020-2032) (USD Billion)
10.4.6.3 China Computational Biology Market Estimates and Forecasts, by End User (2020-2032) (USD Billion)
10.4.7 India
10.4.7.1 India Computational Biology Market Estimates and Forecasts, by Product (2020-2032) (USD Billion)
10.4.7.2 India Computational Biology Market Estimates and Forecasts, by Application (2020-2032) (USD Billion)
10.4.7.3 India Computational Biology Market Estimates and Forecasts, by End User (2020-2032) (USD Billion)
10.4.8 Japan
10.4.8.1 Japan Computational Biology Market Estimates and Forecasts, by Product (2020-2032) (USD Billion)
10.4.8.2 Japan Computational Biology Market Estimates and Forecasts, by Application (2020-2032) (USD Billion)
10.4.8.3 Japan Computational Biology Market Estimates and Forecasts, by End User (2020-2032) (USD Billion)
10.4.9 South Korea
10.4.9.1 South Korea Computational Biology Market Estimates and Forecasts, by Product (2020-2032) (USD Billion)
10.4.9.2 South Korea Computational Biology Market Estimates and Forecasts, by Application (2020-2032) (USD Billion)
10.4.9.3 South Korea Computational Biology Market Estimates and Forecasts, by End User (2020-2032) (USD Billion)
10.4.10 Vietnam
10.4.10.1 Vietnam Computational Biology Market Estimates and Forecasts, by Product (2020-2032) (USD Billion)
10.4.10.2 Vietnam Computational Biology Market Estimates and Forecasts, by Application (2020-2032) (USD Billion)
10.4.10.3 Vietnam Computational Biology Market Estimates and Forecasts, by End User (2020-2032) (USD Billion)
10.4.11 Singapore
10.4.11.1 Singapore Computational Biology Market Estimates and Forecasts, by Product (2020-2032) (USD Billion)
10.4.11.2 Singapore Computational Biology Market Estimates and Forecasts, by Application (2020-2032) (USD Billion)
10.4.11.3 Singapore Computational Biology Market Estimates and Forecasts, by End User (2020-2032) (USD Billion)
10.4.12 Australia
10.4.12.1 Australia Computational Biology Market Estimates and Forecasts, by Product (2020-2032) (USD Billion)
10.4.12.2 Australia Computational Biology Market Estimates and Forecasts, by Application (2020-2032) (USD Billion)
10.4.12.3 Australia Computational Biology Market Estimates and Forecasts, by End User (2020-2032) (USD Billion)
10.4.13 Rest of Asia Pacific
10.4.13.1 Rest of Asia Pacific Computational Biology Market Estimates and Forecasts, by Product (2020-2032) (USD Billion)
10.4.13.2 Rest of Asia Pacific Computational Biology Market Estimates and Forecasts, by Application (2020-2032) (USD Billion)
10.4.13.3 Rest of Asia Pacific Computational Biology Market Estimates and Forecasts, by End User (2020-2032) (USD Billion)
10.5 Middle East and Africa
10.5.1 Middle East
10.5.1.1 Trends Analysis
10.5.1.2 Middle East Computational Biology Market Estimates and Forecasts, by Country (2020-2032) (USD Billion)
10.5.1.3 Middle East Computational Biology Market Estimates and Forecasts, by Product (2020-2032) (USD Billion)
10.5.1.4 Middle East Computational Biology Market Estimates and Forecasts, by Application (2020-2032) (USD Billion)
10.5.1.5 Middle East Computational Biology Market Estimates and Forecasts, by End User (2020-2032) (USD Billion)
10.5.1.6 UAE
10.5.1.6.1 UAE Computational Biology Market Estimates and Forecasts, by Product (2020-2032) (USD Billion)
10.5.1.6.2 UAE Computational Biology Market Estimates and Forecasts, by Application (2020-2032) (USD Billion)
10.5.1.6.3 UAE Computational Biology Market Estimates and Forecasts, by End User (2020-2032) (USD Billion)
10.5.1.7 Egypt
10.5.1.7.1 Egypt Computational Biology Market Estimates and Forecasts, by Product (2020-2032) (USD Billion)
10.5.1.7.2 Egypt Computational Biology Market Estimates and Forecasts, by Application (2020-2032) (USD Billion)
10.5.1.7.3 Egypt Computational Biology Market Estimates and Forecasts, by End User (2020-2032) (USD Billion)
10.5.1.8 Saudi Arabia
10.5.1.8.1 Saudi Arabia Computational Biology Market Estimates and Forecasts, by Product (2020-2032) (USD Billion)
10.5.1.8.2 Saudi Arabia Computational Biology Market Estimates and Forecasts, by Application (2020-2032) (USD Billion)
10.5.1.8.3 Saudi Arabia Computational Biology Market Estimates and Forecasts, by End User (2020-2032) (USD Billion)
10.5.1.9 Qatar
10.5.1.9.1 Qatar Computational Biology Market Estimates and Forecasts, by Product (2020-2032) (USD Billion)
10.5.1.9.2 Qatar Computational Biology Market Estimates and Forecasts, by Application (2020-2032) (USD Billion)
10.5.1.9.3 Qatar Computational Biology Market Estimates and Forecasts, by End User (2020-2032) (USD Billion)
10.5.1.10 Rest of Middle East
10.5.1.10.1 Rest of Middle East Computational Biology Market Estimates and Forecasts, by Product (2020-2032) (USD Billion)
10.5.1.10.2 Rest of Middle East Computational Biology Market Estimates and Forecasts, by Application (2020-2032) (USD Billion)
10.5.1.10.3 Rest of Middle East Computational Biology Market Estimates and Forecasts, by End User (2020-2032) (USD Billion)
10.5.2 Africa
10.5.2.1 Trends Analysis
10.5.2.2 Africa Computational Biology Market Estimates and Forecasts, by Country (2020-2032) (USD Billion)
10.5.2.3 Africa Computational Biology Market Estimates and Forecasts, by Product (2020-2032) (USD Billion)
10.5.2.4 Africa Computational Biology Market Estimates and Forecasts, by Application (2020-2032) (USD Billion)
10.5.2.5 Africa Computational Biology Market Estimates and Forecasts, by End User (2020-2032) (USD Billion)
10.5.2.6 South Africa
10.5.2.6.1 South Africa Computational Biology Market Estimates and Forecasts, by Product (2020-2032) (USD Billion)
10.5.2.6.2 South Africa Computational Biology Market Estimates and Forecasts, by Application (2020-2032) (USD Billion)
10.5.2.6.3 South Africa Computational Biology Market Estimates and Forecasts, by End User (2020-2032) (USD Billion)
10.5.2.7 Nigeria
10.5.2.7.1 Nigeria Computational Biology Market Estimates and Forecasts, by Product (2020-2032) (USD Billion)
10.5.2.7.2 Nigeria Computational Biology Market Estimates and Forecasts, by Application (2020-2032) (USD Billion)
10.5.2.7.3 Nigeria Computational Biology Market Estimates and Forecasts, by End User (2020-2032) (USD Billion)
10.5.2.8 Rest of Africa
10.5.2.8.1 Rest of Africa Computational Biology Market Estimates and Forecasts, by Product (2020-2032) (USD Billion)
10.5.2.8.2 Rest of Africa Computational Biology Market Estimates and Forecasts, by Application (2020-2032) (USD Billion)
10.5.2.8.3 Rest of Africa Computational Biology Market Estimates and Forecasts, by End User (2020-2032) (USD Billion)
10.6 Latin America
10.6.1 Trends Analysis
10.6.2 Latin America Computational Biology Market Estimates and Forecasts, by Country (2020-2032) (USD Billion)
10.6.3 Latin America Computational Biology Market Estimates and Forecasts, by Product (2020-2032) (USD Billion)
10.6.4 Latin America Computational Biology Market Estimates and Forecasts, by Application (2020-2032) (USD Billion)
10.6.5 Latin America Computational Biology Market Estimates and Forecasts, by End User (2020-2032) (USD Billion)
10.6.6 Brazil
10.6.6.1 Brazil Computational Biology Market Estimates and Forecasts, by Product (2020-2032) (USD Billion)
10.6.6.2 Brazil Computational Biology Market Estimates and Forecasts, by Application (2020-2032) (USD Billion)
10.6.6.3 Brazil Computational Biology Market Estimates and Forecasts, by End User (2020-2032) (USD Billion)
10.6.7 Argentina
10.6.7.1 Argentina Computational Biology Market Estimates and Forecasts, by Product (2020-2032) (USD Billion)
10.6.7.2 Argentina Computational Biology Market Estimates and Forecasts, by Application (2020-2032) (USD Billion)
10.6.7.3 Argentina Computational Biology Market Estimates and Forecasts, by End User (2020-2032) (USD Billion)
10.6.8 Colombia
10.6.8.1 Colombia Computational Biology Market Estimates and Forecasts, by Product (2020-2032) (USD Billion)
10.6.8.2 Colombia Computational Biology Market Estimates and Forecasts, by Application (2020-2032) (USD Billion)
10.6.8.3 Colombia Computational Biology Market Estimates and Forecasts, by End User (2020-2032) (USD Billion)
10.6.9 Rest of Latin America
10.6.9.1 Rest of Latin America Computational Biology Market Estimates and Forecasts, by Product (2020-2032) (USD Billion)
10.6.9.2 Rest of Latin America Computational Biology Market Estimates and Forecasts, by Application (2020-2032) (USD Billion)
10.6.9.3 Rest of Latin America Computational Biology Market Estimates and Forecasts, by End User (2020-2032) (USD Billion)
11. Company Profiles
11.1 F. Hoffmann-La Roche Ltd
11.1.1 Company Overview
11.1.2 Financial
11.1.3 Products/ Services Offered
11.1.4 SWOT Analysis
11.2 Illumina, Inc.
11.2.1 Company Overview
11.2.2 Financial
11.2.3 Products/ Services Offered
11.2.4 SWOT Analysis
11.3 Thermo Fisher Scientific, Inc.
11.3.1 Company Overview
11.3.2 Financial
11.3.3 Products/ Services Offered
11.3.4 SWOT Analysis
11.4 Dassault Systèmes
11.4.1 Company Overview
11.4.2 Financial
11.4.3 Products/ Services Offered
11.4.4 SWOT Analysis
11.5 Genedata AG
11.5.1 Company Overview
11.5.2 Financial
11.5.3 Products/ Services Offered
11.5.4 SWOT Analysis
11.6 Chemical Computing Group
11.6.1 Company Overview
11.6.2 Financial
11.6.3 Products/ Services Offered
11.6.4 SWOT Analysis
11.7 Schrodinger, Inc.
11.7.1 Company Overview
11.7.2 Financial
11.7.3 Products/ Services Offered
11.7.4 SWOT Analysis
11.8 Certara, Inc.
11.8.1 Company Overview
11.8.2 Financial
11.8.3 Products/ Services Offered
11.8.4 SWOT Analysis
11.9 Insilico Medicine
11.9.1 Company Overview
11.9.2 Financial
11.9.3 Products/ Services Offered
11.9.4 SWOT Analysis
11.10 Nimbus Therapeutics
11.10.1 Company Overview
11.10.2 Financial
11.10.3 Products/ Services Offered
11.10.4 SWOT Analysis
12. Use Cases and Best Practices
13. Conclusion
An accurate research report requires proper strategizing as well as implementation. There are multiple factors involved in the completion of good and accurate research report and selecting the best methodology to compete the research is the toughest part. Since the research reports we provide play a crucial role in any company’s decision-making process, therefore we at SNS Insider always believe that we should choose the best method which gives us results closer to reality. This allows us to reach at a stage wherein we can provide our clients best and accurate investment to output ratio.
Each report that we prepare takes a timeframe of 350-400 business hours for production. Starting from the selection of titles through a couple of in-depth brain storming session to the final QC process before uploading our titles on our website we dedicate around 350 working hours. The titles are selected based on their current market cap and the foreseen CAGR and growth.
The 5 steps process:
Step 1: Secondary Research:
Secondary Research or Desk Research is as the name suggests is a research process wherein, we collect data through the readily available information. In this process we use various paid and unpaid databases which our team has access to and gather data through the same. This includes examining of listed companies’ annual reports, Journals, SEC filling etc. Apart from this our team has access to various associations across the globe across different industries. Lastly, we have exchange relationships with various university as well as individual libraries.

Step 2: Primary Research
When we talk about primary research, it is a type of study in which the researchers collect relevant data samples directly, rather than relying on previously collected data. This type of research is focused on gaining content specific facts that can be sued to solve specific problems. Since the collected data is fresh and first hand therefore it makes the study more accurate and genuine.
We at SNS Insider have divided Primary Research into 2 parts.
Part 1 wherein we interview the KOLs of major players as well as the upcoming ones across various geographic regions. This allows us to have their view over the market scenario and acts as an important tool to come closer to the accurate market numbers. As many as 45 paid and unpaid primary interviews are taken from both the demand and supply side of the industry to make sure we land at an accurate judgement and analysis of the market.
This step involves the triangulation of data wherein our team analyses the interview transcripts, online survey responses and observation of on filed participants. The below mentioned chart should give a better understanding of the part 1 of the primary interview.

Part 2: In this part of primary research the data collected via secondary research and the part 1 of the primary research is validated with the interviews from individual consultants and subject matter experts.
Consultants are those set of people who have at least 12 years of experience and expertise within the industry whereas Subject Matter Experts are those with at least 15 years of experience behind their back within the same space. The data with the help of two main processes i.e., FGDs (Focused Group Discussions) and IDs (Individual Discussions). This gives us a 3rd party nonbiased primary view of the market scenario making it a more dependable one while collation of the data pointers.
Step 3: Data Bank Validation
Once all the information is collected via primary and secondary sources, we run that information for data validation. At our intelligence centre our research heads track a lot of information related to the market which includes the quarterly reports, the daily stock prices, and other relevant information. Our data bank server gets updated every fortnight and that is how the information which we collected using our primary and secondary information is revalidated in real time.

Step 4: QA/QC Process
After all the data collection and validation our team does a final level of quality check and quality assurance to get rid of any unwanted or undesired mistakes. This might include but not limited to getting rid of the any typos, duplication of numbers or missing of any important information. The people involved in this process include technical content writers, research heads and graphics people. Once this process is completed the title gets uploader on our platform for our clients to read it.
Step 5: Final QC/QA Process:
This is the last process and comes when the client has ordered the study. In this process a final QA/QC is done before the study is emailed to the client. Since we believe in giving our clients a good experience of our research studies, therefore, to make sure that we do not lack at our end in any way humanly possible we do a final round of quality check and then dispatch the study to the client.
By Service
Databases
Infrastructure & Hardware
Software Platforms
By Application
Drug Discovery & Disease Modelling
Target Identification
Target Validation
Lead Discovery
Lead Optimization
Preclinical Drug Development
Pharmacokinetics
Pharmacodynamics
Clinical Trials
Phase I
Phase II
Phase III
Phase IV
Computational Genomics
Computational Proteomics
Others
By End-User
Academic & Research
Industrial
Request for Segment Customization as per your Business Requirement: Segment Customization Request
REGIONAL COVERAGE:
North America
US
Canada
Mexico
Europe
Eastern Europe
Poland
Romania
Hungary
Turkey
Rest of Eastern Europe
Western Europe
Germany
France
UK
Italy
Spain
Netherlands
Switzerland
Austria
Rest of Western Europe
Asia Pacific
China
India
Japan
South Korea
Vietnam
Singapore
Australia
Rest of Asia Pacific
Middle East & Africa
Middle East
UAE
Egypt
Saudi Arabia
Qatar
Rest of the Middle East
Africa
Nigeria
South Africa
Rest of Africa
Latin America
Brazil
Argentina
Colombia
Request for Country Level Research Report: Country Level Customization Request
Available Customization
With the given market data, SNS Insider offers customization as per the company’s specific needs. The following customization options are available for the report:
Product Analysis
Criss-Cross segment analysis (e.g. Product X Application)
Product Matrix which gives a detailed comparison of the product portfolio of each company
Geographic Analysis
Additional countries in any of the regions
Company Information
Detailed analysis and profiling of additional market players (Up to five)
The Amniotic Products Market Size was valued at USD 910.78 Million in 2023 and is expected to reach USD 1,734.03 Million by 2032, growing at a CAGR of 7.42% over the forecast period of 2024-2032.
Veterinary Microchips Market Size was valued at USD 686.3 million in 2023 and is expected to reach USD 1637.41 million by 2032, growing at a CAGR of 10.16% over the forecast period 2024-2032.
Antipsychotic Drugs Market was valued at USD 16.61 billion in 2023 and is expected to reach USD 29.23 billion by 2032, growing at a CAGR of 6.53% from 2024-2032.
The global palliative care market size was USD 10.7 billion in 2023 and is anticipated to grow at a CAGR of 9.06% to reach USD 23.34 Billion by 2032.
The Healthcare EDI Market Size was valued at USD 4.5 Billion in 2023 and is expected to reach USD 10.2 Billion by 2032, growing at a CAGR of 9.6% over the forecast period 2024-2032.
The Immunotherapy Drugs Market was valued at USD 246.00 billion in 2023 and is expected to reach USD 829.78 billion by 2032, growing at a CAGR of 14.49% over the forecast period 2024-2032.

Hi! Click one of our member below to chat on Phone
© 2025 All Rights Reserved by SNS Insider Pvt Ltd


