Get more Information on Composite Packaging Market - Request Sample Report
The Composite Packaging Market Size was valued at USD 73.57 billion in 2023 and is projected to grow to USD 112.96 billion by 2032, reflecting a remarkable compound annual growth rate (CAGR) of 5.28% during the forecast period from 2024 to 2032
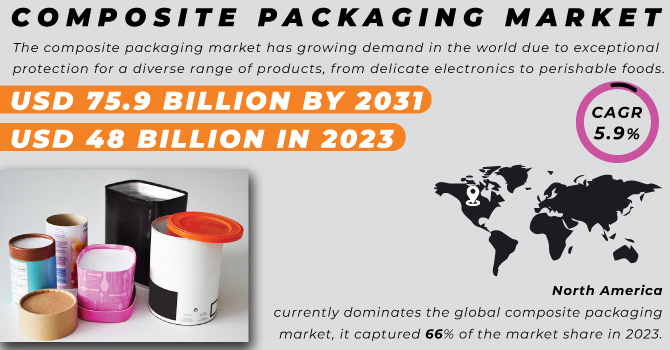
The composite packaging market has growing demand in the world due to exceptional protection for a diverse range of products, from delicate electronics to perishable foods. This advantage stems from the ingenious combination of multiple materials, leading to superior strength and resistance to external threats like moisture, light, and mechanical stress. The composite materials allow manufacturers to create customized packaging solutions, that affect a wide range of needs, lightweight containers for on-the-go snacks, or a robust enclosure for industrial components. Sustainability gives rise to the composite packaging market. With heightened environmental awareness and regulations aiming to reduce plastic use, manufacturers are increasingly turning to composite materials as a viable alternative to traditional packaging formats. biodegradable components, composite packaging helps minimize the environmental impact of packaging waste, all while offering the same level of protection and functionality.
Drivers
Rising disposable income, and E-commerce sector are fueling the growth of the composite packaging industry
Development of new composite packaging solutions caters the packaging industry
A market shift toward the e-commerce platform, rising disposable income, and the development of more advanced pharmaceuticals are key drivers for the composite packaging industry's booming market value. The global e-commerce surge is particularly expanding the use of composite packaging. As online shopping becomes increasingly popular, consumers rely on secure and reliable packaging to ensure their products arrive safely. Additionally, the rise of complex medications, driven by government and World Health Organization initiatives, necessitates specialized packaging solutions like composites to maintain the sterility and protection of these drugs during transport and storage.
Restraint:
Fluctuations in raw materials for composite packaging pose a challenge for manufacturers
The high cost of raw materials for composite packaging reduces manufacturers profit margins. The volatile pricing of key materials like wood pulp and aluminum disrupts budgeting and production planning for composite packaging manufacturers. raw material prices pose a challenge for composite packaging manufacturers. To mitigate this, exploring alternative suppliers and diversifying material sources could be beneficial.
Opportunities
High-quality materials and expending industries drive growth in composite packaging
Expanding presence in developing countries with growing consumer demand for packaged goods
High-quality materials used in composite packaging create significant growth potential for the industry. Several factors contribute to the overall market size and growth like the thriving retail sector, ongoing advancements in transportation infrastructure, and the ever-expanding logistics industry. Furthermore, the development and launch of innovative new composite packaging solutions will undoubtedly fuel further market expansion.
Challenges
Balancing sustainability with affordability remains a challenge for manufacturers
Developing and implementing eco-friendly features and improved recyclability in composite materials often involve more complex processes and potentially more expensive materials. This can increase the overall production cost for traditional composite packaging. Fluctuations in the cost of raw materials used in both traditional and sustainable composite materials can complicate pricing strategies. consumers increasingly express interest in sustainability, they may be hesitant to pay a premium for eco-friendly packaging options. Manufacturers find it challenging to balance between offering sustainable solutions and maintaining price competitiveness.
The Russia-Ukraine war can disrupt the composite packaging market in several ways Russia and Ukraine are significant exporters of key materials used in composite packaging, such as wood pulp, aluminum, and plastic resins. The war can disrupt these supplies, leading to shortages and price hikes for these raw materials. Disruptions in transportation routes can create logistical challenges, delaying the delivery of raw materials or finished composite packaging products. The war might lead to changes in consumer spending patterns, potentially impacting the demand for certain products and subsequently, the demand for specific types of composite packaging.
The impact of an economic downturn is leading to a slowdown the market on the composite packaging market, affecting both demand and production. , consumers tend to reduce these expenses and prioritize essential goods over discretionary spending. This can lead to a decline in demand for packaged products, impacting the market for composite packaging materials. Businesses may postpone or reduce investments in new packaging solutions or production lines, further dampening demand for composite materials. Consumers may switch to lower-priced products with less elaborate packaging, leading to a decline in demand for premium composite packaging solutions used for high-end products.
By Material
The plastic sub-segment dominates the composite packaging market by material in 2023, it is projected for over 45% of market share and is expected to maintain its dominance throughout the forecast period. Plastic provides exceptional barrier properties, shielding products from moisture, gases, and light. This superior protection helps maintain the freshness and quality of packaged products for extended periods. Plastic boasts impressive durability and flexibility, making it adaptable to various packaging needs. Additionally, its lightweight nature translates to lower transportation costs and facilitates efficient manufacturing of composite packaging.
By End-use
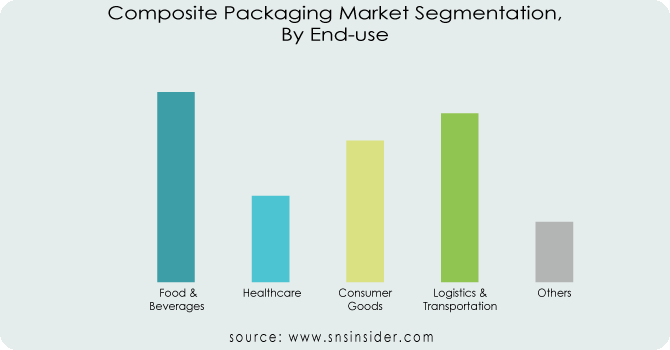
The food & beverage sub-segment leads the composite packaging market by end-use and captures an overall 33.4% in 2023. This dominance is driven by effectively extending the shelf life of food & beverage products, minimizing spoilage and waste. The composite materials safeguard products from damage during storage and transportation, ensuring quality and safety for consumers. Composite packaging often offers features that enhance consumer convenience, such as easy opening mechanisms or resealable closures. This contributes to the segment growth.
Get Customized Report as per your Business Requirement - Request For Customized Report
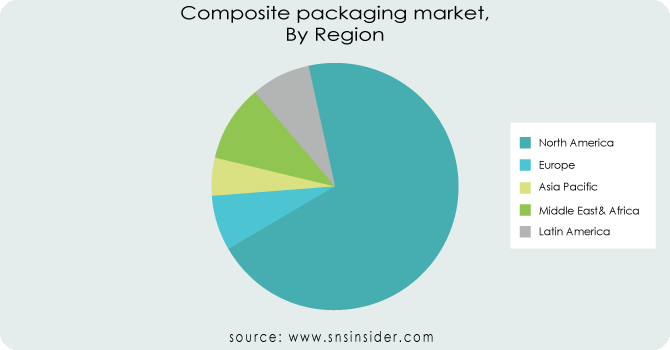
North America currently dominates the global composite packaging market, it captured 66% of the market share in 2023. This dominance can be attributed to the growing preference for eco-friendly packaging solutions among North American consumers is significantly propelling market growth in the region. The presence of numerous leading players in the composite packaging industry and their innovative product offerings further contribute to regional dominance. Europe stands as the second-largest market and manufacturers are at the for developing modern and efficient packaging solutions. this region is high demand for packaged food and beverage products, such as bakery & confectionery, dairy items, and others, fuels the need for advanced composite packaging solutions.
The major key players listed in the Composite packaging market are Amcor, DS Smith, Mondi, Smurfit Kappa, Sonoco Products Company, Crown Holdings, Tetra Pak, International, Coveris Holdings,Constantia Flexibles, NPP, GWP Packaging, Zipform Packaging, Envirocore CC , and others players.
In November 2023, Sonoco acquired Amcor Packaging's composite can operations. This move will solidify Sonoco's position as a leader in the Asia Pacific market and the benefit of the acquisition is highlighted.
In July 2023, The Mitsubishi Chemical Group, Toppan Inc., and Kyoeisha Chemical joined forces to develop a groundbreaking material recycling process and focus on collaboration and innovation). This technology has the potential to revolutionize plastic composite packaging recycling by separating and extracting different kinds of resins.
In June 2022, Corona India made a significant stride towards sustainability by introducing a groundbreaking 100% biodegradable and composite packing solution made from barley straw. This innovative, circular packaging aligns with Corona India's commitment to environmental protection.
Report Attributes | Details |
---|---|
Market Size in 2023 | USD 73.57 Billion |
Market Size by 2032 | USD 112.96 Billion |
CAGR | CAGR of 5.28% From 2024 to 2032 |
Base Year | 2023 |
Forecast Period | 2024-2032 |
Historical Data | 2020-2022 |
Report Scope & Coverage | Market Size, Segments Analysis, Competitive Landscape, Regional Analysis, DROC & SWOT Analysis, Forecast Outlook |
Key Segments | • By Material Type (Glass, Plastic, Metal, Paper) • By End User (Food and beverage industry, Consumer goods, Household, Retail and wholesales, Cosmetics, Pharmaceuticals, Others) |
Regional Analysis/Coverage |
North America (US, Canada, Mexico), Europe (Eastern Europe [Poland, Romania, Hungary, Turkey, Rest of Eastern Europe] Western Europe] Germany, France, UK, Italy, Spain, Netherlands, Switzerland, Austria, Rest of Western Europe]), Asia Pacific (China, India, Japan, South Korea, Vietnam, Singapore, Australia, Rest of Asia Pacific), Middle East & Africa (Middle East [UAE, Egypt, Saudi Arabia, Qatar, Rest of Middle East], Africa [Nigeria, South Africa, Rest of Africa], Latin America (Brazil, Argentina, Colombia Rest of Latin America |
Company Profiles | Amcor Limited, BASF SE, TetraPak International S.A., Smurfit Kappa Group PLC, Sealed Air Corporation, and others. |
Ans: Key Stakeholders Considered in the study:
Raw material vendors
Distributors/traders/wholesalers/suppliers
Regulatory authorities, including government agencies and NGO
Commercial research & development (R&D) institutions
Importers and exporters
Government organizations, research organizations, and consulting firms
Trade/Industrial associations
End-use industries are the stake holder of this report
Ans: Amcor Limited, BASF SE, TetraPak International S.A., Smurfit Kappa Group PLC, and Sealed Air Corporation are the key players in the Global Composite Packaging Market
Ans: Manufacturers, Consultant, aftermarket players, association, Research institute, private and universities libraries, suppliers and distributors of the product.
Ans: The global and regional spread of COVID has had a significant impact on humans, as the death rate is increasing day by day. The expansion of the composite packaging market curve has been impeded as a result of this. The government has imposed a lockdown in several places for national security reasons, but this has had a significant impact on the manufacturing of packaging materials. After the situation has stabilised, the market will return to normal. The government has also set rules such as keeping a safe distance from others and wearing masks and gloves.
Ans. The projected market size for the Composite Packaging Market is USD 112.96 Billion by 2032.
Table of Contents
1. Introduction
1.1 Market Definition
1.2 Scope
1.3 Research Assumptions
2. Industry Flowchart
3. Research Methodology
4. Market Dynamics
4.1 Drivers
4.2 Restraints
4.3 Opportunities
4.4 Challenges
5. Impact Analysis
5.1 Impact Of Russia Ukraine War
5.2 Impact of Economic Slowdown
6. Value Chain Analysis
7. Porter’s 5 Forces Model
8. Pest Analysis
9. Average Selling Price
9.1 North America
9.2 Europe
9.3 Asia Pacific
9.4 Latin America
9.5 Middle East & Africa
10. Composite Packaging Market Segmentation, By Material
10.1 Introduction
10.2 Trend Analysis
10.3 Plastic
10.4 Paper & Paperboard
10.5 Metal
10.6 Others
11. Composite Packaging Market Segmentation, By End-Use
11.1 Introduction
11.2 Trend Analysis
11.3 Food & Beverages
11.4 Healthcare
11.5 Consumer Goods
11.6 Logistics & Transportation
11.7 Others
12. Regional Analysis
12.1 Introduction
12.2 North America
12.2.1 Trend Analysis
12.2.2 North America Composite Packaging Market by Country
12.2.3 North America Composite Packaging Market By Material
12.2.4 North America Composite Packaging Market By End-Use
12.2.5 USA
12.2.5.1 USA Composite Packaging Market By Material
12.2.5.2 USA Composite Packaging Market By End-Use
12.2.6 Canada
12.2.6.1 Canada Composite Packaging Market By Material
12.2.6.2 Canada Composite Packaging Market By End-Use
12.2.7 Mexico
12.2.7.1 Mexico Composite Packaging Market By Material
12.2.7.2 Mexico Composite Packaging Market By End-Use
12.3 Europe
12.3.1 Trend Analysis
12.3.2 Eastern Europe
12.3.2.1 Eastern Europe Composite Packaging Market by Country
12.3.2.2 Eastern Europe Composite Packaging Market By Material
12.3.2.3 Eastern Europe Composite Packaging Market By End-Use
12.3.2.4 Poland
12.3.2.4.1 Poland Composite Packaging Market By Material
12.3.2.4.2 Poland Composite Packaging Market By End-Use
12.3.2.5 Romania
12.3.2.5.1 Romania Composite Packaging Market By Material
12.3.2.5.2 Romania Composite Packaging Market By End-Use
12.3.2.6 Hungary
12.3.2.6.1 Hungary Composite Packaging Market By Material
12.3.2.6.2 Hungary Composite Packaging Market By End-Use
12.3.2.7 Turkey
12.3.2.7.1 Turkey Composite Packaging Market By Material
12.3.2.7.2 Turkey Composite Packaging Market By End-Use
12.3.2.8 Rest of Eastern Europe
12.3.2.8.1 Rest of Eastern Europe Composite Packaging Market By Material
12.3.2.8.2 Rest of Eastern Europe Composite Packaging Market By End-Use
12.3.3 Western Europe
12.3.3.1 Western Europe Composite Packaging Market by Country
12.3.3.2 Western Europe Composite Packaging Market By Material
12.3.3.3 Western Europe Composite Packaging Market By End-Use
12.3.3.4 Germany
12.3.3.4.1 Germany Composite Packaging Market By Material
12.3.3.4.2 Germany Composite Packaging Market By End-Use
12.3.3.5 France
12.3.3.5.1 France Composite Packaging Market By Material
12.3.3.5.2 France Composite Packaging Market By End-Use
12.3.3.6 UK
12.3.3.6.1 UK Composite Packaging Market By Material
12.3.3.6.2 UK Composite Packaging Market By End-Use
12.3.3.7 Italy
12.3.3.7.1 Italy Composite Packaging Market By Material
12.3.3.7.2 Italy Composite Packaging Market By End-Use
12.3.3.8 Spain
12.3.3.8.1 Spain Composite Packaging Market By Material
12.3.3.8.2 Spain Composite Packaging Market By End-Use
12.3.3.9 Netherlands
12.3.3.9.1 Netherlands Composite Packaging Market By Material
12.3.3.9.2 Netherlands Composite Packaging Market By End-Use
12.3.3.10 Switzerland
12.3.3.10.1 Switzerland Composite Packaging Market By Material
12.3.3.10.2 Switzerland Composite Packaging Market By End-Use
12.3.3.11 Austria
12.3.3.11.1 Austria Composite Packaging Market By Material
12.3.3.11.2 Austria Composite Packaging Market By End-Use
12.3.3.12 Rest of Western Europe
12.3.3.12.1 Rest of Western Europe Composite Packaging Market By Material
12.3.2.12.2 Rest of Western Europe Composite Packaging Market By End-Use
12.4 Asia-Pacific
12.4.1 Trend Analysis
12.4.2 Asia Pacific Composite Packaging Market by Country
12.4.3 Asia Pacific Composite Packaging Market By Material
12.4.4 Asia Pacific Composite Packaging Market By End-Use
12.4.5 China
12.4.5.1 China Composite Packaging Market By Material
12.4.5.2 China Composite Packaging Market By End-Use
12.4.6 India
12.4.6.1 India Composite Packaging Market By Material
12.4.6.2 India Composite Packaging Market By End-Use
12.4.7 Japan
12.4.7.1 Japan Composite Packaging Market By Material
12.4.7.2 Japan Composite Packaging Market By End-Use
12.4.8 South Korea
12.4.8.1 South Korea Composite Packaging Market By Material
12.4.8.2 South Korea Composite Packaging Market By End-Use
12.4.9 Vietnam
12.4.9.1 Vietnam Composite Packaging Market By Material
12.4.9.2 Vietnam Composite Packaging Market By End-Use
12.4.10 Singapore
12.4.10.1 Singapore Composite Packaging Market By Material
12.4.10.2 Singapore Composite Packaging Market By End-Use
12.4.11 Australia
12.4.11.1 Australia Composite Packaging Market By Material
12.4.11.2 Australia Composite Packaging Market By End-Use
12.4.12 Rest of Asia-Pacific
12.4.12.1 Rest of Asia-Pacific Composite Packaging Market By Material
12.4.12.2 Rest of Asia-Pacific Composite Packaging Market By End-Use
12.5 Middle East & Africa
12.5.1 Trend Analysis
12.5.2 Middle East
12.5.2.1 Middle East Composite Packaging Market by Country
12.5.2.2 Middle East Composite Packaging Market By Material
12.5.2.3 Middle East Composite Packaging Market By End-Use
12.5.2.4 UAE
12.5.2.4.1 UAE Composite Packaging Market By Material
12.5.2.4.2 UAE Composite Packaging Market By End-Use
12.5.2.5 Egypt
12.5.2.5.1 Egypt Composite Packaging Market By Material
12.5.2.5.2 Egypt Composite Packaging Market By End-Use
12.5.2.6 Saudi Arabia
12.5.2.6.1 Saudi Arabia Composite Packaging Market By Material
12.5.2.6.2 Saudi Arabia Composite Packaging Market By End-Use
12.5.2.7 Qatar
12.5.2.7.1 Qatar Composite Packaging Market By Material
12.5.2.7.2 Qatar Composite Packaging Market By End-Use
12.5.2.8 Rest of Middle East
12.5.2.8.1 Rest of Middle East Composite Packaging Market By Material
12.5.2.8.2 Rest of Middle East Composite Packaging Market By End-Use
12.5.3 Africa
12.5.3.1 Africa Composite Packaging Market by Country
12.5.3.2 Africa Composite Packaging Market By Material
12.5.3.3 Africa Composite Packaging Market By End-Use
12.5.3.4 Nigeria
12.5.3.4.1 Nigeria Composite Packaging Market By Material
12.5.3.4.2 Nigeria Composite Packaging Market By End-Use
12.5.3.5 South Africa
12.5.3.5.1 South Africa Composite Packaging Market By Material
12.5.3.5.2 South Africa Composite Packaging Market By End-Use
12.5.3.6 Rest of Africa
12.5.3.6.1 Rest of Africa Composite Packaging Market By Material
12.5.3.6.2 Rest of Africa Composite Packaging Market By End-Use
12.6 Latin America
12.6.1 Trend Analysis
12.6.2 Latin America Composite Packaging Market by Country
12.6.3 Latin America Composite Packaging Market By Material
12.6.4 Latin America Composite Packaging Market By End-Use
12.6.5 Brazil
12.6.5.1 Brazil Composite Packaging Market By Material
12.6.5.2 Brazil Composite Packaging Market By End-Use
12.6.6 Argentina
12.6.6.1 Argentina Composite Packaging Market By Material
12.6.6.2 Argentina Composite Packaging Market By End-Use
12.6.7 Colombia
12.6.7.1 Colombia Composite Packaging Market By Material
12.6.7.2 Colombia Composite Packaging Market By End-Use
12.6.8 Rest of Latin America
12.6.8.1 Rest of Latin America Composite Packaging Market By Material
12.6.8.2 Rest of Latin America Composite Packaging Market By End-Use
13. Company Profiles
13.1 Amcor (Switzerland)
13.1.1 Company Overview
13.1.2 Financial
13.1.3 Products/ Services Offered
13.1.4 SWOT Analysis
13.1.5 The SNS View
13.2 DS Smith (U.K.)
13.2.1 Company Overview
13.2.2 Financial
13.2.3 Products/ Services Offered
13.2.4 SWOT Analysis
13.2.5 The SNS View
13.3 Mondi (U.K.)
13.3.1 Company Overview
13.3.2 Financial
13.3.3 Products/ Services Offered
13.3.4 SWOT Analysis
13.3.5 The SNS View
13.4 Mondi (U.K.)
13.4.1 Company Overview
13.4.2 Financial
13.4.3 Products/ Services Offered
13.4.4 SWOT Analysis
13.4.5 The SNS View
13.5 Smurfit Kappa (Ireland)
13.5.1 Company Overview
13.5.2 Financial
13.5.3 Products/ Services Offered
13.5.4 SWOT Analysis
13.5.5 The SNS View
13.6 Sonoco Products Company (U.S.)
13.6.1 Company Overview
13.6.2 Financial
13.6.3 Products/ Services Offered
13.6.4 SWOT Analysis
13.6.5 The SNS View
13.7 Crown Holdings (U.S.)
13.7.1 Company Overview
13.7.2 Financial
13.7.3 Products/ Services Offered
13.7.4 SWOT Analysis
13.7.5 The SNS View
13.8 Tetra Pak
13.8.1 Company Overview
13.8.2 Financial
13.8.3 Products/ Services Offered
13.8.4 SWOT Analysis
13.8.5 The SNS View
13.9 International (Switzerland)
13.9.1 Company Overview
13.9.2 Financial
13.9.3 Products/ Services Offered
13.9.4 SWOT Analysis
13.9.5 The SNS View
13.10 Coveris Holdings (U.K.)
13.10.1 Company Overview
13.10.2 Financial
13.10.3 Products/ Services Offered
13.10.4 SWOT Analysis
13.10.5 The SNS View
14. Competitive Landscape
14.1 Competitive Benchmarking
14.2 Market Share Analysis
14.3 Recent Developments
14.3.1 Industry News
14.3.2 Company News
14.3.3 Mergers & Acquisitions
15. USE Cases And Best Practices
16. Conclusion
An accurate research report requires proper strategizing as well as implementation. There are multiple factors involved in the completion of good and accurate research report and selecting the best methodology to compete the research is the toughest part. Since the research reports we provide play a crucial role in any company’s decision-making process, therefore we at SNS Insider always believe that we should choose the best method which gives us results closer to reality. This allows us to reach at a stage wherein we can provide our clients best and accurate investment to output ratio.
Each report that we prepare takes a timeframe of 350-400 business hours for production. Starting from the selection of titles through a couple of in-depth brain storming session to the final QC process before uploading our titles on our website we dedicate around 350 working hours. The titles are selected based on their current market cap and the foreseen CAGR and growth.
The 5 steps process:
Step 1: Secondary Research:
Secondary Research or Desk Research is as the name suggests is a research process wherein, we collect data through the readily available information. In this process we use various paid and unpaid databases which our team has access to and gather data through the same. This includes examining of listed companies’ annual reports, Journals, SEC filling etc. Apart from this our team has access to various associations across the globe across different industries. Lastly, we have exchange relationships with various university as well as individual libraries.
Step 2: Primary Research
When we talk about primary research, it is a type of study in which the researchers collect relevant data samples directly, rather than relying on previously collected data. This type of research is focused on gaining content specific facts that can be sued to solve specific problems. Since the collected data is fresh and first hand therefore it makes the study more accurate and genuine.
We at SNS Insider have divided Primary Research into 2 parts.
Part 1 wherein we interview the KOLs of major players as well as the upcoming ones across various geographic regions. This allows us to have their view over the market scenario and acts as an important tool to come closer to the accurate market numbers. As many as 45 paid and unpaid primary interviews are taken from both the demand and supply side of the industry to make sure we land at an accurate judgement and analysis of the market.
This step involves the triangulation of data wherein our team analyses the interview transcripts, online survey responses and observation of on filed participants. The below mentioned chart should give a better understanding of the part 1 of the primary interview.
Part 2: In this part of primary research the data collected via secondary research and the part 1 of the primary research is validated with the interviews from individual consultants and subject matter experts.
Consultants are those set of people who have at least 12 years of experience and expertise within the industry whereas Subject Matter Experts are those with at least 15 years of experience behind their back within the same space. The data with the help of two main processes i.e., FGDs (Focused Group Discussions) and IDs (Individual Discussions). This gives us a 3rd party nonbiased primary view of the market scenario making it a more dependable one while collation of the data pointers.
Step 3: Data Bank Validation
Once all the information is collected via primary and secondary sources, we run that information for data validation. At our intelligence centre our research heads track a lot of information related to the market which includes the quarterly reports, the daily stock prices, and other relevant information. Our data bank server gets updated every fortnight and that is how the information which we collected using our primary and secondary information is revalidated in real time.
Step 4: QA/QC Process
After all the data collection and validation our team does a final level of quality check and quality assurance to get rid of any unwanted or undesired mistakes. This might include but not limited to getting rid of the any typos, duplication of numbers or missing of any important information. The people involved in this process include technical content writers, research heads and graphics people. Once this process is completed the title gets uploader on our platform for our clients to read it.
Step 5: Final QC/QA Process:
This is the last process and comes when the client has ordered the study. In this process a final QA/QC is done before the study is emailed to the client. Since we believe in giving our clients a good experience of our research studies, therefore, to make sure that we do not lack at our end in any way humanly possible we do a final round of quality check and then dispatch the study to the client.
By Material
Plastic
Paper & Paperboard
Metal
Others
By End-use
Food & Beverages
Healthcare
Consumer Goods
Logistics & Transportation
Others
Request for Segment Customization as per your Business Requirement: Segment Customization Request
REGIONAL COVERAGE:
North America
US
Canada
Mexico
Europe
Eastern Europe
Poland
Romania
Hungary
Turkey
Rest of Eastern Europe
Western Europe
Germany
France
UK
Italy
Spain
Netherlands
Switzerland
Austria
Rest of Western Europe
Asia Pacific
China
India
Japan
South Korea
Vietnam
Singapore
Australia
Rest of Asia Pacific
Middle East & Africa
Middle East
UAE
Egypt
Saudi Arabia
Qatar
Rest of the Middle East
Africa
Nigeria
South Africa
Rest of Africa
Latin America
Brazil
Argentina
Colombia
Rest of Latin America
Request for Country Level Research Report: Country Level Customization Request
Available Customization
With the given market data, SNS Insider offers customization as per the company’s specific needs. The following customization options are available for the report:
Product Analysis
Criss-Cross segment analysis (e.g. Product X Application)
Product Matrix which gives a detailed comparison of product portfolio of each company
Geographic Analysis
Additional countries in any of the regions
Company Information
Detailed analysis and profiling of additional market players (Up to five)
The Dunnage Packaging Market size was USD 4.08 billion in 2023 and is expected to Reach USD 6.55 billion by 2031 and grow at a CAGR of 6.1% over the forecast period of 2024-2031.
The Sustainable Plastic Packaging Market size was valued at USD 91.25 billion in 2023 and is expected to Reach USD 138.95 billion by 2031 and grow at a CAGR of 5.4% over the forecast period of 2024-2031.
The packaging printing market was valued at USD 399.84 billion in 2023 and projected to reach USD 604.55 billion by 2032, expanding CAGR 4.77% by 2032.
The Same-Day Delivery Market size was valued at USD 9.57 Bn in 2023 and is expected to reach USD 41.42 Bn by 2031 and grow at a CAGR of 20.1% over the forecast period 2024-2031.
The Beer Cans Market size was USD 12.75 billion in 2023 and is expected to reach USD 17.58 billion by 2031 and grow at a CAGR of 4.1% over the forecast period of 2024-2031.
The High Density Polyethylene Bottles (HDPE) Market size was USD 55.07 billion in 2023 and is expected to Reach USD 80.10 billion by 2031 and grow at a CAGR of 4.80% over the forecast period of 2024-2031.
Hi! Click one of our member below to chat on Phone