image

Commercial Vehicles Market Report Scope & Overview:

Commercial Vehicles Market Revenue Analysis

Get More Information on Commercial Vehicles Market - Request Sample Report

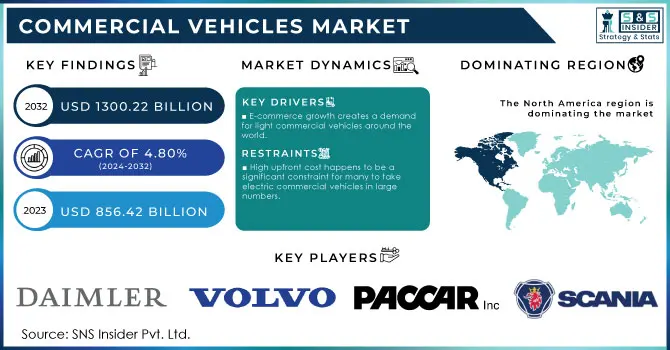
The Commercial Vehicles Market Size was valued at USD 856.42 Billion in 2023 and is expected to reach USD 1300.22 Billion by 2032 and grow at a CAGR of 4.80% over the forecast period 2024-2032.

Commercial vehicles in the international market are growing much faster than others. There is a higher demand in areas such as logistics, construction, and passenger transportation. In these sectors, commercial vehicles play a role in the form of LCVs, heavy trucks, and buses that provide the required transportation. New policy-making by the government in the United States has heavily impacted the market. The U.S. government's aim at reducing emission and transport with a sustainable future nudged incentives and more strict regulations towards automobile manufacturers to produce environmentally friendly commercial vehicles like electric Truck and hybrid trucks. The U.S. Environmental Protection Agency (EPA) standards for Phase 2 Greenhouse Gas Emissions from heavy-duty vehicles will cut CO2 by an estimated 1.3 billion metric tons by 2030. It is believed to force manufacturers toward more fuel-efficient designs, as accounts declare. This move has accelerated innovation, fueling the sector to take up greener technologies.
Some of the major technological advancements in the commercial vehicles sector include electric powertrain, advanced driver assistance systems, and autonomous driving technologies. The European Union has mandated that from 2024, all new commercial vehicles shall be equipped with advanced driver-assistance systems, including AEB and LDW. As a result, nearly 80% of new commercial vehicles sold in the EU, by 2023, carried an installed ADAS. Electric commercial vehicles, in themselves, are gaining popularity because of environmental concerns and lower operating costs. A lot of optimization also seems to happen in the usage of fleet management system through IoT and telematics that reduce downtime and enhance efficiency. Such technological progress will continue to propel the market in the future.

The market offers huge future opportunities, particularly in the United States, with industries taking advantage of this to replace aging fleets with more efficient and technologically advanced vehicles. In logistics, sales of electric commercial vehicles are likely to increase with the rapid development of e-commerce. Smart city initiatives and infrastructure development projects also provide growth opportunities for electric and autonomous buses in the urban transportation sector.

Commercial Vehicles Market Dynamics

Key Drivers:  

  • E-commerce growth creates a demand for light commercial vehicles around the world.

Through sheer leaps in e-commerce, there has been strong and rising demand for light commercial vehicles (LCVs) in last-mile delivery. This mainly happens in urban areas where deliveries become an issue if the transportation solution provided is not enough to keep pace with growing customer demands for on-time and efficient delivery services. This is due to increased volumes, and companies like Amazon and UPS are investing more in their fleet expansion. Electric LCVs are also in demand. This is not just an American phenomenon but an all-over-globe one. Both developed and emerging economies are on the lookout for commercial vehicles because of sustainable transportation initiatives.

  • Demand for electric commercial vehicles because of sustainable transportation initiatives.

Global policies provide for improving the standards of emission and increase the adoption of electric vehicles that would minimize carbon footprints. Such global policies created an empowering environment for adopting electric commercial vehicles, especially in regions such as the U.S. and Europe, where subsidies and tax incentives are available for companies adopting greener technologies.

For instance, California's Zero-Emission Vehicle mandate has forced a number of manufacturers to create electric trucks and buses. In California, they have a regulation stating that 100 percent of new sales of medium- and heavy-duty trucks sold in the state will be zero emission by 2035 to reduce pollution. There is the global development toward sustainable transport; this too will mean a move to more EVs and subsequently increases the demand for electric commercial vehicles.

Restraint

  • High upfront cost happens to be a significant constraint for many to take electric commercial vehicles in large numbers.

Definitely, the big challenge that holds back the commercial vehicles market, collectively and the electric ones, is the high initial cost. While electric trucks and buses offer long-term economies because of lower fuel and maintenance costs, higher acquisition prices are a big obstacle even to smaller businesses and fleets. Most importantly, the reason is a very expensive battery technology which makes electric trucks and buses costlier than the equivalents which run on an internal combustion.

The setting of charging infrastructure also adds to the financial burden. These factors further delay the speed of transition to electric commercial vehicles, especially in areas where any such government subsidy or incentive is scarce. The overall cost of owning these vehicles is very appealing over time but often not immediately apparent to companies focusing more on the short-term financial gains.

Commercial Vehicles Market Segmentation Overview

By Product

In 2023, LCVs had the highest market share of 74.61%. LCVs are used more for their flexibility in urban as well as suburban transport. Thus, they come in handy in very sectors like logistics and delivery. The increase in e-commerce has boosted the demand for LCVs. E-commerce companies are increasing at a rapid pace, and efficiently solving last-mile delivery problems in a significant number of its urban markets.

Buses & Coaches is likely to have the highest growth rate in forecasting years with a CAGR of 6.95% from 2024 to 2032. This can be because of the increased investments in public transport. There is a shift toward electric buses owing to sustainable urban mobility initiatives. Several countries are planning to create electric fleets of buses with an aim of reducing pollution and supporting green public transport solutions.

By End User

In 2023, logistics held the largest market share of 28.09%. This market growth is due to increased demand in logistic services due to high e-commerce growth and the urgent need for more efficient transport and distribution networks that required commercial vehicles in logistics. This sector, however, sees usage of LCVs increase with the rise in the number of last-mile delivery services.

Passenger transportation, however, is expected to grow at the fastest clip in the forecast period, growing at a CAGR of 6.41% during 2024-2032. This is led by wide adoption of electric buses in urban landscapes, smart city initiatives, and rising efforts to cut down traffic congestion through public transport initiatives. Many countries have taken up a focus on electrifying their public transport fleets, thereby bolstering the demand for electric buses and coaches.

Commercial Vehicles Market Regional Analysis

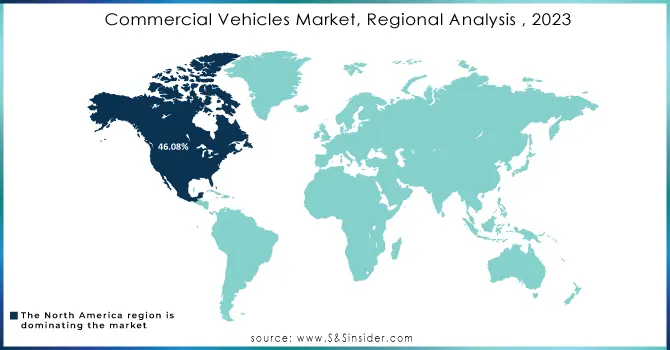
The North America region had the largest share in 2023 at 46.08% in the Commercial Vehicles Market. In 2024, US sales is going to be highest with 11,630k vehicles units. This is because of the immense usage of commercial vehicles in most logistics, construction, and public transportation sectors within the same region. Strong adherence to strict emissions regulation coupled with an increasing trend in electric commercial vehicles in the U.S. has triggered the growth in this market.

Asia-Pacific is likely to be the most rapidly growing region in terms of CAGR from 2024 to 2032 at 6.08%. Unit sales in the Commercial Vehicles market in Asia is expected to reach 7.09 Million vehicles in 2024. Factors related to rapid urbanization and increasing industrial activities, among others, are promoting growth in the region coupled with the boom in e-commerce, which is also improving demand for commercial vehicles, especially in China and India. In addition, the adoption of electric vehicles in this region will further boost the growth in this market even more.
Commercial-Vehicles-Market-Regional-Analysis--2023

Need Any Customization Research On Commercial Vehicles Market - Inquiry Now

Key Players in Commercial Vehicles Market

Some of the major players in the Commercial Vehicles Market are  

  • Daimler AG (Freightliner Trucks, Mercedes-Benz Vans)

  • Volvo Group (Volvo Trucks, Mack Trucks)

  • PACCAR Inc. (Kenworth, Peterbilt)

  • Navistar International Corporation (International Trucks, IC Bus)

  • Scania AB (Heavy Trucks, Buses)

  • Ford Motor Company (Ford Transit, Ford F-Series)

  • Toyota Motor Corporation (Toyota Hilux, Hino Trucks)

  • General Motors Company (GMC Sierra)

  • Fiat Chrysler Automobiles (RAM Trucks, Fiat Professional)

  • Tata Motors Limited (Tata Prima, Tata Xenon)

  • Isuzu Motors Ltd. (Isuzu D-Max, Isuzu N-Series)

  • Mitsubishi Fuso Truck and Bus Corporation (Canter Trucks, Fuso Buses)

  • Hyundai Motor Company (Hyundai HD Trucks, Hyundai H350)

  • MAN SE (MAN Trucks, MAN Buses)

  • Ashok Leyland (Dost, U Truck)

  • Mahindra & Mahindra Ltd. (Bolero Pik-Up, Mahindra Blazo)

  • BYD Company Ltd. (Electric Buses, Electric Trucks)

  • Iveco S.p.A. (Daily Vans, Stralis Trucks)

  • Nissan Motor Co., Ltd. (Nissan NV Vans, Nissan Titan)

  • Rivian Automotive (Electric Delivery Vans, Electric Pickup Trucks)

Recent Trends

  • May 2024: Daimler Truck is pushing toward a future of driverless rides down US roads – and has dropped a big hint as to what's in store. It unveiled the self-driving Freightliner eCascadia technology demonstrator, which is one of the largest makers of commercial vehicles around the world, and it aims to demonstrate combined electric propulsion and self-driving tech.

  • September 2024: The 120-year-old truck manufacturer Navistar has rebranded under International Motors-a move the leaders of the OEM said marked a strategic shift toward providing fully comprehensive fleet and transportation solutions. According to them, the brand's evolution will therefore represent the broader transformation since Traton took it over in 2021.

  • September 2024: Mahindra & Mahindra Ltd. is one of the leading automotive companies operating in India. Today, the Company has announced its overall auto sales of the month of September 2024. The company reflects overall positive growth in its sales with 24 percent year over year, but decent increase has been noted in the commercial vehicle segment. In total, a total sales volume of 87,839 units were recorded.

Commercial Vehicles Market Report Scope

Report Attributes Details
Market Size in 2023 US$ 856.42 Billion
Market Size by 2032 US$ 1300.22 Billion
CAGR CAGR of 4.80 % From 2024 to 2032
Base Year 2023
Forecast Period 2024-2032
Historical Data 2020-2022
Report Scope & Coverage Market Size, Segments Analysis, Competitive  Landscape, Regional Analysis, DROC & SWOT Analysis, Forecast Outlook
Key Segments • By Product (Light Commercial Vehicles (LCVs), Buses & Coaches, and Heavy Trucks)
• By End-user (Industrial, Mining & Construction, Passenger Transportation, Logistics, and Others)
• By Propulsion Type (IC Engine, Hybrid, Electric Vehicle)
Regional Analysis/Coverage North America (US, Canada, Mexico), Europe (Eastern Europe [Poland, Romania, Hungary, Turkey, Rest of Eastern Europe] Western Europe] Germany, France, UK, Italy, Spain, Netherlands, Switzerland, Austria, Rest of Western Europe]), Asia Pacific (China, India, Japan, South Korea, Vietnam, Singapore, Australia, Rest of Asia Pacific), Middle East & Africa (Middle East [UAE, Egypt, Saudi Arabia, Qatar, Rest of Middle East], Africa [Nigeria, South Africa, Rest of Africa], Latin America (Brazil, Argentina, Colombia, Rest of Latin America)
Company Profiles Daimler AG, Volvo Group, PACCAR Inc., Navistar International Corporation, Scania AB, Ford Motor Company, Toyota Motor Corporation, General Motors Company, Fiat Chrysler Automobiles, Tata Motors Limited, Isuzu Motors Ltd., Mitsubishi Fuso Truck and Bus Corporation, Hyundai Motor Company, MAN SE, Ashok Leyland, Mahindra & Mahindra Ltd., BYD Company Ltd., Iveco S.p.A., Nissan Motor Co., Ltd., Rivian Automotive.
Key Drivers • E-commerce growth creates a demand for light commercial vehicles around the world.
• Demand for electric commercial vehicles because of sustainable transportation initiatives.
Restraints • High upfront cost happens to be a significant constraint for many to take electric commercial vehicles in large numbers.

Frequently Asked Questions

Ans: The Commercial Vehicles Market is expected to grow at a CAGR of 4.80% during 2024-2032.

Ans: Commercial Vehicles Market size was USD 856.42 Billion in 2023 and is expected to Reach USD 1300.22 Billion by 2032.

Ans: The major growth factors of the Commercial Vehicles Market are E-commerce growth and Demand for electric commercial vehicles.

Ans: The LCVs segment dominated the Commercial Vehicles Market.

Ans: North America dominated the Commercial Vehicles Market in 2023.

Table Of Contents:

1. Introduction

1.1 Market Definition

1.2 Scope (Inclusion and Exclusions)

1.3 Research Assumptions

2. Executive Summary

2.1 Market Overview

2.2 Regional Synopsis

2.3 Competitive Summary

3. Research Methodology

3.1 Top-Down Approach

3.2 Bottom-up Approach

3.3. Data Validation

3.4 Primary Interviews

4. Market Dynamics Impact Analysis

4.1 Market Driving Factors Analysis

4.1.1 Drivers

4.1.2 Restraints

4.1.3 Opportunities

4.1.4 Challenges

4.2 PESTLE Analysis

4.3 Porter’s Five Forces Model

5. Statistical Insights and Trends Reporting

5.1 Vehicle Production and Sales Volumes, 2020-2032, by Region

5.2 Emission Standards Compliance, by Region

5.3 Vehicle Technology Adoption, by Region

5.4 Consumer Preferences, by Region

5.5 Aftermarket Trends (Data on vehicle maintenance, parts, and services)

6. Competitive Landscape

6.1 List of Major Companies, By Region

6.2 Market Share Analysis, By Region

6.3 Product Benchmarking

6.3.1 Product specifications and features

6.3.2 Pricing

6.4 Strategic Initiatives

6.4.1 Marketing and promotional activities

6.4.2 Distribution and Supply Chain Strategies

6.4.3 Expansion plans and new product launches

6.4.4 Strategic partnerships and collaborations

6.5 Technological Advancements

6.6 Market Positioning and Branding

7. Commercial Vehicles Market Segmentation, By Product

7.1 Chapter Overview

7.2 Light Commercial Vehicles

7.2.1 Light Commercial Vehicles Market Trends Analysis (2020-2032)

7.2.2 Light Commercial Vehicles Market Size Estimates and Forecasts to 2032 (USD Billion)

7.3 Buses & Coaches

7.3.1 Buses & Coaches Market Trends Analysis (2020-2032)

7.3.2 Buses & Coaches Market Size Estimates and Forecasts to 2032 (USD Billion)

7.4 Heavy Trucks

7.4.1 Heavy Trucks Market Trends Analysis (2020-2032)

7.4.2 Heavy Trucks Market Size Estimates and Forecasts to 2032 (USD Billion)

8. Commercial Vehicles Market Segmentation, By End User

     8.1 Chapter Overview

8.2 Industrial

8.2.1 Industrial Market Trends Analysis (2020-2032)

8.2.2 Industrial Market Size Estimates and Forecasts to 2032 (USD Billion)

8.3 Mining & Construction

8.3.1 Mining & Construction Market Trends Analysis (2020-2032)

8.3.2 Mining & Construction Market Size Estimates and Forecasts to 2032 (USD Billion)

8.4 Passenger Transportation

8.4.1 Passenger Transportation Market Trends Analysis (2020-2032)

8.4.2 Passenger Transportation Market Size Estimates and Forecasts to 2032 (USD Billion)

8.5 Logistics

8.5.1 Logistics Market Trends Analysis (2020-2032)

8.5.2 Logistics Market Size Estimates and Forecasts to 2032 (USD Billion)

8.6 Others

8.6.1 Others Market Trends Analysis (2020-2032)

8.6.2 Others Market Size Estimates and Forecasts to 2032 (USD Billion)

9. Commercial Vehicles Market Segmentation, By Propulsion Type

     9.1 Chapter Overview

9.2 IC Engine Search

9.2.1 IC Engine Search Market Trends Analysis (2020-2032)

9.2.2 IC Engine Search Market Size Estimates and Forecasts to 2032 (USD Billion)

9.3 Hybrid

9.3.1 Hybrid Market Trends Analysis (2020-2032)

9.3.2 Hybrid Market Size Estimates and Forecasts to 2032 (USD Billion)

9.3 Electric Vehicle

9.3.1 Electric Vehicle Market Trends Analysis (2020-2032)

9.3.2 Electric Vehicle Market Size Estimates and Forecasts to 2032 (USD Billion)

10. Regional Analysis

10.1 Chapter Overview

10.2 North America

10.2.1 Trends Analysis

10.2.2 North America Commercial Vehicles Market Estimates and Forecasts, by Country (2020-2032) (USD Billion)

10.2.3 North America Commercial Vehicles Market Estimates and Forecasts, By Propulsion Type (2020-2032) (USD Billion)  

10.2.4 North America Commercial Vehicles Market Estimates and Forecasts, By Product (2020-2032) (USD Billion)

10.2.5 North America Commercial Vehicles Market Estimates and Forecasts, By End User (2020-2032) (USD Billion)

10.2.6 USA

10.2.6.1 USA Commercial Vehicles Market Estimates and Forecasts, By Propulsion Type (2020-2032) (USD Billion)

10.2.6.2 USA Commercial Vehicles Market Estimates and Forecasts, By Product (2020-2032) (USD Billion)

10.2.6.3 USA Commercial Vehicles Market Estimates and Forecasts, By End User (2020-2032) (USD Billion)

10.2.7 Canada

10.2.7.1 Canada Commercial Vehicles Market Estimates and Forecasts, By Propulsion Type (2020-2032) (USD Billion)

10.2.7.2 Canada Commercial Vehicles Market Estimates and Forecasts, By Product (2020-2032) (USD Billion)

10.2.7.3 Canada Commercial Vehicles Market Estimates and Forecasts, By End User (2020-2032) (USD Billion)

10.2.8 Mexico

10.2.8.1 Mexico Commercial Vehicles Market Estimates and Forecasts, By Propulsion Type (2020-2032) (USD Billion)

10.2.8.2 Mexico Commercial Vehicles Market Estimates and Forecasts, By Product (2020-2032) (USD Billion)

10.2.8.3 Mexico Commercial Vehicles Market Estimates and Forecasts, By End User (2020-2032) (USD Billion)

10.3 Europe

10.3.1 Eastern Europe

10.3.1.1 Trends Analysis

10.3.1.2 Eastern Europe Commercial Vehicles Market Estimates and Forecasts, by Country (2020-2032) (USD Billion)

10.3.1.3 Eastern Europe Commercial Vehicles Market Estimates and Forecasts, By Propulsion Type (2020-2032) (USD Billion)  

10.3.1.4 Eastern Europe Commercial Vehicles Market Estimates and Forecasts, By Product (2020-2032) (USD Billion)

10.3.1.5 Eastern Europe Commercial Vehicles Market Estimates and Forecasts, By End User (2020-2032) (USD Billion)

10.3.1.6 Poland

10.3.1.6.1 Poland Commercial Vehicles Market Estimates and Forecasts, By Propulsion Type (2020-2032) (USD Billion)

10.3.1.6.2 Poland Commercial Vehicles Market Estimates and Forecasts, By Product (2020-2032) (USD Billion)

10.3.1.6.3 Poland Commercial Vehicles Market Estimates and Forecasts, By End User (2020-2032) (USD Billion)

10.3.1.7 Romania

10.3.1.7.1 Romania Commercial Vehicles Market Estimates and Forecasts, By Propulsion Type (2020-2032) (USD Billion)

10.3.1.7.2 Romania Commercial Vehicles Market Estimates and Forecasts, By Product (2020-2032) (USD Billion)

10.3.1.7.3 Romania Commercial Vehicles Market Estimates and Forecasts, By End User (2020-2032) (USD Billion)

10.3.1.8 Hungary

10.3.1.8.1 Hungary Commercial Vehicles Market Estimates and Forecasts, By Propulsion Type (2020-2032) (USD Billion)

10.3.1.8.2 Hungary Commercial Vehicles Market Estimates and Forecasts, By Product (2020-2032) (USD Billion)

10.3.1.8.3 Hungary Commercial Vehicles Market Estimates and Forecasts, By End User (2020-2032) (USD Billion)

10.3.1.9 Turkey

10.3.1.9.1 Turkey Commercial Vehicles Market Estimates and Forecasts, By Propulsion Type (2020-2032) (USD Billion)

10.3.1.9.2 Turkey Commercial Vehicles Market Estimates and Forecasts, By Product (2020-2032) (USD Billion)

10.3.1.9.3 Turkey Commercial Vehicles Market Estimates and Forecasts, By End User (2020-2032) (USD Billion)

10.3.1.10 Rest of Eastern Europe

10.3.1.10.1 Rest of Eastern Europe Commercial Vehicles Market Estimates and Forecasts, By Propulsion Type (2020-2032) (USD Billion)

10.3.1.10.2 Rest of Eastern Europe Commercial Vehicles Market Estimates and Forecasts, By Product (2020-2032) (USD Billion)

10.3.1.10.3 Rest of Eastern Europe Commercial Vehicles Market Estimates and Forecasts, By End User (2020-2032) (USD Billion)

10.3.2 Western Europe

10.3.2.1 Trends Analysis

10.3.2.2 Western Europe Commercial Vehicles Market Estimates and Forecasts, by Country (2020-2032) (USD Billion)

10.3.2.3 Western Europe Commercial Vehicles Market Estimates and Forecasts, By Propulsion Type (2020-2032) (USD Billion)  

10.3.2.4 Western Europe Commercial Vehicles Market Estimates and Forecasts, By Product (2020-2032) (USD Billion)

10.3.2.5 Western Europe Commercial Vehicles Market Estimates and Forecasts, By End User (2020-2032) (USD Billion)

10.3.2.6 Germany

10.3.2.6.1 Germany Commercial Vehicles Market Estimates and Forecasts, By Propulsion Type (2020-2032) (USD Billion)

10.3.2.6.2 Germany Commercial Vehicles Market Estimates and Forecasts, By Product (2020-2032) (USD Billion)

10.3.2.6.3 Germany Commercial Vehicles Market Estimates and Forecasts, By End User (2020-2032) (USD Billion)

10.3.2.7 France

10.3.2.7.1 France Commercial Vehicles Market Estimates and Forecasts, By Propulsion Type (2020-2032) (USD Billion)

10.3.2.7.2 France Commercial Vehicles Market Estimates and Forecasts, By Product (2020-2032) (USD Billion)

10.3.2.7.3 France Commercial Vehicles Market Estimates and Forecasts, By End User (2020-2032) (USD Billion)

10.3.2.8 UK

10.3.2.8.1 UK Commercial Vehicles Market Estimates and Forecasts, By Propulsion Type (2020-2032) (USD Billion)

10.3.2.8.2 UK Commercial Vehicles Market Estimates and Forecasts, By Product (2020-2032) (USD Billion)

10.3.2.8.3 UK Commercial Vehicles Market Estimates and Forecasts, By End User (2020-2032) (USD Billion)

10.3.2.9 Italy

10.3.2.9.1 Italy Commercial Vehicles Market Estimates and Forecasts, By Propulsion Type (2020-2032) (USD Billion)

10.3.2.9.2 Italy Commercial Vehicles Market Estimates and Forecasts, By Product (2020-2032) (USD Billion)

10.3.2.9.3 Italy Commercial Vehicles Market Estimates and Forecasts, By End User (2020-2032) (USD Billion)

10.3.2.10 Spain

10.3.2.10.1 Spain Commercial Vehicles Market Estimates and Forecasts, By Propulsion Type (2020-2032) (USD Billion)

10.3.2.10.2 Spain Commercial Vehicles Market Estimates and Forecasts, By Product (2020-2032) (USD Billion)

10.3.2.10.3 Spain Commercial Vehicles Market Estimates and Forecasts, By End User (2020-2032) (USD Billion)

10.3.2.11 Netherlands

10.3.2.11.1 Netherlands Commercial Vehicles Market Estimates and Forecasts, By Propulsion Type (2020-2032) (USD Billion)

10.3.2.11.2 Netherlands Commercial Vehicles Market Estimates and Forecasts, By Product (2020-2032) (USD Billion)

10.3.2.11.3 Netherlands Commercial Vehicles Market Estimates and Forecasts, By End User (2020-2032) (USD Billion)

10.3.2.12 Switzerland

10.3.2.12.1 Switzerland Commercial Vehicles Market Estimates and Forecasts, By Propulsion Type (2020-2032) (USD Billion)

10.3.2.12.2 Switzerland Commercial Vehicles Market Estimates and Forecasts, By Product (2020-2032) (USD Billion)

10.3.2.12.3 Switzerland Commercial Vehicles Market Estimates and Forecasts, By End User (2020-2032) (USD Billion)

10.3.2.13 Austria

10.3.2.13.1 Austria Commercial Vehicles Market Estimates and Forecasts, By Propulsion Type (2020-2032) (USD Billion)

10.3.2.13.2 Austria Commercial Vehicles Market Estimates and Forecasts, By Product (2020-2032) (USD Billion)

10.3.2.13.3 Austria Commercial Vehicles Market Estimates and Forecasts, By End User (2020-2032) (USD Billion)

10.3.2.14 Rest of Western Europe

10.3.2.14.1 Rest of Western Europe Commercial Vehicles Market Estimates and Forecasts, By Propulsion Type (2020-2032) (USD Billion)

10.3.2.14.2 Rest of Western Europe Commercial Vehicles Market Estimates and Forecasts, By Product (2020-2032) (USD Billion)

10.3.2.14.3 Rest of Western Europe Commercial Vehicles Market Estimates and Forecasts, By End User (2020-2032) (USD Billion)

10.4 Asia Pacific

10.4.1 Trends Analysis

10.4.2 Asia Pacific Commercial Vehicles Market Estimates and Forecasts, by Country (2020-2032) (USD Billion)

10.4.3 Asia Pacific Commercial Vehicles Market Estimates and Forecasts, By Propulsion Type (2020-2032) (USD Billion)  

10.4.4 Asia Pacific Commercial Vehicles Market Estimates and Forecasts, By Product (2020-2032) (USD Billion)

10.4.5 Asia Pacific Commercial Vehicles Market Estimates and Forecasts, By End User (2020-2032) (USD Billion)

10.4.6 China

10.4.6.1 China Commercial Vehicles Market Estimates and Forecasts, By Propulsion Type (2020-2032) (USD Billion)

10.4.6.2 China Commercial Vehicles Market Estimates and Forecasts, By Product (2020-2032) (USD Billion)

10.4.6.3 China Commercial Vehicles Market Estimates and Forecasts, By End User (2020-2032) (USD Billion)

10.4.7 India

10.4.7.1 India Commercial Vehicles Market Estimates and Forecasts, By Propulsion Type (2020-2032) (USD Billion)

10.4.7.2 India Commercial Vehicles Market Estimates and Forecasts, By Product (2020-2032) (USD Billion)

10.4.7.3 India Commercial Vehicles Market Estimates and Forecasts, By End User (2020-2032) (USD Billion)

10.4.8 Japan

10.4.8.1 Japan Commercial Vehicles Market Estimates and Forecasts, By Propulsion Type (2020-2032) (USD Billion)

10.4.8.2 Japan Commercial Vehicles Market Estimates and Forecasts, By Product (2020-2032) (USD Billion)

10.4.8.3 Japan Commercial Vehicles Market Estimates and Forecasts, By End User (2020-2032) (USD Billion)

10.4.9 South Korea

10.4.9.1 South Korea Commercial Vehicles Market Estimates and Forecasts, By Propulsion Type (2020-2032) (USD Billion)

10.4.9.2 South Korea Commercial Vehicles Market Estimates and Forecasts, By Product (2020-2032) (USD Billion)

10.4.9.3 South Korea Commercial Vehicles Market Estimates and Forecasts, By End User (2020-2032) (USD Billion)

10.4.10 Vietnam

10.4.10.1 Vietnam Commercial Vehicles Market Estimates and Forecasts, By Propulsion Type (2020-2032) (USD Billion)

10.4.10.2 Vietnam Commercial Vehicles Market Estimates and Forecasts, By Product (2020-2032) (USD Billion)

10.4.10.3 Vietnam Commercial Vehicles Market Estimates and Forecasts, By End User (2020-2032) (USD Billion)

10.4.11 Singapore

10.4.11.1 Singapore Commercial Vehicles Market Estimates and Forecasts, By Propulsion Type (2020-2032) (USD Billion)

10.4.11.2 Singapore Commercial Vehicles Market Estimates and Forecasts, By Product (2020-2032) (USD Billion)

10.4.11.3 Singapore Commercial Vehicles Market Estimates and Forecasts, By End User (2020-2032) (USD Billion)

10.4.12 Australia

10.4.12.1 Australia Commercial Vehicles Market Estimates and Forecasts, By Propulsion Type (2020-2032) (USD Billion)

10.4.12.2 Australia Commercial Vehicles Market Estimates and Forecasts, By Product (2020-2032) (USD Billion)

10.4.12.3 Australia Commercial Vehicles Market Estimates and Forecasts, By End User (2020-2032) (USD Billion)

10.4.13 Rest of Asia Pacific

10.4.13.1 Rest of Asia Pacific Commercial Vehicles Market Estimates and Forecasts, By Propulsion Type (2020-2032) (USD Billion)

10.4.13.2 Rest of Asia Pacific Commercial Vehicles Market Estimates and Forecasts, By Product (2020-2032) (USD Billion)

10.4.13.3 Rest of Asia Pacific Commercial Vehicles Market Estimates and Forecasts, By End User (2020-2032) (USD Billion)

10.5 Middle East and Africa

10.5.1 Middle East

10.5.1.1 Trends Analysis

10.5.1.2 Middle East Commercial Vehicles Market Estimates and Forecasts, by Country (2020-2032) (USD Billion)

10.5.1.3 Middle East Commercial Vehicles Market Estimates and Forecasts, By Propulsion Type (2020-2032) (USD Billion)  

10.5.1.4 Middle East Commercial Vehicles Market Estimates and Forecasts, By Product (2020-2032) (USD Billion)

10.5.1.5 Middle East Commercial Vehicles Market Estimates and Forecasts, By End User (2020-2032) (USD Billion)

10.5.1.6 UAE

10.5.1.6.1 UAE Commercial Vehicles Market Estimates and Forecasts, By Propulsion Type (2020-2032) (USD Billion)

10.5.1.6.2 UAE Commercial Vehicles Market Estimates and Forecasts, By Product (2020-2032) (USD Billion)

10.5.1.6.3 UAE Commercial Vehicles Market Estimates and Forecasts, By End User (2020-2032) (USD Billion)

10.5.1.7 Egypt

10.5.1.7.1 Egypt Commercial Vehicles Market Estimates and Forecasts, By Propulsion Type (2020-2032) (USD Billion)

10.5.1.7.2 Egypt Commercial Vehicles Market Estimates and Forecasts, By Product (2020-2032) (USD Billion)

10.5.1.7.3 Egypt Commercial Vehicles Market Estimates and Forecasts, By End User (2020-2032) (USD Billion)

10.5.1.8 Saudi Arabia

10.5.1.8.1 Saudi Arabia Commercial Vehicles Market Estimates and Forecasts, By Propulsion Type (2020-2032) (USD Billion)

10.5.1.8.2 Saudi Arabia Commercial Vehicles Market Estimates and Forecasts, By Product (2020-2032) (USD Billion)

10.5.1.8.3 Saudi Arabia Commercial Vehicles Market Estimates and Forecasts, By End User (2020-2032) (USD Billion)

10.5.1.9 Qatar

10.5.1.9.1 Qatar Commercial Vehicles Market Estimates and Forecasts, By Propulsion Type (2020-2032) (USD Billion)

10.5.1.9.2 Qatar Commercial Vehicles Market Estimates and Forecasts, By Product (2020-2032) (USD Billion)

10.5.1.9.3 Qatar Commercial Vehicles Market Estimates and Forecasts, By End User (2020-2032) (USD Billion)

10.5.1.10 Rest of Middle East

10.5.1.10.1 Rest of Middle East Commercial Vehicles Market Estimates and Forecasts, By Propulsion Type (2020-2032) (USD Billion)

10.5.1.10.2 Rest of Middle East Commercial Vehicles Market Estimates and Forecasts, By Product (2020-2032) (USD Billion)

10.5.1.10.3 Rest of Middle East Commercial Vehicles Market Estimates and Forecasts, By End User (2020-2032) (USD Billion)

10.5.2 Africa

10.5.2.1 Trends Analysis

10.5.2.2 Africa Commercial Vehicles Market Estimates and Forecasts, by Country (2020-2032) (USD Billion)

10.5.2.3 Africa Commercial Vehicles Market Estimates and Forecasts, By Propulsion Type (2020-2032) (USD Billion)  

10.5.2.4 Africa Commercial Vehicles Market Estimates and Forecasts, By Product (2020-2032) (USD Billion)

10.5.2.5 Africa Commercial Vehicles Market Estimates and Forecasts, By End User (2020-2032) (USD Billion)

10.5.2.6 South Africa

10.5.2.6.1 South Africa Commercial Vehicles Market Estimates and Forecasts, By Propulsion Type (2020-2032) (USD Billion)

10.5.2.6.2 South Africa Commercial Vehicles Market Estimates and Forecasts, By Product (2020-2032) (USD Billion)

10.5.2.6.3 South Africa Commercial Vehicles Market Estimates and Forecasts, By End User (2020-2032) (USD Billion)

10.5.2.7 Nigeria

10.5.2.7.1 Nigeria Commercial Vehicles Market Estimates and Forecasts, By Propulsion Type (2020-2032) (USD Billion)

10.5.2.7.2 Nigeria Commercial Vehicles Market Estimates and Forecasts, By Product (2020-2032) (USD Billion)

10.5.2.7.3 Nigeria Commercial Vehicles Market Estimates and Forecasts, By End User (2020-2032) (USD Billion)

10.5.2.8 Rest of Africa

10.5.2.8.1 Rest of Africa Commercial Vehicles Market Estimates and Forecasts, By Propulsion Type (2020-2032) (USD Billion)

10.5.2.8.2 Rest of Africa Commercial Vehicles Market Estimates and Forecasts, By Product (2020-2032) (USD Billion)

10.5.2.8.3 Rest of Africa Commercial Vehicles Market Estimates and Forecasts, By End User (2020-2032) (USD Billion)

10.6 Latin America

10.6.1 Trends Analysis

10.6.2 Latin America Commercial Vehicles Market Estimates and Forecasts, by Country (2020-2032) (USD Billion)

10.6.3 Latin America Commercial Vehicles Market Estimates and Forecasts, By Propulsion Type (2020-2032) (USD Billion)  

10.6.4 Latin America Commercial Vehicles Market Estimates and Forecasts, By Product (2020-2032) (USD Billion)

10.6.5 Latin America Commercial Vehicles Market Estimates and Forecasts, By End User (2020-2032) (USD Billion)

10.6.6 Brazil

10.6.6.1 Brazil Commercial Vehicles Market Estimates and Forecasts, By Propulsion Type (2020-2032) (USD Billion)

10.6.6.2 Brazil Commercial Vehicles Market Estimates and Forecasts, By Product (2020-2032) (USD Billion)

10.6.6.3 Brazil Commercial Vehicles Market Estimates and Forecasts, By End User (2020-2032) (USD Billion)

10.6.7 Argentina

10.6.7.1 Argentina Commercial Vehicles Market Estimates and Forecasts, By Propulsion Type (2020-2032) (USD Billion)

10.6.7.2 Argentina Commercial Vehicles Market Estimates and Forecasts, By Product (2020-2032) (USD Billion)

10.6.7.3 Argentina Commercial Vehicles Market Estimates and Forecasts, By End User (2020-2032) (USD Billion)

10.6.8 Colombia

10.6.8.1 Colombia Commercial Vehicles Market Estimates and Forecasts, By Propulsion Type (2020-2032) (USD Billion)

10.6.8.2 Colombia Commercial Vehicles Market Estimates and Forecasts, By Product (2020-2032) (USD Billion)

10.6.8.3 Colombia Commercial Vehicles Market Estimates and Forecasts, By End User (2020-2032) (USD Billion)

10.6.9 Rest of Latin America

10.6.9.1 Rest of Latin America Commercial Vehicles Market Estimates and Forecasts, By Propulsion Type (2020-2032) (USD Billion)

10.6.9.2 Rest of Latin America Commercial Vehicles Market Estimates and Forecasts, By Product (2020-2032) (USD Billion)

10.6.9.3 Rest of Latin America Commercial Vehicles Market Estimates and Forecasts, By End User (2020-2032) (USD Billion)

11. Company Profiles

11.1 Daimler AG

11.1.1 Company Overview

11.1.2 Financial

11.1.3 Products/ Services Offered

11.1.4 SWOT Analysis

11.2 Volvo Group

11.2.1 Company Overview

11.2.2 Financial

11.2.3 Products/ Services Offered

11.2.4 SWOT Analysis

11.3 PACCAR Inc.

11.3.1 Company Overview

11.3.2 Financial

11.3.3 Products/ Services Offered

11.3.4 SWOT Analysis

11.4 Navistar International Corporation

11.4.1 Company Overview

11.4.2 Financial

11.4.3 Products/ Services Offered

11.4.4 SWOT Analysis

11.5 Scania AB

11.5.1 Company Overview

11.5.2 Financial

11.5.3 Products/ Services Offered

11.5.4 SWOT Analysis

11.6 Ford Motor Company

11.6.1 Company Overview

11.6.2 Financial

11.6.3 Products/ Services Offered

11.6.4 SWOT Analysis

11.7 Toyota Motor Corporation

11.7.1 Company Overview

11.7.2 Financial

11.7.3 Products/ Services Offered

11.7.4 SWOT Analysis

11.8 General Motors Company

11.8.1 Company Overview

11.8.2 Financial

11.8.3 Products/ Services Offered

11.8.4 SWOT Analysis

11.9 Fiat Chrysler Automobiles

11.9.1 Company Overview

11.9.2 Financial

11.9.3 Products/ Services Offered

11.9.4 SWOT Analysis

11.10 Tata Motors Limited

11.10.1 Company Overview

11.10.2 Financial

11.10.3 Products/ Services Offered

11.10.4 SWOT Analysis

12. Use Cases and Best Practices

13. Conclusion

An accurate research report requires proper strategizing as well as implementation. There are multiple factors involved in the completion of good and accurate research report and selecting the best methodology to compete the research is the toughest part. Since the research reports we provide play a crucial role in any company’s decision-making process, therefore we at SNS Insider always believe that we should choose the best method which gives us results closer to reality. This allows us to reach at a stage wherein we can provide our clients best and accurate investment to output ratio.

Each report that we prepare takes a timeframe of 350-400 business hours for production. Starting from the selection of titles through a couple of in-depth brain storming session to the final QC process before uploading our titles on our website we dedicate around 350 working hours. The titles are selected based on their current market cap and the foreseen CAGR and growth.


The 5 steps process:

Step 1: Secondary Research:

Secondary Research or Desk Research is as the name suggests is a research process wherein, we collect data through the readily available information. In this process we use various paid and unpaid databases which our team has access to and gather data through the same. This includes examining of listed companies’ annual reports, Journals, SEC filling etc. Apart from this our team has access to various associations across the globe across different industries. Lastly, we have exchange relationships with various university as well as individual libraries.

Secondary Research

Step 2: Primary Research

When we talk about primary research, it is a type of study in which the researchers collect relevant data samples directly, rather than relying on previously collected data.  This type of research is focused on gaining content specific facts that can be sued to solve specific problems. Since the collected data is fresh and first hand therefore it makes the study more accurate and genuine.

We at SNS Insider have divided Primary Research into 2 parts.

Part 1 wherein we interview the KOLs of major players as well as the upcoming ones across various geographic regions. This allows us to have their view over the market scenario and acts as an important tool to come closer to the accurate market numbers. As many as 45 paid and unpaid primary interviews are taken from both the demand and supply side of the industry to make sure we land at an accurate judgement and analysis of the market.

This step involves the triangulation of data wherein our team analyses the interview transcripts, online survey responses and observation of on filed participants. The below mentioned chart should give a better understanding of the part 1 of the primary interview.

Primary Research

Part 2: In this part of primary research the data collected via secondary research and the part 1 of the primary research is validated with the interviews from individual consultants and subject matter experts.

Consultants are those set of people who have at least 12 years of experience and expertise within the industry whereas Subject Matter Experts are those with at least 15 years of experience behind their back within the same space. The data with the help of two main processes i.e., FGDs (Focused Group Discussions) and IDs (Individual Discussions). This gives us a 3rd party nonbiased primary view of the market scenario making it a more dependable one while collation of the data pointers.

Step 3: Data Bank Validation

Once all the information is collected via primary and secondary sources, we run that information for data validation. At our intelligence centre our research heads track a lot of information related to the market which includes the quarterly reports, the daily stock prices, and other relevant information. Our data bank server gets updated every fortnight and that is how the information which we collected using our primary and secondary information is revalidated in real time.

Data Bank Validation

Step 4: QA/QC Process

After all the data collection and validation our team does a final level of quality check and quality assurance to get rid of any unwanted or undesired mistakes. This might include but not limited to getting rid of the any typos, duplication of numbers or missing of any important information. The people involved in this process include technical content writers, research heads and graphics people. Once this process is completed the title gets uploader on our platform for our clients to read it.

Step 5: Final QC/QA Process:

This is the last process and comes when the client has ordered the study. In this process a final QA/QC is done before the study is emailed to the client. Since we believe in giving our clients a good experience of our research studies, therefore, to make sure that we do not lack at our end in any way humanly possible we do a final round of quality check and then dispatch the study to the client.

Market Segmentation

By Product

• Light Commercial Vehicles (LCVs)

• Buses & Coaches

• Heavy Trucks

By End-User

• Industrial

• Mining & Construction

• Passenger Transportation

• Logistics

• Others

By Propulsion Type

• Internal Combustion (IC) Engine

• Hybrid

• Electric Vehicle (EV)

Request for Segment Customization as per your Business Requirement: Segment Customization Request

Regional Coverage:

North America

  • US
  • Canada
  • Mexico

Europe

  • Eastern Europe
    • Poland
    • Romania
    • Hungary
    • Turkey
    • Rest of Eastern Europe
  • Western Europe
    • Germany
    • France
    • UK
    • Italy
    • Spain
    • Netherlands
    • Switzerland
    • Austria
    • Rest of Western Europe

Asia Pacific

  • China
  • India
  • Japan
  • South Korea
  • Vietnam
  • Singapore
  • Australia
  • Rest of Asia Pacific

Middle East & Africa

  • Middle East
    • UAE
    • Egypt
    • Saudi Arabia
    • Qatar
    • Rest of the Middle East
  • Africa
    • Nigeria
    • South Africa
    • Rest of Africa

Latin America

  • Brazil
  • Argentina
  • Colombia
  • Rest of  Latin America

Request for Country Level Research Report: Country Level Customization Request

Available Customization

With the given market data, SNS Insider offers customization as per the company’s specific needs. The following customization options are available for the report:

  • Product Analysis
  • Criss-Cross segment analysis (e.g. Product X Application)
  • Product Matrix which gives a detailed comparison of product portfolio of each company
  • Geographic Analysis
  • Additional countries in any of the regions
  • Company Information
  • Detailed analysis and profiling of additional market players (Up to five)

  •            5000 (33% Discount)


  •            8950 (40% Discount)


  •            3050 (23% Discount)

Start a Conversation

Hi! Click one of our member below to chat on Phone