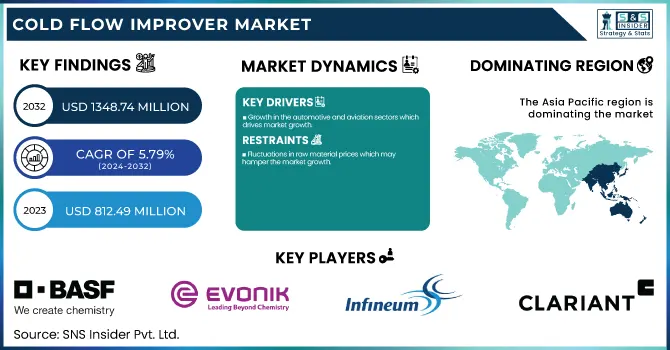
The Cold Flow Improver Market size was USD 812.49 Million in 2023 and is expected to reach USD 1348.74 Million by 2032 and grow at a CAGR of 5.79 % over the forecast period of 2024-2032. The cold flow improver market report comprehensively analyzes production capacity and utilization by region, highlighting key trends in polymer-based and surfactant-based additives. It covers feedstock price fluctuations and supply chain dynamics, offering insights into raw material trends. The report also examines regulatory impacts, including fuel standards and environmental compliance, shaping market growth. Additionally, it presents environmental metrics such as carbon footprint reduction, sustainability initiatives, and waste management practices. Innovation and R&D investments in bio-based and advanced formulations are explored, alongside adoption rates across key end-use industries like automotive, aviation, and marine.
To Get more information on Cold Flow Improver Market - Request Free Sample Report
Drivers
Growth in the automotive and aviation sectors which drives market growth.
Cold flow improvers are witnessing considerable demand owing to growth in the automotive and aviation sectors, as these applications demand high performance of fuel, particularly in cooler climates. The cold flow improvers are majorly used to maintain the fluidity of fuels like diesel and aviation fuel at a low temperature which in turn helps in their efficient utilization by the rapidly growing global vehicle fleet and rising air traffic globally. However, stringent emission regulations in the automotive sector and demand for improving fuel efficiency are also driving advanced additives (in-use additives). Likewise, in aerospace, where jet fuels are required to meet stringent low-temperature performance standards, cold flow improvers are used to prevent fuel from freezing at high altitudes. A surge in the logistics and transportation sector coupled with the surge in infrastructure development in emerging economies have played a huge role in the growth of the market as the above-mentioned sectors are driving the overall demand for fuel additives.
Restraint
Fluctuations in raw material prices which may hamper the market growth.
The increase in the prices of major raw materials, such as ethylene vinyl acetate (EVA), polyalkyl methacrylates (PAMA), and other polymer-based compounds, is expected to hold back the growth of the cold flow improver market, as the market is highly sensitive to the fluctuation of the prices of these raw materials. As these materials are derived from petrochemicals, their price is dependent on crude oil price volatility, geopolitical instability, and disruptions in the supply chain. Abrupt increases in crude oil prices raise production costs thereby reducing manufacturers' profit margins and causing price fluctuations in the market. Alternatively, trade restrictions, shutdown of refineries, or bottlenecks in transportation will result in shortages that could further endanger the supply of these materials, restricting the market expansion. Consequently, manufacturers are increasingly investigating bio-based and sustainable alternatives to diversify their risk exposure to price and supply movements, as well as reduce dependence on conventional petrochemical feedstocks.
Opportunity
Technological advancements in fuel additive formulations create an opportunity in the market.
Technological advancement in the formulation of fuel additives is giving rise to the trends such as the development of fuel additives that can improve the performance of even poor-quality fuels in extreme temperature conditions, which have acted as a significant growth opportunity for the cold flow improver market. Recent advancements in polymer and hybrid-based cold flow improvers have resulted in enhanced fuel flow properties, reduced wax crystal formation, and better compatibility with ultra-low sulfur diesel (ULSD) and biodiesel blends. Next-generation additives such as nanotechnology-based solutions and bio-derived improvers are enabling increased efficiency and sustainability, thereby propelling the market forward. Furthermore, research and development are being significantly undertaken due to the growing demand for multi-functional additives to offer cold flow improvement and stability. Those include increased fuel reliability in cold climates along with compliance with strict, emerging fuel regulations, thus dramatically widening the potential market.
Challenges
Market fragmentation and competition may challenge the market growth.
The fragmented nature and high-level competition posed by regional and global players continue to hinder the hot flow improver market growth. With so many manufacturers, the price wars come in quickly, so the profit margins are lower, and it becomes hard to distinguish your product from the rest. Moreover, the market is led by well-established players because of distribution networks and market reorganization becomes the entry barrier for the new entrants. In price-sensitive regions, customers tend to care more about price versus performance, which, in turn, forces competition into a pricing battle rather than a technological one. Market fragmentation also leads to disparate product quality and regulatory compliance inconsistencies, making the competitive landscape all the more difficult.
By Product
Ethylene Vinyl Acetate (EVA) holds the largest market share in the cold flow improver market 43% in 2023. This is because of its better functionality in improving the low-temperature behavior of fuels, especially diesel. The EVA-based cold flow improvers modify wax crystal growth and prevent gelling of the fuel and clogging of the filter in cold climates. The reason it is the leading choice amongst those who produce fuel additives is down to its ready availability, economic pricing, and ability to digest a broad range of fuel formulations. Moreover, since EVA has a well-characterized high solubility and stability, it can be used in various fuel types and conditions. The rise in demand for diesel in regions with cooler temperatures of the year a greater part of the market is also attributed to the prohibitive legislation for the quality of fuels that make their use more and more present and EVA becomes more and more preferable regionally due to the use of propolis ethanol and improved creation process.
By Application
The diesel fuel segment held the largest market share around 48% in 2023. It is widely utilized in automotive, transportation, agriculture, and industrial operations. Diesel fuel tends to crystallize/solidify into wax at low temperatures and can lead to gelling and clogging filters thereby affecting engine performance. This is where cold flow improvers come into play to avoid this problem, which helps to maintain fuel flow and efficiency, especially in colder parts of the world. Finally, both the increased consumption of ultra-low sulfur diesel (ULSD) and biodiesel blends with poorer cold flow properties have perpetuated the growing demand for cold flow improvers. Additives to meet the strict specs of government regulations on fuel performance and emissions have also kept this segment at the top of the heap as refiners and fuel suppliers mix these unique additives to remain compliant.
By End-Use Industry
Automotive held the largest market share around 65% in 2023. It is owing to the high global demand for diesel-based vehicles such as passenger cars, commercial trucks, and heavy-duty vehicles. In colder climates, low temperatures produce wax crystals in diesel fuels, which can result in the gelling of on-board fuel and short circuiting of engines. Cold flow improvers are an essential product to mitigate these problems and maintain a steady fuel flow to the vehicle. Moreover, increasing adoption of ultra-low sulfur diesel (ULSD) and biodiesel blends with poor cold temperature properties have augmented the demand for cold-flow improvers in automotive applications. The segment dominance is also due to regional stringent government regulations associated with fuel efficiency and emissions, especially in North America and Europe, where automotive players and fuel suppliers are partly merging advanced fuel additives to improve vehicle performance and compliance.
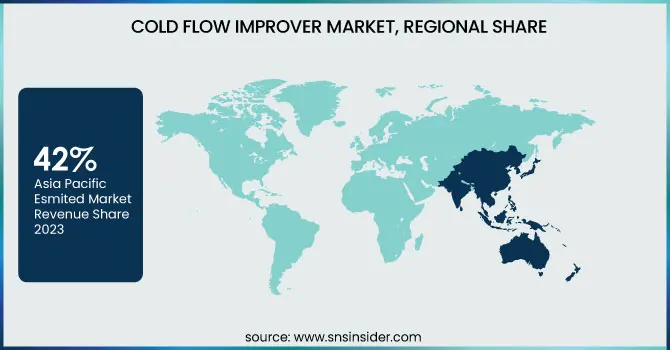
Asia Pacific held the largest market share around 42% in 2023. This is owing to as the consumption of diesel fuel in this region is estimated to be the highest across various applications, including transportation, automotive, construction, and agriculture. A rapidly increasing vehicle fleet in the region, particularly in China, India, and Japan is fueling the market for cold flow improvers for improving the performance of fuel in cold weather. Furthermore, Asia Pacific has a high demand for petroleum refiners and fuel additive producers allowing it to provide a continuous supply of cold flow improvers. The proposed heartening market has been further driven by the growing use of ultra-low sulfur diesel (ULSD) and biodiesel blends, which require effective cold flow treatments. In the region, cold flow improvers have seen large-scale use as a result of government regulation intended to promote fuel efficiency and emissions reduction.
North America held a significant market share in 2023. It is a very high consumption of diesel fuel in the automotive, transportation, oil & gas, and agricultural industries. Extreme winter conditions are a fact of life in this part of the world, especially in Canada and the northern U.S., where frigid temps can gel fuel and cause engines not to start. Thereby creating an extensive demand for cold flow improvers to increase the performance of diesel fuel at low temperatures. In addition, tight government regulations (e.g. the U.S. Environmental Protection Agency [EPA]) requiring ultra-low sulfur diesel (ULSD) and biodiesel blends, both of which possess bad cold flow properties, increase the additive demand. North America holds a significant market share in the fuel additives market, primarily due to the presence of key market players and technological advancements in fuel additives in the region.
Get Customized Report as per Your Business Requirement - Enquiry Now
Key Players
BASF SE (Keroflux, Keropur)
Evonik Industries AG (VISCOPLEX, VISCOBASE)
Infineum International Limited (Infineum R430, Infineum V620)
The Lubrizol Corporation (LUBRIZOL 7650, LUBRIZOL 7671)
Clariant AG (Addition RC 3702, Additin RC 3707)
Afton Chemical Corporation (HiTEC4663, HiTEC 4666)
Baker Hughes (DPR-801, DSR-600)
Bell Performance, Inc. (Cold Flow Improver, Dee-Zol Life)
Chevron Oronite Company LLC (OLOA 25000, OLOA 25001)
Dorf Ketal (Keroflux 3698, Keroflux 3699)
Innospec Inc. (DIESEL FLOW IMPROVER 3000, WINTER FLOW 2000)
TotalEnergies SE (Total Additive 123, Total Additive 456)
HollyFrontier Corporation (Petro-Canada Duron, Petro-Canada Supreme)
Nalco Water (an Ecolab company) (EC5620A, EC5970A)
Tianhe Chemicals (T616, T620)
Cestoil Chemical Inc. (Flow Improver 100, Flow Improver 200)
Exxon Mobil Corporation (Exxsol D80, Exxsol D110)
Ecolab Inc. (EC6106A, EC6190A)
Croda International Plc (Crodamol GTCC, Crodamol IPM)
Schlumberger Limited (DFA-1000, DFA-2000)
Recent Development:
In January 2024, BASF launched Keropur, a new gasoline additive in Taiwan, designed to enhance engine cleanliness by targeting and removing deposits in modern direct injection engines, contributing to sustainable mobility.
In August 2023, Evonik increased its cold flow improver production capacity at its German facility, reinforcing its commitment to supporting the automotive industry with high-performance additives, particularly for diesel fuels.
| Report Attributes | Details |
| Market Size in 2023 | USD 812.49 Million |
| Market Size by 2032 | USD 1348.74 Million |
| CAGR | CAGR of 5.79 % From 2024 to 2032 |
| Base Year | 2023 |
| Forecast Period | 2024-2032 |
| Historical Data | 2020-2022 |
| Report Scope & Coverage | Market Size, Segments Analysis, Competitive Landscape, Regional Analysis, DROC & SWOT Analysis, Forecast Outlook |
| Key Segments | • By Product (Ethylene Vinyl Acetate, Polyalkyl Methacrylate, Polyalpha Olefin, Others) • By Application (Diesel Fuel, Lubricating Oil, Aviation Fuel, Others) • By End-Use Industry (Automotive, Aerospace & Defense, Others) |
| Regional Analysis/Coverage | North America (US, Canada, Mexico), Europe (Eastern Europe [Poland, Romania, Hungary, Turkey, Rest of Eastern Europe] Western Europe] Germany, France, UK, Italy, Spain, Netherlands, Switzerland, Austria, Rest of Western Europe]), Asia Pacific (China, India, Japan, South Korea, Vietnam, Singapore, Australia, Rest of Asia Pacific), Middle East & Africa (Middle East [UAE, Egypt, Saudi Arabia, Qatar, Rest of Middle East], Africa [Nigeria, South Africa, Rest of Africa], Latin America (Brazil, Argentina, Colombia, Rest of Latin America) |
| Company Profiles | BASF SE, Evonik Industries AG, Infineum International Limited, The Lubrizol Corporation, Clariant AG, Afton Chemical Corporation, Baker Hughes, Bell Performance, Inc., Chevron Oronite Company LLC, Dorf Ketal, Innospec Inc., TotalEnergies SE, HollyFrontier Corporation, Nalco Water (an Ecolab company), Tianhe Chemicals, Cestoil Chemical Inc., Exxon Mobil Corporation, Ecolab Inc., Croda International Plc, Schlumberger Limited |
Ans: The Cold Flow Improver Market was valued at USD 812.49 Million in 2023.
Ans: The expected CAGR of the global Cold Flow Improver Market during the forecast period is 5.79%
Ans: Automotive will grow rapidly in the Cold Flow Improver Market from 2024-2032.
Ans: Growth in the automotive and aviation sectors which drives market growth.
Ans: Asia Pacific led the Cold Flow Improver Market in the region with the highest revenue share in 2023.
Table of Contents:
1. Introduction
1.1 Market Definition
1.2 Scope (Inclusion and Exclusions)
1.3 Research Assumptions
2. Executive Summary
2.1 Market Overview
2.2 Regional Synopsis
2.3 Competitive Summary
3. Research Methodology
3.1 Top-Down Approach
3.2 Bottom-up Approach
3.3. Data Validation
3.4 Primary Interviews
4. Market Dynamics Impact Analysis
4.1 Market Driving Factors Analysis
4.1.1 Drivers
4.1.2 Restraints
4.1.3 Opportunities
4.1.4 Challenges
4.2 PESTLE Analysis
4.3 Porter’s Five Forces Model
5. Statistical Insights and Trends Reporting
5.1 By Production Capacity and Utilization, by Country, By Type, 2023
5.2 Feedstock Prices, by Country, By Type, 2023
5.3 Regulatory Impact, by l Country, By Type, 2023.
5.4 Environmental Metrics: Emissions Data, Waste Management Practices, and Sustainability Initiatives, by Region
5.5 Innovation and R&D, Type, 2023
6. Competitive Landscape
6.1 List of Major Companies, By Region
6.2 Market Share Analysis, By Region
6.3 Product Benchmarking
6.3.1 Product specifications and features
6.3.2 Pricing
6.4 Strategic Initiatives
6.4.1 Marketing and promotional activities
6.4.2 Distribution and Supply Chain Strategies
6.4.3 Expansion plans and new Product launches
6.4.4 Strategic partnerships and collaborations
6.5 Technological Advancements
6.6 Market Positioning and Branding
7. Cold Flow Improver Market Segmentation, by Product
7.1 Chapter Overview
7.2 Ethylene Vinyl Acetate
7.2.1 Ethylene Vinyl Acetate Market Trends Analysis (2020-2032)
7.2.2 Ethylene Vinyl Acetate Market Size Estimates and Forecasts to 2032 (USD Million)
7.3 Polyalkyl Methacrylate
7.3.1 Polyalkyl Methacrylate Market Trends Analysis (2020-2032)
7.3.2 Polyalkyl Methacrylate Market Size Estimates and Forecasts to 2032 (USD Million)
7.4 Polyalpha Olefin
7.4.1 Polyalpha Olefin Market Trends Analysis (2020-2032)
7.4.2 Polyalpha Olefin Market Size Estimates and Forecasts to 2032 (USD Million)
7.5 Others
7.5.1 Others Market Trends Analysis (2020-2032)
7.5.2 Others Market Size Estimates and Forecasts to 2032 (USD Million)
8. Cold Flow Improver Market Segmentation, By Application
8.1 Chapter Overview
8.2 Diesel Fuel
8.2.1 Diesel Fuel Market Trends Analysis (2020-2032)
8.2.2 Diesel Fuel Market Size Estimates and Forecasts to 2032 (USD Million)
8.3 Lubricating Oil
8.3.1 Lubricating Oil Market Trends Analysis (2020-2032)
8.3.2 Lubricating Oil Market Size Estimates and Forecasts to 2032 (USD Million)
8.4 Aviation Fuel
8.4.1 Aviation Fuel Market Trends Analysis (2020-2032)
8.4.2 Aviation Fuel Market Size Estimates and Forecasts to 2032 (USD Million)
8.5 Others
8.5.1 Food & Beverages Market Trends Analysis (2020-2032)
8.5.2 Food & Beverages Market Size Estimates and Forecasts to 2032 (USD Million)
9. Cold Flow Improver Market Segmentation, by End Use Industry
9.1 Chapter Overview
9.2 Automotive
9.2.1 Automotive Market Trends Analysis (2020-2032)
9.2.2 Automotive Market Size Estimates and Forecasts to 2032 (USD Million)
9.3 Aerospace & Defense
9.3.1 Aerospace & Defense Market Trends Analysis (2020-2032)
9.3.2 Aerospace & Defense Market Size Estimates and Forecasts to 2032 (USD Million)
9.4 Others
9.4.1 Others Market Trends Analysis (2020-2032)
9.4.2 Others Market Size Estimates and Forecasts to 2032 (USD Million)
10. Regional Analysis
10.1 Chapter Overview
10.2 North America
10.2.1 Trends Analysis
10.2.2 North America Cold Flow Improver Market Estimates and Forecasts, by Country (2020-2032) (USD Million)
10.2.3 North America Cold Flow Improver Market Estimates and Forecasts, by Product (2020-2032) (USD Million)
10.2.4 North America Cold Flow Improver Market Estimates and Forecasts, By Application (2020-2032) (USD Million)
10.2.5 North America Cold Flow Improver Market Estimates and Forecasts, by End Use Industry (2020-2032) (USD Million)
10.2.6 USA
10.2.6.1 USA Cold Flow Improver Market Estimates and Forecasts, by Product (2020-2032) (USD Million)
10.2.6.2 USA Cold Flow Improver Market Estimates and Forecasts, By Application (2020-2032) (USD Million)
10.2.6.3 USA Cold Flow Improver Market Estimates and Forecasts, by End Use Industry (2020-2032) (USD Million)
10.2.7 Canada
10.2.7.1 Canada Cold Flow Improver Market Estimates and Forecasts, by Product (2020-2032) (USD Million)
10.2.7.2 Canada Cold Flow Improver Market Estimates and Forecasts, By Application (2020-2032) (USD Million)
10.2.7.3 Canada Cold Flow Improver Market Estimates and Forecasts, by End Use Industry (2020-2032) (USD Million)
10.2.8 Mexico
10.2.8.1 Mexico Cold Flow Improver Market Estimates and Forecasts, by Product (2020-2032) (USD Million)
10.2.8.2 Mexico Cold Flow Improver Market Estimates and Forecasts, By Application (2020-2032) (USD Million)
10.2.8.3 Mexico Cold Flow Improver Market Estimates and Forecasts, by End Use Industry (2020-2032) (USD Million)
10.3 Europe
10.3.1 Eastern Europe
10.3.1.1 Trends Analysis
10.3.1.2 Eastern Europe Cold Flow Improver Market Estimates and Forecasts, by Country (2020-2032) (USD Million)
10.3.1.3 Eastern Europe Cold Flow Improver Market Estimates and Forecasts, by Product (2020-2032) (USD Million)
10.3.1.4 Eastern Europe Cold Flow Improver Market Estimates and Forecasts, By Application (2020-2032) (USD Million)
10.3.1.5 Eastern Europe Cold Flow Improver Market Estimates and Forecasts, by End Use Industry (2020-2032) (USD Million)
10.3.1.6 Poland
10.3.1.6.1 Poland Cold Flow Improver Market Estimates and Forecasts, by Product (2020-2032) (USD Million)
10.3.1.6.2 Poland Cold Flow Improver Market Estimates and Forecasts, By Application (2020-2032) (USD Million)
10.3.1.6.3 Poland Cold Flow Improver Market Estimates and Forecasts, by End Use Industry (2020-2032) (USD Million)
10.3.1.7 Romania
10.3.1.7.1 Romania Cold Flow Improver Market Estimates and Forecasts, by Product (2020-2032) (USD Million)
10.3.1.7.2 Romania Cold Flow Improver Market Estimates and Forecasts, By Application (2020-2032) (USD Million)
10.3.1.7.3 Romania Cold Flow Improver Market Estimates and Forecasts, by End Use Industry (2020-2032) (USD Million)
10.3.1.8 Hungary
10.3.1.8.1 Hungary Cold Flow Improver Market Estimates and Forecasts, by Product (2020-2032) (USD Million)
10.3.1.8.2 Hungary Cold Flow Improver Market Estimates and Forecasts, By Application (2020-2032) (USD Million)
10.3.1.8.3 Hungary Cold Flow Improver Market Estimates and Forecasts, by End Use Industry (2020-2032) (USD Million)
10.3.1.9 Turkey
10.3.1.9.1 Turkey Cold Flow Improver Market Estimates and Forecasts, by Product (2020-2032) (USD Million)
10.3.1.9.2 Turkey Cold Flow Improver Market Estimates and Forecasts, By Application (2020-2032) (USD Million)
10.3.1.9.3 Turkey Cold Flow Improver Market Estimates and Forecasts, by End Use Industry (2020-2032) (USD Million)
10.3.1.10 Rest of Eastern Europe
10.3.1.10.1 Rest of Eastern Europe Cold Flow Improver Market Estimates and Forecasts, by Product (2020-2032) (USD Million)
10.3.1.10.2 Rest of Eastern Europe Cold Flow Improver Market Estimates and Forecasts, By Application (2020-2032) (USD Million)
10.3.1.10.3 Rest of Eastern Europe Cold Flow Improver Market Estimates and Forecasts, by End Use Industry (2020-2032) (USD Million)
10.3.2 Western Europe
10.3.2.1 Trends Analysis
10.3.2.2 Western Europe Cold Flow Improver Market Estimates and Forecasts, by Country (2020-2032) (USD Million)
10.3.2.3 Western Europe Cold Flow Improver Market Estimates and Forecasts, by Product (2020-2032) (USD Million)
10.3.2.4 Western Europe Cold Flow Improver Market Estimates and Forecasts, By Application (2020-2032) (USD Million)
10.3.2.5 Western Europe Cold Flow Improver Market Estimates and Forecasts, by End Use Industry (2020-2032) (USD Million)
10.3.2.6 Germany
10.3.2.6.1 Germany Cold Flow Improver Market Estimates and Forecasts, by Product (2020-2032) (USD Million)
10.3.2.6.2 Germany Cold Flow Improver Market Estimates and Forecasts, By Application (2020-2032) (USD Million)
10.3.2.6.3 Germany Cold Flow Improver Market Estimates and Forecasts, by End Use Industry (2020-2032) (USD Million)
10.3.2.7 France
10.3.2.7.1 France Cold Flow Improver Market Estimates and Forecasts, by Product (2020-2032) (USD Million)
10.3.2.7.2 France Cold Flow Improver Market Estimates and Forecasts, By Application (2020-2032) (USD Million)
10.3.2.7.3 France Cold Flow Improver Market Estimates and Forecasts, by End Use Industry (2020-2032) (USD Million)
10.3.2.8 UK
10.3.2.8.1 UK Cold Flow Improver Market Estimates and Forecasts, by Product (2020-2032) (USD Million)
10.3.2.8.2 UK Cold Flow Improver Market Estimates and Forecasts, By Application (2020-2032) (USD Million)
10.3.2.8.3 UK Cold Flow Improver Market Estimates and Forecasts, by End Use Industry (2020-2032) (USD Million)
10.3.2.9 Italy
10.3.2.9.1 Italy Cold Flow Improver Market Estimates and Forecasts, by Product (2020-2032) (USD Million)
10.3.2.9.2 Italy Cold Flow Improver Market Estimates and Forecasts, By Application (2020-2032) (USD Million)
10.3.2.9.3 Italy Cold Flow Improver Market Estimates and Forecasts, by End Use Industry (2020-2032) (USD Million)
10.3.2.10 Spain
10.3.2.10.1 Spain Cold Flow Improver Market Estimates and Forecasts, by Product (2020-2032) (USD Million)
10.3.2.10.2 Spain Cold Flow Improver Market Estimates and Forecasts, By Application (2020-2032) (USD Million)
10.3.2.10.3 Spain Cold Flow Improver Market Estimates and Forecasts, by End Use Industry (2020-2032) (USD Million)
10.3.2.11 Netherlands
10.3.2.11.1 Netherlands Cold Flow Improver Market Estimates and Forecasts, by Product (2020-2032) (USD Million)
10.3.2.11.2 Netherlands Cold Flow Improver Market Estimates and Forecasts, By Application (2020-2032) (USD Million)
10.3.2.11.3 Netherlands Cold Flow Improver Market Estimates and Forecasts, by End Use Industry (2020-2032) (USD Million)
10.3.2.12 Switzerland
10.3.2.12.1 Switzerland Cold Flow Improver Market Estimates and Forecasts, by Product (2020-2032) (USD Million)
10.3.2.12.2 Switzerland Cold Flow Improver Market Estimates and Forecasts, By Application (2020-2032) (USD Million)
10.3.2.12.3 Switzerland Cold Flow Improver Market Estimates and Forecasts, by End Use Industry (2020-2032) (USD Million)
10.3.2.13 Austria
10.3.2.13.1 Austria Cold Flow Improver Market Estimates and Forecasts, by Product (2020-2032) (USD Million)
10.3.2.13.2 Austria Cold Flow Improver Market Estimates and Forecasts, By Application (2020-2032) (USD Million)
10.3.2.13.3 Austria Cold Flow Improver Market Estimates and Forecasts, by End Use Industry (2020-2032) (USD Million)
10.3.2.14 Rest of Western Europe
10.3.2.14.1 Rest of Western Europe Cold Flow Improver Market Estimates and Forecasts, by Product (2020-2032) (USD Million)
10.3.2.14.2 Rest of Western Europe Cold Flow Improver Market Estimates and Forecasts, By Application (2020-2032) (USD Million)
10.3.2.14.3 Rest of Western Europe Cold Flow Improver Market Estimates and Forecasts, by End Use Industry (2020-2032) (USD Million)
10.4 Asia Pacific
10.4.1 Trends Analysis
10.4.2 Asia Pacific Cold Flow Improver Market Estimates and Forecasts, by Country (2020-2032) (USD Million)
10.4.3 Asia Pacific Cold Flow Improver Market Estimates and Forecasts, by Product (2020-2032) (USD Million)
10.4.4 Asia Pacific Cold Flow Improver Market Estimates and Forecasts, By Application (2020-2032) (USD Million)
10.4.5 Asia Pacific Cold Flow Improver Market Estimates and Forecasts, by End Use Industry (2020-2032) (USD Million)
10.4.6 China
10.4.6.1 China Cold Flow Improver Market Estimates and Forecasts, by Product (2020-2032) (USD Million)
10.4.6.2 China Cold Flow Improver Market Estimates and Forecasts, By Application (2020-2032) (USD Million)
10.4.6.3 China Cold Flow Improver Market Estimates and Forecasts, by End Use Industry (2020-2032) (USD Million)
10.4.7 India
10.4.7.1 India Cold Flow Improver Market Estimates and Forecasts, by Product (2020-2032) (USD Million)
10.4.7.2 India Cold Flow Improver Market Estimates and Forecasts, By Application (2020-2032) (USD Million)
10.4.7.3 India Cold Flow Improver Market Estimates and Forecasts, by End Use Industry (2020-2032) (USD Million)
10.4.8 Japan
10.4.8.1 Japan Cold Flow Improver Market Estimates and Forecasts, by Product (2020-2032) (USD Million)
10.4.8.2 Japan Cold Flow Improver Market Estimates and Forecasts, By Application (2020-2032) (USD Million)
10.4.8.3 Japan Cold Flow Improver Market Estimates and Forecasts, by End Use Industry (2020-2032) (USD Million)
10.4.9 South Korea
10.4.9.1 South Korea Cold Flow Improver Market Estimates and Forecasts, by Product (2020-2032) (USD Million)
10.4.9.2 South Korea Cold Flow Improver Market Estimates and Forecasts, By Application (2020-2032) (USD Million)
10.4.9.3 South Korea Cold Flow Improver Market Estimates and Forecasts, by End Use Industry (2020-2032) (USD Million)
10.4.10 Vietnam
10.4.10.1 Vietnam Cold Flow Improver Market Estimates and Forecasts, by Product (2020-2032) (USD Million)
10.4.10.2 Vietnam Cold Flow Improver Market Estimates and Forecasts, By Application (2020-2032) (USD Million)
10.4.10.3 Vietnam Cold Flow Improver Market Estimates and Forecasts, by End Use Industry (2020-2032) (USD Million)
10.4.11 Singapore
10.4.11.1 Singapore Cold Flow Improver Market Estimates and Forecasts, by Product (2020-2032) (USD Million)
10.4.11.2 Singapore Cold Flow Improver Market Estimates and Forecasts, By Application (2020-2032) (USD Million)
10.4.11.3 Singapore Cold Flow Improver Market Estimates and Forecasts, by End Use Industry (2020-2032) (USD Million)
10.4.12 Australia
10.4.12.1 Australia Cold Flow Improver Market Estimates and Forecasts, by Product (2020-2032) (USD Million)
10.4.12.2 Australia Cold Flow Improver Market Estimates and Forecasts, By Application (2020-2032) (USD Million)
10.4.12.3 Australia Cold Flow Improver Market Estimates and Forecasts, by End Use Industry (2020-2032) (USD Million)
10.4.13 Rest of Asia Pacific
10.4.13.1 Rest of Asia Pacific Cold Flow Improver Market Estimates and Forecasts, by Product (2020-2032) (USD Million)
10.4.13.2 Rest of Asia Pacific Cold Flow Improver Market Estimates and Forecasts, By Application (2020-2032) (USD Million)
10.4.13.3 Rest of Asia Pacific Cold Flow Improver Market Estimates and Forecasts, by End Use Industry (2020-2032) (USD Million)
10.5 Middle East and Africa
10.5.1 Middle East
10.5.1.1 Trends Analysis
10.5.1.2 Middle East Cold Flow Improver Market Estimates and Forecasts, by Country (2020-2032) (USD Million)
10.5.1.3 Middle East Cold Flow Improver Market Estimates and Forecasts, by Product (2020-2032) (USD Million)
10.5.1.4 Middle East Cold Flow Improver Market Estimates and Forecasts, By Application (2020-2032) (USD Million)
10.5.1.5 Middle East Cold Flow Improver Market Estimates and Forecasts, by End Use Industry (2020-2032) (USD Million)
10.5.1.6 UAE
10.5.1.6.1 UAE Cold Flow Improver Market Estimates and Forecasts, by Product (2020-2032) (USD Million)
10.5.1.6.2 UAE Cold Flow Improver Market Estimates and Forecasts, By Application (2020-2032) (USD Million)
10.5.1.6.3 UAE Cold Flow Improver Market Estimates and Forecasts, by End Use Industry (2020-2032) (USD Million)
10.5.1.7 Egypt
10.5.1.7.1 Egypt Cold Flow Improver Market Estimates and Forecasts, by Product (2020-2032) (USD Million)
10.5.1.7.2 Egypt Cold Flow Improver Market Estimates and Forecasts, By Application (2020-2032) (USD Million)
10.5.1.7.3 Egypt Cold Flow Improver Market Estimates and Forecasts, by End Use Industry (2020-2032) (USD Million)
10.5.1.8 Saudi Arabia
10.5.1.8.1 Saudi Arabia Cold Flow Improver Market Estimates and Forecasts, by Product (2020-2032) (USD Million)
10.5.1.8.2 Saudi Arabia Cold Flow Improver Market Estimates and Forecasts, By Application (2020-2032) (USD Million)
10.5.1.8.3 Saudi Arabia Cold Flow Improver Market Estimates and Forecasts, by End Use Industry (2020-2032) (USD Million)
10.5.1.9 Qatar
10.5.1.9.1 Qatar Cold Flow Improver Market Estimates and Forecasts, by Product (2020-2032) (USD Million)
10.5.1.9.2 Qatar Cold Flow Improver Market Estimates and Forecasts, By Application (2020-2032) (USD Million)
10.5.1.9.3 Qatar Cold Flow Improver Market Estimates and Forecasts, by End Use Industry (2020-2032) (USD Million)
10.5.1.10 Rest of Middle East
10.5.1.10.1 Rest of Middle East Cold Flow Improver Market Estimates and Forecasts, by Product (2020-2032) (USD Million)
10.5.1.10.2 Rest of Middle East Cold Flow Improver Market Estimates and Forecasts, By Application (2020-2032) (USD Million)
10.5.1.10.3 Rest of Middle East Cold Flow Improver Market Estimates and Forecasts, by End Use Industry (2020-2032) (USD Million)
10.5.2 Africa
10.5.2.1 Trends Analysis
10.5.2.2 Africa Cold Flow Improver Market Estimates and Forecasts, by Country (2020-2032) (USD Million)
10.5.2.3 Africa Cold Flow Improver Market Estimates and Forecasts, by Product (2020-2032) (USD Million)
10.5.2.4 Africa Cold Flow Improver Market Estimates and Forecasts, By Application (2020-2032) (USD Million)
10.5.2.5 Africa Cold Flow Improver Market Estimates and Forecasts, by End Use Industry (2020-2032) (USD Million)
10.5.2.6 South Africa
10.5.2.6.1 South Africa Cold Flow Improver Market Estimates and Forecasts, by Product (2020-2032) (USD Million)
10.5.2.6.2 South Africa Cold Flow Improver Market Estimates and Forecasts, By Application (2020-2032) (USD Million)
10.5.2.6.3 South Africa Cold Flow Improver Market Estimates and Forecasts, by End Use Industry (2020-2032) (USD Million)
10.5.2.7 Nigeria
10.5.2.7.1 Nigeria Cold Flow Improver Market Estimates and Forecasts, by Product (2020-2032) (USD Million)
10.5.2.7.2 Nigeria Cold Flow Improver Market Estimates and Forecasts, By Application (2020-2032) (USD Million)
10.5.2.7.3 Nigeria Cold Flow Improver Market Estimates and Forecasts, by End Use Industry (2020-2032) (USD Million)
10.5.2.8 Rest of Africa
10.5.2.8.1 Rest of Africa Cold Flow Improver Market Estimates and Forecasts, by Product (2020-2032) (USD Million)
10.5.2.8.2 Rest of Africa Cold Flow Improver Market Estimates and Forecasts, By Application (2020-2032) (USD Million)
10.5.2.8.3 Rest of Africa Cold Flow Improver Market Estimates and Forecasts, by End Use Industry (2020-2032) (USD Million)
10.6 Latin America
10.6.1 Trends Analysis
10.6.2 Latin America Cold Flow Improver Market Estimates and Forecasts, by Country (2020-2032) (USD Million)
10.6.3 Latin America Cold Flow Improver Market Estimates and Forecasts, by Product (2020-2032) (USD Million)
10.6.4 Latin America Cold Flow Improver Market Estimates and Forecasts, By Application (2020-2032) (USD Million)
10.6.5 Latin America Cold Flow Improver Market Estimates and Forecasts, by End Use Industry (2020-2032) (USD Million)
10.6.6 Brazil
10.6.6.1 Brazil Cold Flow Improver Market Estimates and Forecasts, by Product (2020-2032) (USD Million)
10.6.6.2 Brazil Cold Flow Improver Market Estimates and Forecasts, By Application (2020-2032) (USD Million)
10.6.6.3 Brazil Cold Flow Improver Market Estimates and Forecasts, by End Use Industry (2020-2032) (USD Million)
10.6.7 Argentina
10.6.7.1 Argentina Cold Flow Improver Market Estimates and Forecasts, by Product (2020-2032) (USD Million)
10.6.7.2 Argentina Cold Flow Improver Market Estimates and Forecasts, By Application (2020-2032) (USD Million)
10.6.7.3 Argentina Cold Flow Improver Market Estimates and Forecasts, by End Use Industry (2020-2032) (USD Million)
10.6.8 Colombia
10.6.8.1 Colombia Cold Flow Improver Market Estimates and Forecasts, by Product (2020-2032) (USD Million)
10.6.8.2 Colombia Cold Flow Improver Market Estimates and Forecasts, By Application (2020-2032) (USD Million)
10.6.8.3 Colombia Cold Flow Improver Market Estimates and Forecasts, by End Use Industry (2020-2032) (USD Million)
10.6.9 Rest of Latin America
10.6.9.1 Rest of Latin America Cold Flow Improver Market Estimates and Forecasts, by Product (2020-2032) (USD Million)
10.6.9.2 Rest of Latin America Cold Flow Improver Market Estimates and Forecasts, By Application (2020-2032) (USD Million)
10.6.9.3 Rest of Latin America Cold Flow Improver Market Estimates and Forecasts, by End Use Industry (2020-2032) (USD Million)
11. Company Profiles
11.1 BASF SE
11.1.1 Company Overview
11.1.2 Financial
11.1.3 Product/ Services Offered
11.1.4 SWOT Analysis
11.2 Evonik Industries AG
11.2.1 Company Overview
11.2.2 Financial
11.2.3 Product/ Services Offered
11.2.4 SWOT Analysis
11.3 Infineum International Limited
11.3.1 Company Overview
11.3.2 Financial
11.3.3 Product/ Services Offered
11.3.4 SWOT Analysis
11.4 The Lubrizol Corporation
11.4.1 Company Overview
11.4.2 Financial
11.4.3 Product/ Services Offered
11.4.4 SWOT Analysis
11.5 Clariant AG
11.5.1 Company Overview
11.5.2 Financial
11.5.3 Product/ Services Offered
11.5.4 SWOT Analysis
11.6 Afton Chemical Corporation.
11.6.1 Company Overview
11.6.2 Financial
11.6.3 Product/ Services Offered
11.6.4 SWOT Analysis
11.7 Bell Performance, Inc.
11.7.1 Company Overview
11.7.2 Financial
11.7.3 Product/ Services Offered
11.7.4 SWOT Analysis
11.8 Innospec Inc.
11.8.1 Company Overview
11.8.2 Financial
11.8.3 Product/ Services Offered
11.8.4 SWOT Analysis
11.9 HollyFrontier Corporation
11.9.1 Company Overview
11.9.2 Financial
11.9.3 Product/ Services Offered
11.9.4 SWOT Analysis
11.10 Exxon Mobil Corporation
11.10.1 Company Overview
11.10.2 Financial
11.10.3 Product/ Services Offered
11.10.4 SWOT Analysis
12. Use Cases and Best Practices
13. Conclusion
An accurate research report requires proper strategizing as well as implementation. There are multiple factors involved in the completion of good and accurate research report and selecting the best methodology to compete the research is the toughest part. Since the research reports we provide play a crucial role in any company’s decision-making process, therefore we at SNS Insider always believe that we should choose the best method which gives us results closer to reality. This allows us to reach at a stage wherein we can provide our clients best and accurate investment to output ratio.
Each report that we prepare takes a timeframe of 350-400 business hours for production. Starting from the selection of titles through a couple of in-depth brain storming session to the final QC process before uploading our titles on our website we dedicate around 350 working hours. The titles are selected based on their current market cap and the foreseen CAGR and growth.
The 5 steps process:
Step 1: Secondary Research:
Secondary Research or Desk Research is as the name suggests is a research process wherein, we collect data through the readily available information. In this process we use various paid and unpaid databases which our team has access to and gather data through the same. This includes examining of listed companies’ annual reports, Journals, SEC filling etc. Apart from this our team has access to various associations across the globe across different industries. Lastly, we have exchange relationships with various university as well as individual libraries.

Step 2: Primary Research
When we talk about primary research, it is a type of study in which the researchers collect relevant data samples directly, rather than relying on previously collected data. This type of research is focused on gaining content specific facts that can be sued to solve specific problems. Since the collected data is fresh and first hand therefore it makes the study more accurate and genuine.
We at SNS Insider have divided Primary Research into 2 parts.
Part 1 wherein we interview the KOLs of major players as well as the upcoming ones across various geographic regions. This allows us to have their view over the market scenario and acts as an important tool to come closer to the accurate market numbers. As many as 45 paid and unpaid primary interviews are taken from both the demand and supply side of the industry to make sure we land at an accurate judgement and analysis of the market.
This step involves the triangulation of data wherein our team analyses the interview transcripts, online survey responses and observation of on filed participants. The below mentioned chart should give a better understanding of the part 1 of the primary interview.

Part 2: In this part of primary research the data collected via secondary research and the part 1 of the primary research is validated with the interviews from individual consultants and subject matter experts.
Consultants are those set of people who have at least 12 years of experience and expertise within the industry whereas Subject Matter Experts are those with at least 15 years of experience behind their back within the same space. The data with the help of two main processes i.e., FGDs (Focused Group Discussions) and IDs (Individual Discussions). This gives us a 3rd party nonbiased primary view of the market scenario making it a more dependable one while collation of the data pointers.
Step 3: Data Bank Validation
Once all the information is collected via primary and secondary sources, we run that information for data validation. At our intelligence centre our research heads track a lot of information related to the market which includes the quarterly reports, the daily stock prices, and other relevant information. Our data bank server gets updated every fortnight and that is how the information which we collected using our primary and secondary information is revalidated in real time.

Step 4: QA/QC Process
After all the data collection and validation our team does a final level of quality check and quality assurance to get rid of any unwanted or undesired mistakes. This might include but not limited to getting rid of the any typos, duplication of numbers or missing of any important information. The people involved in this process include technical content writers, research heads and graphics people. Once this process is completed the title gets uploader on our platform for our clients to read it.
Step 5: Final QC/QA Process:
This is the last process and comes when the client has ordered the study. In this process a final QA/QC is done before the study is emailed to the client. Since we believe in giving our clients a good experience of our research studies, therefore, to make sure that we do not lack at our end in any way humanly possible we do a final round of quality check and then dispatch the study to the client.
Key Segments:
By Product
Ethylene Vinyl Acetate
Polyalkyl Methacrylate
Polyalpha Olefin
Others
By Application
Diesel Fuel
Lubricating Oil
Aviation Fuel
Others
By End Use Industry
Automotive
Aerospace & Defense
Others
Request for Segment Customization as per your Business Requirement: Segment Customization Request
Regional Coverage:
North America
US
Canada
Mexico
Europe
Eastern Europe
Poland
Romania
Hungary
Turkey
Rest of Eastern Europe
Western Europe
Germany
France
UK
Italy
Spain
Netherlands
Switzerland
Austria
Rest of Western Europe
Asia Pacific
China
India
Japan
South Korea
Vietnam
Singapore
Australia
Rest of Asia Pacific
Middle East & Africa
Middle East
UAE
Egypt
Saudi Arabia
Qatar
Rest of Middle East
Africa
Nigeria
South Africa
Rest of Africa
Latin America
Brazil
Argentina
Colombia
Rest of Latin America
Request for Country Level Research Report: Country Level Customization Request
Available Customization
With the given market data, SNS Insider offers customization as per the company’s specific needs. The following customization options are available for the report:
Detailed Volume Analysis
Criss-Cross segment analysis (e.g. Product X Application)
Competitive Product Benchmarking
Geographic Analysis
Additional countries in any of the regions
Customized Data Representation
Detailed analysis and profiling of additional market players
Synthetic Paper Market was valued at USD 909.12 million in 2023 and is expected to reach USD 2023.96 million by 2032, growing at a CAGR of 9.50% from 2024-2032.
The Chondroitin Sulfate Market Size was valued at USD 1.3 Billion in 2023 and is expected to reach USD 1.7 Billion by 2032 and grow at a CAGR of 3.4% over the forecast period 2024-2032.
The Lubricating Oil Additives Market Size was valued at USD 19.66 billion in 2023 and is estimated to reach USD 25.66 billion by 2032 and grow at a CAGR of 3.0% over the forecast period 2024-2032.
Acrylic Processing Aid Market was USD 731.04 million in 2023 and is expected to reach USD 1213.94 million by 2032, at a CAGR of 5.80% from 2024 to 2032.
PMMA Microspheres Market was valued at USD 369.99 Million in 2023 & is expected to reach USD 665.53 Million by 2032, growing at a CAGR of 6.76% from 2024-2032.
The Pyridine & Pyridine Derivatives Market size was USD 736.67 million in 2023 and is expected to reach USD 1139.72 million by 2032 and grow at a CAGR of 4.97% over the forecast period of 2024-2032.

Hi! Click one of our member below to chat on Phone
© 2025 All Rights Reserved by SNS Insider Pvt Ltd


