Get more information on CMO/CDMO Market - Request Sample Report
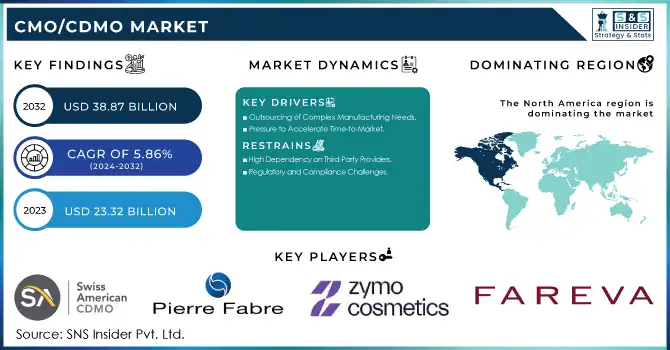
The CMO/CDMO Market was estimated at USD 23.32 billion in 2023 and is expected to reach USD 38.87 billion by 2032, developing at a CAGR of 5.86% over the forecast period 2024-2032.
The Contract Manufacturing Organization (CMO) and Contract Development and Manufacturing Organization (CDMO) market has been experiencing significant growth, driven by key trends in drug development and the need for specialized manufacturing capabilities. Several factors, including the increasing complexity of drug production, the rise of biologics and biosimilars, the growing demand for personalized medicine, and technological advancements have all contributed to the expansion of this sector.
One of the primary drivers is the surge in demand for biologics, which has led many pharmaceutical companies to increasingly rely on CMOs and CDMOs with the expertise and resources required for biologic manufacturing. More than 70% of large pharmaceutical companies have indicated a growing reliance on contract manufacturing for biologics production, a trend that is expected to continue as biologics make up a larger portion of drug portfolios. For example, Lonza's partnership with Moderna to manufacture its COVID-19 vaccine showcases how CDMOs play a pivotal role in scaling up production for high-demand drugs. In 2020, this collaboration led to the production of up to 1 billion vaccine doses, demonstrating the critical role of CDMOs during urgent global health crises.
The rise of personalized medicine has also been a significant factor in the growth of the CMO/CDMO market. The shift towards tailored therapies, including gene and cell therapies, requires specialized, flexible, and scalable manufacturing capabilities. AGC Biologics, for instance, has invested heavily in expanding its capacity to support the growing field of personalized medicine, with new facilities dedicated to gene and cell therapies. The market for personalized medicine is forecasted to continue growing rapidly, driving further demand for specialized manufacturing services.
Technological advancements, such as continuous manufacturing, are reshaping the production processes within the pharmaceutical industry. This technology allows for more efficient, cost-effective, and scalable production, making it highly attractive to drug developers. A survey by the International Society for Pharmaceutical Engineering (ISPE) indicated that over 50% of pharmaceutical companies are adopting continuous manufacturing, with many relying on CDMOs to implement these solutions. For example, major pharmaceutical companies like Pfizer and Takeda are incorporating continuous manufacturing technologies to improve production efficiency and reduce time-to-market.
The COVID-19 pandemic also underscored the essential role of CMOs and CDMOs in ensuring the timely production and delivery of critical medical products. Catalent, a leading CMO, produced over 100 million doses of the Johnson & Johnson COVID-19 vaccine in 2021, demonstrating how CMOs and CDMOs quickly adapted to meet the global demand for vaccines and therapeutics. This partnership exemplifies how CDMOs are integral in addressing urgent healthcare needs. Furthermore, as regulatory requirements become increasingly complex, pharmaceutical companies are turning to CMOs and CDMOs for their regulatory expertise. A survey from WuXi AppTec revealed that 86% of drug developers rely on contract manufacturers to navigate regulatory submissions and ensure compliance with global standards.
Drivers
Outsourcing of Complex Manufacturing Needs
As drug development becomes more intricate, pharmaceutical companies are increasingly outsourcing production to specialized CMOs and CDMOs. These organizations offer the expertise and infrastructure required to handle advanced manufacturing processes, particularly in biologics, gene therapies, and complex small molecules, enabling companies to manage costs and meet specialized therapy demands.
Pressure to Accelerate Time-to-Market
The demand for quicker commercialization of new drugs is a significant driver in the CMO/CDMO market. By outsourcing manufacturing, pharmaceutical companies can streamline production processes, particularly in clinical trials and large-scale manufacturing, reducing time-to-market and ensuring a competitive edge in the fast-evolving pharmaceutical landscape.
Navigating Regulatory Complexity and Embracing Sustainability
The increasing complexity of global pharmaceutical regulations is prompting companies to turn to CDMOs for regulatory expertise. Additionally, the shift toward sustainable practices in the industry is driving CDMOs to adopt eco-friendly manufacturing techniques, meeting the growing demand for environmentally conscious production methods while ensuring regulatory compliance.
Restraints
High Dependency on Third-Party Providers
Pharmaceutical companies may face risks associated with the high dependency on external CMOs and CDMOs for critical manufacturing processes. Issues such as supply chain disruptions, production delays, or quality control challenges from third-party providers can affect timelines and product consistency, creating potential bottlenecks and operational risks.
Regulatory and Compliance Challenges
As the global regulatory landscape becomes increasingly complex, CDMOs must navigate a wide array of compliance requirements. Pharmaceutical companies may face delays or additional costs in ensuring that their outsourced manufacturing partners meet varying regulatory standards across different markets, which can create barriers to seamless production and distribution.
By Service
Contract manufacturing was the dominant service in the CMO/CDMO market in 2023, accounting for around 60.0% of the market share. The increasing reliance on third-party manufacturers to handle large-scale production has been a major driver of this segment’s dominance. Pharmaceutical companies opt for contract manufacturing to reduce costs, scale production efficiently, and focus on core competencies, leaving production to specialized partners with the necessary infrastructure.
Contract development services saw the fastest growth and are also anticipated to be over the forecast period. This is due to the increasing complexity of drug formulations and the rising need for specialized drug development expertise. Pharmaceutical companies are increasingly outsourcing their development processes to CMOs and CDMOs to leverage their advanced capabilities in formulation development, clinical trials, and regulatory compliance. The growing focus on personalized medicine and biologics has also contributed to the rapid expansion of contract development services.
By Form
Solid forms and powders dominated the market in 2023, representing around 40.0% of the market share. This form remains the most popular choice for pharmaceutical products, especially oral medications like tablets and capsules. The dominance of solid forms is attributed to their long shelf life, ease of administration, and scalability in production, making them a preferred choice for patients and manufacturers.
The creams segment experienced the fastest growth for 2024-2032. The demand for creams, particularly in skin care and cosmetic applications, has surged due to their broad use in anti-aging treatments, moisturizers, and dermatological solutions. The rise in consumer interest in skincare routines, along with innovations in cream formulations that cater to specific skin concerns, has made this form one of the fastest-growing segments in the market.
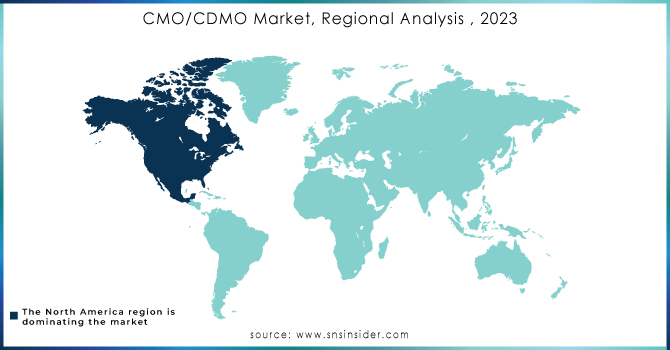
North America emerged as the dominant region in the global CMO/CDMO market in 2023, driven by a robust pharmaceutical and biotechnology industry and significant advancements in drug discovery and development. The presence of established players and a strong regulatory framework in countries like the United States bolstered the region's leadership. High investments in biologics and specialty drugs, coupled with the increasing trend of outsourcing manufacturing and development to reduce operational costs, significantly contributed to the market’s growth in this region.
Europe followed closely, with countries like Germany, Switzerland, and the United Kingdom at the forefront due to their well-established pharmaceutical manufacturing infrastructure. The growing emphasis on biosimilars and the expansion of biologics manufacturing capacity further supported the market's expansion in this region. Additionally, stringent regulatory policies ensured high-quality production standards, which boosted the credibility of CDMO services.
The Asia-Pacific region exhibited the fastest growth throughout the forecast period, driven by rising investments in pharmaceutical infrastructure and an increasing number of collaborations between global companies and regional CDMOs. Countries such as China and India emerged as key hubs, offering cost-effective manufacturing solutions and a skilled workforce. Furthermore, government initiatives to promote healthcare innovation and favorable regulatory changes accelerated market growth in the region.
Need any customization on CMO/CDMO Market - Enquiry Now
Skincare formulations, topical creams, and personal care products.
Dermatology solutions, cosmetic manufacturing, and pharmaceutical formulations.
Skincare, haircare, and custom cosmetic formulations.
Fareva
Pharmaceuticals, personal care items, and home care solutions.
Biofarma Srl C.F.
Nutraceuticals, dietary supplements, and pharmaceutical manufacturing.
Chemineau
Liquid pharmaceuticals, aerosols, and topical solutions.
C.O.C. Farmaceutici Srl
Oral solids, sterile products, and topical formulations.
Paragon Nordic
Aerosols, emulsions, and personal care items.
Lonza Group
Biopharmaceuticals, small molecule manufacturing, and cell & gene therapies.
Catalent, Inc.
Drug delivery technologies, biologics development, and oral and inhalation product manufacturing.
In September 2024, Samsung Biologics announced a multi-billion-dollar investment to expand its biomanufacturing capacity, including a fifth 180,000 L plant and a dedicated ADC facility in South Korea. Plant 5 is set to be completed by April 2025, increasing total capacity to 784,000 L.
In October 2024, McGuff Pharmaceuticals received FDA approval for its state-of-the-art 86,000-sq.-ft. The sterile fill-and-finish facility is in Santa Ana, CA. This advancement positions the company to expand its presence in the CMO and CDMO markets, addressing the increasing demand for high-quality sterile drug manufacturing services.
Report Attributes | Details |
---|---|
Market Size in 2023 | USD 23.32 billion |
Market Size by 2032 | USD 38.87 Billion |
CAGR | CAGR of 5.86% From 2024 to 2032 |
Base Year | 2023 |
Forecast Period | 2024-2032 |
Historical Data | 2020-2022 |
Report Scope & Coverage | Market Size, Segments Analysis, Competitive Landscape, Regional Analysis, DROC & SWOT Analysis, Forecast Outlook |
Key Segments | • By Product (Hair Products, Skin Products, Lip Products, Eye Products, Body Hygiene, Oral Hygiene) • By Service (Contract Development, Contract Manufacturing, Others) • By Form (Solid Form & Powder, Lotions, Creams, Others) |
Regional Analysis/Coverage | North America (US, Canada, Mexico), Europe (Eastern Europe [Poland, Romania, Hungary, Turkey, Rest of Eastern Europe] Western Europe] Germany, France, UK, Italy, Spain, Netherlands, Switzerland, Austria, Rest of Western Europe]), Asia Pacific (China, India, Japan, South Korea, Vietnam, Singapore, Australia, Rest of Asia Pacific), Middle East & Africa (Middle East [UAE, Egypt, Saudi Arabia, Qatar, Rest of Middle East], Africa [Nigeria, South Africa, Rest of Africa], Latin America (Brazil, Argentina, Colombia, Rest of Latin America) |
Company Profiles | Swiss American CDMO, Pierre Fabre Group, Zymo Cosmetics, Fareva, Biofarma Srl C.F., Chemineau, C.O.C. Farmaceutici Srl, Paragon Nordic, Lonza Group, Catalent Inc., Samsung Biologics, Thermo Fisher Scientific |
Key Drivers | • Outsourcing of Complex Manufacturing Needs • Pressure to Accelerate Time-to-Market • Navigating Regulatory Complexity and Embracing Sustainability |
Restraints | • High Dependency on Third-Party Providers • Regulatory and Compliance Challenges |
Ans: According to our analysis, the CMO/CDMO Market is anticipated to reach USD 38.87 billion by 2032.
One of the fastest growing domains will be skin products, The market is growing due to increased expenditure in pharmaceutical R&D all propelling CMO/CDMO market forward.
Ans:- The CMO/CDMO Market is to grow at a CAGR of 5.86% during the forecast period 2024-2032.
Swiss American CDMO, Pierre Fabre Group, Zymo Cosmetics, Fareva, Biofarma Srl C.F., Chemineau, C.O.C. Farmaceutici Srl, Paragon Nordic, Lonza Group, Catalent Inc., Samsung Biologics, Thermo Fisher Scientific are the key players of the CMO/CDMO Market.
CMO/CDMO Market Size was valued at USD 23.32 billion in 2023.
Table of Contents
1. Introduction
1.1 Market Definition
1.2 Scope (Inclusion and Exclusions)
1.3 Research Assumptions
2. Executive Summary
2.1 Market Overview
2.2 Regional Synopsis
2.3 Competitive Summary
3. Research Methodology
3.1 Top-Down Approach
3.2 Bottom-up Approach
3.3. Data Validation
3.4 Primary Interviews
4. Market Dynamics Impact Analysis
4.1 Market Driving Factors Analysis
4.1.2 Drivers
4.1.2 Restraints
4.1.3 Opportunities
4.1.4 Challenges
4.2 PESTLE Analysis
4.3 Porter’s Five Forces Model
5. Statistical Insights and Trends Reporting
5.1 Healthcare and Pharmaceutical R&D Spending, by Region (2023)
5.2 Manufacturing Capacity Utilization Rates (2023)
5.3 Regulatory Approvals and Impact on CMO/CDMO Market (2023)
6. Competitive Landscape
6.1 List of Major Companies, By Region
6.2 Market Share Analysis, By Region
6.3 Service Benchmarking
6.3.1 Service specifications and features
6.3.2 Pricing
6.4 Strategic Initiatives
6.4.1 Marketing and promotional activities
6.4.2 Distribution and Supply Chain Strategies
6.4.3 Expansion plans and new Service launches
6.4.4 Strategic partnerships and collaborations
6.5 Technological Advancements
6.6 Market Positioning and Branding
7. CMO/CDMO Market Segmentation, by Service
7.2 Contract Development
7.2.1 Contract Development Market Trends Analysis (2020-2032)
7.2.2 Contract Development Market Size Estimates and Forecasts to 2032 (USD Billion)
7.3 Contract Manufacturing
7.3.1 Contract Manufacturing Market Trends Analysis (2020-2032)
7.3.2 Contract Manufacturing Market Size Estimates and Forecasts to 2032 (USD Billion)
7.4 Others
7.4.1 Others Market Trends Analysis (2020-2032)
7.4.2 Others Market Size Estimates and Forecasts to 2032 (USD Billion)
8. CMO/CDMO Market Segmentation, by Form
8.2 Solid Form & Powder
8.2.1 Solid Form & Powder Market Trends Analysis (2020-2032)
8.2.2 Solid Form & Powder Market Size Estimates and Forecasts to 2032 (USD Billion)
8.3 Lotions
8.3.1 Long-Term Care Facilities Market Trends Analysis (2020-2032)
8.3.2 Long-Term Care Facilities Market Size Estimates and Forecasts to 2032 (USD Billion)
8.4 Creams
8.4.1 Creams Market Trends Analysis (2020-2032)
8.4.2 Creams Market Size Estimates and Forecasts to 2032 (USD Billion)
8.5 Others
8.5.1 Others Market Trends Analysis (2020-2032)
8.5.2 Others Market Size Estimates and Forecasts to 2032 (USD Billion)
9. Regional Analysis
9.1 Chapter Overview
9.2 North America
9.2.1 Trends Analysis
9.2.2 North America CMO/CDMO Market Estimates and Forecasts, by Country (2020-2032) (USD Billion)
9.2.3 North America CMO/CDMO Market Estimates and Forecasts, by Service (2020-2032) (USD Billion)
9.2.4 North America CMO/CDMO Market Estimates and Forecasts, by Form (2020-2032) (USD Billion)
9.2.5 USA
9.2.5.1 USA CMO/CDMO Market Estimates and Forecasts, by Service (2020-2032) (USD Billion)
9.2.5.2 USA CMO/CDMO Market Estimates and Forecasts, by Form (2020-2032) (USD Billion)
9.2.6 Canada
9.2.6.1 Canada CMO/CDMO Market Estimates and Forecasts, by Service (2020-2032) (USD Billion)
9.2.6.2 Canada CMO/CDMO Market Estimates and Forecasts, by Form (2020-2032) (USD Billion)
9.2.7 Mexico
9.2.7.1 Mexico CMO/CDMO Market Estimates and Forecasts, by Service (2020-2032) (USD Billion)
9.2.7.2 Mexico CMO/CDMO Market Estimates and Forecasts, by Form (2020-2032) (USD Billion)
9.3 Europe
9.3.1 Eastern Europe
9.3.1.1 Trends Analysis
9.3.1.2 Eastern Europe CMO/CDMO Market Estimates and Forecasts, by Country (2020-2032) (USD Billion)
9.3.1.3 Eastern Europe CMO/CDMO Market Estimates and Forecasts, by Service (2020-2032) (USD Billion)
9.3.1.4 Eastern Europe CMO/CDMO Market Estimates and Forecasts, by Form (2020-2032) (USD Billion)
9.3.1.5 Poland
9.3.1.5.1 Poland CMO/CDMO Market Estimates and Forecasts, by Service (2020-2032) (USD Billion)
9.3.1.5.2 Poland CMO/CDMO Market Estimates and Forecasts, by Form (2020-2032) (USD Billion)
9.3.1.6 Romania
9.3.1.6.1 Romania CMO/CDMO Market Estimates and Forecasts, by Service (2020-2032) (USD Billion)
9.3.1.6.2 Romania CMO/CDMO Market Estimates and Forecasts, by Form (2020-2032) (USD Billion)
9.3.1.7 Hungary
9.3.1.7.1 Hungary CMO/CDMO Market Estimates and Forecasts, by Service (2020-2032) (USD Billion)
9.3.1.7.2 Hungary CMO/CDMO Market Estimates and Forecasts, by Form (2020-2032) (USD Billion)
9.3.1.8 Turkey
9.3.1.8.1 Turkey CMO/CDMO Market Estimates and Forecasts, by Service (2020-2032) (USD Billion)
9.3.1.8.2 Turkey CMO/CDMO Market Estimates and Forecasts, by Form (2020-2032) (USD Billion)
9.3.1.9 Rest of Eastern Europe
9.3.1.9.1 Rest of Eastern Europe CMO/CDMO Market Estimates and Forecasts, by Service (2020-2032) (USD Billion)
9.3.1.9.2 Rest of Eastern Europe CMO/CDMO Market Estimates and Forecasts, by Form (2020-2032) (USD Billion)
9.3.2 Western Europe
9.3.2.1 Trends Analysis
9.3.2.2 Western Europe CMO/CDMO Market Estimates and Forecasts, by Country (2020-2032) (USD Billion)
9.3.2.3 Western Europe CMO/CDMO Market Estimates and Forecasts, by Service (2020-2032) (USD Billion)
9.3.2.4 Western Europe CMO/CDMO Market Estimates and Forecasts, by Form (2020-2032) (USD Billion)
9.3.2.5 Germany
9.3.2.5.1 Germany CMO/CDMO Market Estimates and Forecasts, by Service (2020-2032) (USD Billion)
9.3.2.5.2 Germany CMO/CDMO Market Estimates and Forecasts, by Form (2020-2032) (USD Billion)
9.3.2.6 France
9.3.2.6.1 France CMO/CDMO Market Estimates and Forecasts, by Service (2020-2032) (USD Billion)
9.3.2.6.2 France CMO/CDMO Market Estimates and Forecasts, by Form (2020-2032) (USD Billion)
9.3.2.7 UK
9.3.2.7.1 UK CMO/CDMO Market Estimates and Forecasts, by Service (2020-2032) (USD Billion)
9.3.2.7.2 UK CMO/CDMO Market Estimates and Forecasts, by Form (2020-2032) (USD Billion)
9.3.2.8 Italy
9.3.2.8.1 Italy CMO/CDMO Market Estimates and Forecasts, by Service (2020-2032) (USD Billion)
9.3.2.8.2 Italy CMO/CDMO Market Estimates and Forecasts, by Form (2020-2032) (USD Billion)
9.3.2.9 Spain
9.3.2.9.1 Spain CMO/CDMO Market Estimates and Forecasts, by Service (2020-2032) (USD Billion)
9.3.2.9.2 Spain CMO/CDMO Market Estimates and Forecasts, by Form (2020-2032) (USD Billion)
9.3.2.10 Netherlands
9.3.2.10.1 Netherlands CMO/CDMO Market Estimates and Forecasts, by Service (2020-2032) (USD Billion)
9.3.2.10.2 Netherlands CMO/CDMO Market Estimates and Forecasts, by Form (2020-2032) (USD Billion)
9.3.2.11 Switzerland
9.3.2.11.1 Switzerland CMO/CDMO Market Estimates and Forecasts, by Service (2020-2032) (USD Billion)
9.3.2.11.2 Switzerland CMO/CDMO Market Estimates and Forecasts, by Form (2020-2032) (USD Billion)
9.3.2.12 Austria
9.3.2.12.1 Austria CMO/CDMO Market Estimates and Forecasts, by Service (2020-2032) (USD Billion)
9.3.2.12.2 Austria CMO/CDMO Market Estimates and Forecasts, by Form (2020-2032) (USD Billion)
9.3.2.13 Rest of Western Europe
9.3.2.13.1 Rest of Western Europe CMO/CDMO Market Estimates and Forecasts, by Service (2020-2032) (USD Billion)
9.3.2.13.2 Rest of Western Europe CMO/CDMO Market Estimates and Forecasts, by Form (2020-2032) (USD Billion)
9.4 Asia Pacific
9.4.1 Trends Analysis
9.4.2 Asia Pacific CMO/CDMO Market Estimates and Forecasts, by Country (2020-2032) (USD Billion)
9.4.3 Asia Pacific CMO/CDMO Market Estimates and Forecasts, by Service (2020-2032) (USD Billion)
9.4.4 Asia Pacific CMO/CDMO Market Estimates and Forecasts, by Form (2020-2032) (USD Billion)
9.4.5 China
9.4.5.1 China CMO/CDMO Market Estimates and Forecasts, by Service (2020-2032) (USD Billion)
9.4.5.2 China CMO/CDMO Market Estimates and Forecasts, by Form (2020-2032) (USD Billion)
9.4.6 India
9.4.5.1 India CMO/CDMO Market Estimates and Forecasts, by Service (2020-2032) (USD Billion)
9.4.5.2 India CMO/CDMO Market Estimates and Forecasts, by Form (2020-2032) (USD Billion)
9.4.5 Japan
9.4.5.1 Japan CMO/CDMO Market Estimates and Forecasts, by Service (2020-2032) (USD Billion)
9.4.5.2 Japan CMO/CDMO Market Estimates and Forecasts, by Form (2020-2032) (USD Billion)
9.4.6 South Korea
9.4.6.1 South Korea CMO/CDMO Market Estimates and Forecasts, by Service (2020-2032) (USD Billion)
9.4.6.2 South Korea CMO/CDMO Market Estimates and Forecasts, by Form (2020-2032) (USD Billion)
9.4.7 Vietnam
9.4.7.1 Vietnam CMO/CDMO Market Estimates and Forecasts, by Service (2020-2032) (USD Billion)
9.2.7.2 Vietnam CMO/CDMO Market Estimates and Forecasts, by Form (2020-2032) (USD Billion)
9.4.8 Singapore
9.4.8.1 Singapore CMO/CDMO Market Estimates and Forecasts, by Service (2020-2032) (USD Billion)
9.4.8.2 Singapore CMO/CDMO Market Estimates and Forecasts, by Form (2020-2032) (USD Billion)
9.4.9 Australia
9.4.9.1 Australia CMO/CDMO Market Estimates and Forecasts, by Service (2020-2032) (USD Billion)
9.4.9.2 Australia CMO/CDMO Market Estimates and Forecasts, by Form (2020-2032) (USD Billion)
9.4.10 Rest of Asia Pacific
9.4.10.1 Rest of Asia Pacific CMO/CDMO Market Estimates and Forecasts, by Service (2020-2032) (USD Billion)
9.4.10.2 Rest of Asia Pacific CMO/CDMO Market Estimates and Forecasts, by Form (2020-2032) (USD Billion)
9.5 Middle East and Africa
9.5.1 Middle East
9.5.1.1 Trends Analysis
9.5.1.2 Middle East CMO/CDMO Market Estimates and Forecasts, by Country (2020-2032) (USD Billion)
9.5.1.3 Middle East CMO/CDMO Market Estimates and Forecasts, by Service (2020-2032) (USD Billion)
9.5.1.4 Middle East CMO/CDMO Market Estimates and Forecasts, by Form (2020-2032) (USD Billion)
9.5.1.5 UAE
9.5.1.5.1 UAE CMO/CDMO Market Estimates and Forecasts, by Service (2020-2032) (USD Billion)
9.5.1.5.2 UAE CMO/CDMO Market Estimates and Forecasts, by Form (2020-2032) (USD Billion)
9.5.1.6 Egypt
9.5.1.6.1 Egypt CMO/CDMO Market Estimates and Forecasts, by Service (2020-2032) (USD Billion)
9.5.1.6.2 Egypt CMO/CDMO Market Estimates and Forecasts, by Form (2020-2032) (USD Billion)
9.5.1.7 Saudi Arabia
9.5.1.7.1 Saudi Arabia CMO/CDMO Market Estimates and Forecasts, by Service (2020-2032) (USD Billion)
9.5.1.7.2 Saudi Arabia CMO/CDMO Market Estimates and Forecasts, by Form (2020-2032) (USD Billion)
9.5.1.8 Qatar
9.5.1.8.1 Qatar CMO/CDMO Market Estimates and Forecasts, by Service (2020-2032) (USD Billion)
9.5.1.8.2 Qatar CMO/CDMO Market Estimates and Forecasts, by Form (2020-2032) (USD Billion)
9.5.1.9 Rest of Middle East
9.5.1.9.1 Rest of Middle East CMO/CDMO Market Estimates and Forecasts, by Service (2020-2032) (USD Billion)
9.5.1.9.2 Rest of Middle East CMO/CDMO Market Estimates and Forecasts, by Form (2020-2032) (USD Billion)
9.5.2 Africa
9.5.2.1 Trends Analysis
9.5.2.2 Africa CMO/CDMO Market Estimates and Forecasts, by Country (2020-2032) (USD Billion)
9.5.2.3 Africa CMO/CDMO Market Estimates and Forecasts, by Service (2020-2032) (USD Billion)
9.5.2.4 Africa CMO/CDMO Market Estimates and Forecasts, by Form (2020-2032) (USD Billion)
9.5.2.5 South Africa
9.5.2.5.1 South Africa CMO/CDMO Market Estimates and Forecasts, by Service (2020-2032) (USD Billion)
9.5.2.5.2 South Africa CMO/CDMO Market Estimates and Forecasts, by Form (2020-2032) (USD Billion)
9.5.2.6 Nigeria
9.5.2.6.1 Nigeria CMO/CDMO Market Estimates and Forecasts, by Service (2020-2032) (USD Billion)
9.5.2.6.2 Nigeria CMO/CDMO Market Estimates and Forecasts, by Form (2020-2032) (USD Billion)
9.6 Latin America
9.6.1 Trends Analysis
9.6.2 Latin America CMO/CDMO Market Estimates and Forecasts, by Country (2020-2032) (USD Billion)
9.6.3 Latin America CMO/CDMO Market Estimates and Forecasts, by Service (2020-2032) (USD Billion)
9.6.4 Latin America CMO/CDMO Market Estimates and Forecasts, by Form (2020-2032) (USD Billion)
9.6.5 Brazil
9.6.5.1 Brazil CMO/CDMO Market Estimates and Forecasts, by Service (2020-2032) (USD Billion)
9.6.5.2 Brazil CMO/CDMO Market Estimates and Forecasts, by Form (2020-2032) (USD Billion)
9.6.6 Argentina
9.6.6.1 Argentina CMO/CDMO Market Estimates and Forecasts, by Service (2020-2032) (USD Billion)
9.6.6.2 Argentina CMO/CDMO Market Estimates and Forecasts, by Form (2020-2032) (USD Billion)
9.6.7 Colombia
9.6.7.1 Colombia CMO/CDMO Market Estimates and Forecasts, by Service (2020-2032) (USD Billion)
9.6.7.2 Colombia CMO/CDMO Market Estimates and Forecasts, by Form (2020-2032) (USD Billion)
9.6.8 Rest of Latin America
9.6.8.1 Rest of Latin America CMO/CDMO Market Estimates and Forecasts, by Service (2020-2032) (USD Billion)
9.6.8.2 Rest of Latin America CMO/CDMO Market Estimates and Forecasts, by Form (2020-2032) (USD Billion)
10. Company Profiles
10.1 Catalent, Inc.
10.1.1 Company Overview
10.1.2 Financial
10.1.3 Products/ Services Offered
10.1.4 SWOT Analysis
10.2 Lonza Group
10.2.1 Company Overview
10.2.2 Financial
10.2.3 Products/ Services Offered
10.2.4 SWOT Analysis
10.3 Paragon Nordic
10.3.1 Company Overview
10.3.2 Financial
10.3.3 Products/ Services Offered
10.3.4 SWOT Analysis
10.4 C.O.C. Farmaceutici Srl
10.4.1 Company Overview
10.4.2 Financial
10.4.3 Products/ Services Offered
10.4.4 SWOT Analysis
10.5 Chemineau
10.5.1 Company Overview
10.5.2 Financial
10.5.3 Products/ Services Offered
10.5.4 SWOT Analysis
10.6 Fareva
10.6.1 Company Overview
10.6.2 Financial
10.6.3 Products/ Services Offered
10.6.4 SWOT Analysis
10.7 Biofarma Srl C.F.
10.7.1 Company Overview
10.7.2 Financial
10.7.3 Products/ Services Offered
10.7.4 SWOT Analysis
10.8 Zymo Cosmetics
10.8.1 Company Overview
10.8.2 Financial
10.8.3 Products/ Services Offered
10.8.4 SWOT Analysis
10.9 Pierre Fabre Group
10.9.1 Company Overview
10.9.2 Financial
10.9.3 Products/ Services Offered
10.9.4 SWOT Analysis
10.10 Swiss American CDMO
10.10.1 Company Overview
10.10.2 Financial
10.10.3 Products/ Services Offered
10.10.4 SWOT Analysis
11. Use Cases and Best Practices
12. Conclusion
An accurate research report requires proper strategizing as well as implementation. There are multiple factors involved in the completion of good and accurate research report and selecting the best methodology to compete the research is the toughest part. Since the research reports we provide play a crucial role in any company’s decision-making process, therefore we at SNS Insider always believe that we should choose the best method which gives us results closer to reality. This allows us to reach at a stage wherein we can provide our clients best and accurate investment to output ratio.
Each report that we prepare takes a timeframe of 350-400 business hours for production. Starting from the selection of titles through a couple of in-depth brain storming session to the final QC process before uploading our titles on our website we dedicate around 350 working hours. The titles are selected based on their current market cap and the foreseen CAGR and growth.
The 5 steps process:
Step 1: Secondary Research:
Secondary Research or Desk Research is as the name suggests is a research process wherein, we collect data through the readily available information. In this process we use various paid and unpaid databases which our team has access to and gather data through the same. This includes examining of listed companies’ annual reports, Journals, SEC filling etc. Apart from this our team has access to various associations across the globe across different industries. Lastly, we have exchange relationships with various university as well as individual libraries.
Step 2: Primary Research
When we talk about primary research, it is a type of study in which the researchers collect relevant data samples directly, rather than relying on previously collected data. This type of research is focused on gaining content specific facts that can be sued to solve specific problems. Since the collected data is fresh and first hand therefore it makes the study more accurate and genuine.
We at SNS Insider have divided Primary Research into 2 parts.
Part 1 wherein we interview the KOLs of major players as well as the upcoming ones across various geographic regions. This allows us to have their view over the market scenario and acts as an important tool to come closer to the accurate market numbers. As many as 45 paid and unpaid primary interviews are taken from both the demand and supply side of the industry to make sure we land at an accurate judgement and analysis of the market.
This step involves the triangulation of data wherein our team analyses the interview transcripts, online survey responses and observation of on filed participants. The below mentioned chart should give a better understanding of the part 1 of the primary interview.
Part 2: In this part of primary research the data collected via secondary research and the part 1 of the primary research is validated with the interviews from individual consultants and subject matter experts.
Consultants are those set of people who have at least 12 years of experience and expertise within the industry whereas Subject Matter Experts are those with at least 15 years of experience behind their back within the same space. The data with the help of two main processes i.e., FGDs (Focused Group Discussions) and IDs (Individual Discussions). This gives us a 3rd party nonbiased primary view of the market scenario making it a more dependable one while collation of the data pointers.
Step 3: Data Bank Validation
Once all the information is collected via primary and secondary sources, we run that information for data validation. At our intelligence centre our research heads track a lot of information related to the market which includes the quarterly reports, the daily stock prices, and other relevant information. Our data bank server gets updated every fortnight and that is how the information which we collected using our primary and secondary information is revalidated in real time.
Step 4: QA/QC Process
After all the data collection and validation our team does a final level of quality check and quality assurance to get rid of any unwanted or undesired mistakes. This might include but not limited to getting rid of the any typos, duplication of numbers or missing of any important information. The people involved in this process include technical content writers, research heads and graphics people. Once this process is completed the title gets uploader on our platform for our clients to read it.
Step 5: Final QC/QA Process:
This is the last process and comes when the client has ordered the study. In this process a final QA/QC is done before the study is emailed to the client. Since we believe in giving our clients a good experience of our research studies, therefore, to make sure that we do not lack at our end in any way humanly possible we do a final round of quality check and then dispatch the study to the client.
By Service
By Form
Request for Segment Customization as per your Business Requirement: Segment Customization Request
Regional Coverage:
North America
Europe
Asia Pacific
Middle East & Africa
Middle East
Africa
Latin America
Request for Country Level Research Report: Country Level Customization Request
Available Customization
With the given market data, SNS Insider offers customization as per the company’s specific needs. The following customization options are available for the report:
The Medical Equipment Rental Market was valued at USD 58.57 Billion in 2023 and is expected to reach USD 97.69 billion by 2032 and grow at a CAGR of 5.85% over the forecast period 2024-2032.
The Cardiac Safety Services Market Size was valued at USD 740 Million in 2023 and is expected to reach USD 1,888.34 Million by 2032 and grow at a CAGR of 11.48% over the forecast period 2024-2032.
The Antimicrobial Resistance Surveillance Market was valued at USD 5.90 Billion in 2023 and is projected to grow to USD 9.50 billion by 2032 with a CAGR of 5.47% over the forecast period 2024-2032.
The Capnography Devices Market size was valued at USD 605.37 million in 2023 and is expected to reach USD 1460.84 million by 2032 and grow at a CAGR of 10.28% over the forecast period 2024-2032.
The Autoimmune Disease Therapeutics Market Size valued at $72.34 Bn in 2023, expected to reach $116.81 Bn by 2032, growing at a 5.52% CAGR by 2032.
eClinical Solutions Market was valued at USD 10.10 billion in 2023 and is expected to reach USD 32.84 billion by 2032 and grow at a CAGR of 14.01% from 2024-2032.
Hi! Click one of our member below to chat on Phone