Cloud Applications Market Report Scope & Overview:
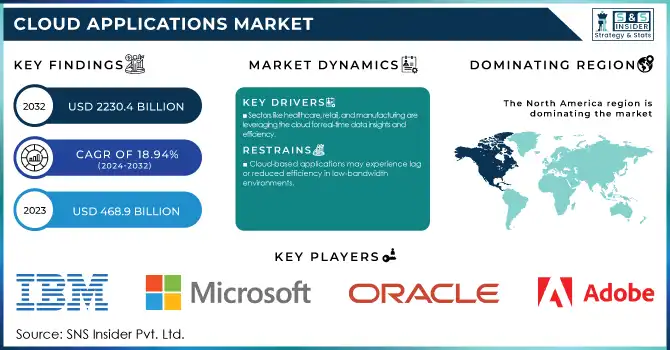
The Cloud Applications Market was valued at USD 468.9 Billion in 2023 and is expected to reach USD 2230.4 Billion by 2032, growing at a CAGR of 18.94% from 2024-2032.
To get more information on Cloud Applications Market - Request Free Sample Report
The global cloud applications market is growing due to pervasive digital transformation, rising adoption of cloud services among businesses and industries, and advancements in artificial intelligence and machine learning. From scalability to cost-effectiveness to flexibility to better collaboration, a cloud-based solution is helping businesses in almost every industry migrate and manage their workloads. The market is expanding as organizations worldwide increase their dependence on Software-as-a-Service solutions for their enterprise functions, such as CRM, ERP, HCM, and SCM. AI and automation have become an integral part of cloud applications type on the cloud, which is one of the drivers responsible for growth. We are talking about AI-powered analytics, predictive maintenance, and automation tools that provide operational efficiency, real-time decision-making, and improved customer experiences. Hybrid & multi-cloud environments are also driving the market as enterprise customers are moving to distribute workloads more efficiently across different cloud infrastructures to achieve the best trade-off between cost & security vs performance. The other trend is the increase in the adoption of cloud-native applications and microservices architectures to allow enterprises to build and deploy applications with greater speed and agility.
Security and compliance issues still are at the forefront of cloud adoption. To reduce cybersecurity risks, companies are investing in security-driven infrastructure such as zero-trust security architectures, encryption, and IAM. As laws regarding data protection, especially in control industries like finance and healthcare, force changes in technology usage, cloud applications are being adopted accordingly. The need for cloud collaboration and productivity tools to facilitate remote and hybrid work continues to drive demand for cloud collaboration and productivity tools to enable remote and hybrid workflows. Additionally, businesses in sectors like retail, healthcare, and manufacturing use cloud apps for instant data analysis, thereby optimizing customer interaction and enhancing supply chain productivity.
Cloud Applications Market Dynamics
Drivers
-
Sectors like healthcare, retail, and manufacturing are leveraging the cloud for real-time data insights and efficiency.
Cloud applications are being rapidly adopted by various industries, including healthcare, retail, and manufacturing, to facilitate better decision-making, drive efficiency, and enable immediate data insights. Cloud-enabled platforms help manage electronic health records, facilitate telemedicine, and enable AI-aided diagnostics in healthcare, conveniently allowing medical professionals to access patient data safely and effectively. They provide interoperability between healthcare systems, making sure that demographic data exchange can take place with adherence to regulatory requirements like HIPAA and GDPR.
Cloud applications are disrupting the retail value chain with AI-enabled analytics, hyper-personalized marketing, and demand forecasting. Retailers use cloud-based point-of-sale systems, inventory management solutions, and omnichannel commerce platforms to plan supply chains, lower operational costs, and increase customer interaction. Processing millions of transaction data every second provides firms with the information they require regarding consumer preferences facilitating promotional offers and dynamic pricing. Cloud applications are being used to improve production, supply chain management, and predictive maintenance in manufacturing industries. As a technology on the industrial level, the combination of IoT and cloud computing allows for real-time monitoring of equipment performance, reducing downtime and improving operational efficiency. Better cooperation across global manufacturing networks and productivity and lower costs and price of possession per product are possible through cloud-based enterprise resource planning and product lifecycle management systems. The use of cloud applications is leading to innovation as well as operational efficiency, and improved decision-making in these industries. Spurred by the increasing demand for data-driven insights and automation the adoption of cloud in healthcare, retail, and manufacturing is likely to remain on the rise, and will further strengthen the cloud applications market.
-
Businesses are rapidly shifting to cloud-based solutions to enhance efficiency, agility, and scalability.
-
AI-driven analytics, automation, and predictive maintenance improve operational efficiency and decision-making.
Restraints
-
Cloud-based applications may experience lag or reduced efficiency in low-bandwidth environments.
Cloud applications depend on steady and fast internet connectivity to provide their best performance. Such applications might use latency, latency, sluggish response time, and much less performance in a low-bandwidth atmosphere, which harms consumer experience and universal performance. For industries working in far-flung or hinterland places with little community infrastructure, ongoing accessibility to cloud resources is difficult — which means popular touchpoints or real-time determining, and disclosure to and of tools, can be impossible.
For example, in industries such as healthcare, telemedicine portals, and electronic health record systems need high-speed connectivity to provide patients with seamless video consultations and to retrieve information at a moment's notice. Patient care and decision-making could be impaired by any lag in the network. Likewise, in retail, demand for cloud-based point-of-sale systems and inventory management solutions relies on real-time data synchronization. Poor internet can cause transaction delays and product mismatches, and it can make your customers unsatisfied. Industrial IoT and cloud-based enterprise resource planning systems placed within a given business vertical also have to constantly exchange data for predictive maintenance and supply chain optimization. Additionally, it may create latency challenges in the detection of the fault in the equipment that may take place in the low bandwidth spaces or inventory shortfalls may result in operational inefficiencies. Specifically, businesses are helping ease these issues by adopting edge computing and hybrid cloud models as well as content delivery networks to help limit unnecessary dependence on centralized cloud infrastructure. Lastly, it is anticipated that enhancements in 5G and satellite-based Internet connections will help make cloud applications faster in areas with limited bandwidth. Nevertheless, though these measures have been taken, network constraints remain a key hindrance to the mass market of cloud applications, especially in emerging markets where digital infrastructure is not so developed.
-
Increasing cyber threats and compliance requirements pose challenges to cloud adoption.
-
Integration challenges between legacy systems and modern cloud applications hinder seamless operations.
Cloud Applications Market Segment Analysis
By Application
In 2023 Customer Relationship Management segment dominated the market and represented a significant revenue share. The CRM system plays a vital role in the above scenario as it helps to manage all the customer information and interactions. Cloud-based CRM-using applications enable businesses with improved customer service, sales process management, and marketing services that are accessible anywhere, anytime. Such accessibility is particularly useful in remote and hybrid setups, where access to real-time customer data across departments is crucial. In addition, the scalability and integration capabilities of cloud-based CRM platforms completely evoke their appeal as they can help enrich customer data and provide a holistic view of the customer journey. The combination of these tools allows for advanced analytics and personalized customer experiences, thereby resulting in increased engagement and higher rates of satisfaction.
The Business Intelligence and Analytics market is expected to exhibit the fastest compound annual growth rate. This explosive growth is fueled by the need for data-driven insights across industries. More organizations are realizing the need to invest in cloud-based and analytics solutions to get visualized and on-time information for operational efficiency and to stay ahead of the competition. Cloud platforms offer the advantage of scalability, enabling companies to process high amounts of data and run complex analyses without needing to invest in local hardware. In addition, advanced technologies such as AI and ML integrated into BI tools extend predictive analytics capabilities in organizations to adjust trends and strategic decisions. The segment is expected to remain strong, supported by a rising trend of cloud-based BI and analytics solutions due to increased data generation across enterprises in the future.
By Organization Size
The Large enterprise segment dominated the market and represented a revenue share of more than 71% in 2023. For example, large enterprises come with huge budgets, resources, and a lot of infrastructure to support the adoption of the most advanced cloud solutions on a large scale. Cloud-based applications help them manage complex operations, increase productivity, and ensure decision-making in multiple departments is grounded in data. Cloud apps like CRM, ERP, and BI tools are critical for large enterprises that need to cope with massive amounts of data, optimize the supply chain, improve customer engagement, and innovate new products to keep pace with the market. As the focus shifts towards harnessing digital transformation and operational efficiency, large enterprises will continue to opt for cloud solutions, maintaining their market presence over the next few years.
The cloud applications market is expected to grow at the fastest rate in the SME segment. Cloud-based solutions are more affordable, and scalable, and provide access to enterprise-grade tools without the heavy upfront investment that has made them so appealing to SMEs. SMEs can make use of Cloud applications to ease business processes and improve customer relationship management and data statistics that were either costly or not feasible by larger organizations. Digitalization is still in the hyper-accelerated phase and it seems that most of the SMEs are finding a way to benefit from integrating cloud solutions, especially customer, collaboration, and analytics. The SME segment represents a tremendous opportunity for fast growth and expansion of the market as cloud adoption becomes increasingly ubiquitous and customized solutions become available.
Regional Analysis
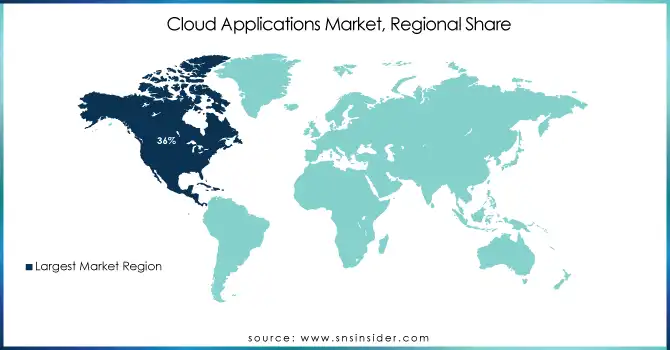
North America dominated the market and accounted for a revenue share of more than 36% in 2023. The leadership is due to the higher cloud adaptation in the region as an outcome of the increase in the different sectors or industries such as college, finance, medical, and store. Reassured IT infrastructure and well-established cloud ecosystems with a major supply of topmost cloud service providers strengthen innovation and scalability in North America. Furthermore, the expansion in adoption of cloud-based solutions, including digitalization, cost-efficiency, and faster business agility, further bolsters the market growth. Demand for cloud applications continues to be buoyed in North America as organizations double down on investments in AI, analytics, and automation, keeping the region dominant for the foreseeable future,
The cloud applications market is witnessing strong growth in the Asia-Pacific region, which is anticipated to dominate the cloud applications market in the foreseen period registering the fastest CAGR. Countries such as China, India, and Japan have been undergoing an unprecedented digital transformation that is fueling the demand for cloud-driven solutions. Significant growth factors include increased investments in cloud infrastructure, the growth of Small and Medium-sized enterprises, and government initiatives encouraging the adoption of cloud services. In addition, the growing adoption of cloud solutions in various industries such as IT, retail, health care, manufacturing, and finance is driving the use of cloud applications in the region. The APAC region is expected to accelerate faster as cloud technology becomes more accessible and affordable with several businesses showing interest in the cloud applications market.
Get Customized Report as per Your Business Requirement - Enquiry Now
Key Players
The major key players along with their headquarters
-
Salesforce, Inc. - San Francisco, California, USA
-
Microsoft Corporation - Redmond, Washington, USA
-
Oracle Corporation - Redwood Shores, California, USA
-
SAP SE - Walldorf, Germany
-
Adobe Inc. - San Jose, California, USA
-
Google Cloud - Mountain View, California, USA
-
Amazon Web Services (AWS) - Seattle, Washington, USA
-
IBM Corporation - Armonk, New York, USA
-
ServiceNow - Santa Clara, California, USA
-
Workday, Inc. - Pleasanton, California, USA
-
Zoho Corporation - Chennai, India
-
HubSpot, Inc. - Cambridge, Massachusetts, USA
-
Atlassian - Sydney, Australia
-
RingCentral, Inc. - Belmont, California, USA
-
Freshworks - San Mateo, California, USA
|
Report Attributes |
Details |
|
Market Size in 2023 |
USD 468.9 Billion |
|
Market Size by 2032 |
USD 2230.4 Billion |
|
CAGR |
CAGR of 18.94% From 2024 to 2032 |
|
Base Year |
2023 |
|
Forecast Period |
2024-2032 |
|
Historical Data |
2020-2022 |
|
Report Scope & Coverage |
Market Size, Segments Analysis, Competitive Landscape, Regional Analysis, DROC & SWOT Analysis, Forecast Outlook |
|
Key Segments |
• By Applications (Customer Relationship Management (CRM), Enterprise Resource Management (ERM), Human Capital Management (HCM), Content Management, Collaboration and Productive Suites, Supply Chain Management (SCM), Business Intelligence (BI) and Analytics, Others) |
|
Regional Analysis/Coverage |
North America (US, Canada, Mexico), Europe (Eastern Europe [Poland, Romania, Hungary, Turkey, Rest of Eastern Europe] Western Europe] Germany, France, UK, Italy, Spain, Netherlands, Switzerland, Austria, Rest of Western Europe]), Asia Pacific (China, India, Japan, South Korea, Vietnam, Singapore, Australia, Rest of Asia Pacific), Middle East & Africa (Middle East [UAE, Egypt, Saudi Arabia, Qatar, Rest of Middle East], Africa [Nigeria, South Africa, Rest of Africa], Latin America (Brazil, Argentina, Colombia, Rest of Latin America) |
|
Company Profiles |
Salesforce, Microsoft Corporation, Oracle Corporation, SAP SE, Adobe Inc., Google Cloud, Amazon Web Services (AWS), IBM Corporation, ServiceNow, Workday, Inc., Zoho Corporation, HubSpot, Inc., Atlassian, RingCentral, Inc., Freshworks |
|
Key Drivers |
• Businesses are rapidly shifting to cloud-based solutions to enhance efficiency, agility, and scalability. |
|
RESTRAINTS |
• Increasing cyber threats and compliance requirements pose challenges to cloud adoption. |
