Global Clear Aligners Market Size Overview:
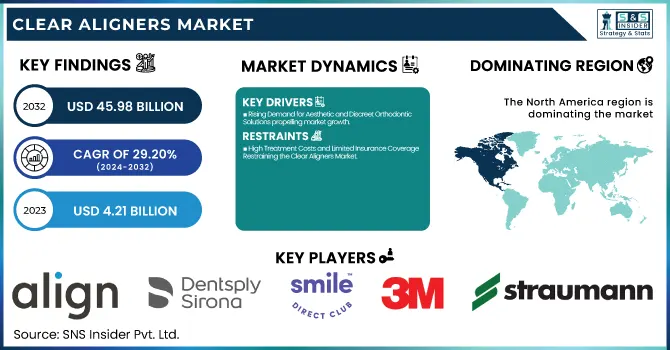
The Clear Aligners Market size was valued at USD 4.21 billion in 2023 and is projected to reach USD 45.98 billion by 2032, with a CAGR of 29.20% from 2024 to 2032.
To Get More Information on Clear Aligners Market - Request Sample Report
The Clear Aligners Market report provides a regional overview of the adoption and utilization of aligners, highlighting regional differences in consumer preferences and the integration of technology. Moreover, the report details the sales volume of clear aligners and regions, providing a long-term perspective on the market. This report presents a detailed examination of healthcare expenditure on orthodontics across regions as broken down into government, commercial, private, and out-of-pocket sectors, cumulating an unprecedented insight into the monetary side of orthodontics at the macroeconomic level.
Clear Aligners Market Dynamics
Drivers
-
Rising Demand for Aesthetic and Discreet Orthodontic Solutions propelling market growth
The increasing demand for clear aligner treatments among adults and adolescents who prefer aesthetic dental solutions is driving the growth of the clear aligners market in Europe. Orthodontic treatments can be done in an aesthetically pleasing manner without the need for metal braces unlike in traditional metal treatments, clear aligners do not affect the patient in daily life, emphasizing patient compliance conveniently. Roughly 80% of orthodontics patients in North America prefer clear aligners over unsightly metal braces, with aesthetic appeal and ease of wear among the leading reasons, according to the American Association of Orthodontists (AAO). Another factor fueling this growth is the 2023 survey by the British Orthodontic Society (BOS), which showed reports that over the past five years, clear aligner treatments have seen an increase in the UK of over 60%. This demand has resulted in significant changes in the industry, including Straumann Group's sale of its DrSmile clear aligner business to Impress Group in August 2024, enabling it to reprioritize towards business-to-business (B2B) orthodontic solutions.
-
Technological advancements, particularly in 3D printing and AI-powered treatment planning, have revolutionized the clear aligner market by improving manufacturing efficiency and treatment precision.
AI-powered software can produce personalized aligners with up to 50% more accuracy in predicting tooth movements — and cut total treatment time. A recent 2023 example of AI integration, optimizing and simplifying digital workflow in orthodontics, is the launch of the Plan Editor in Align Technology's ClinCheck treatment planning software. Additionally, Dentsply Sirona, along with SmileDirectClub, has also started to use AI-powered virtual assessment to enhance the accessibility of remote orthodontics. The emergence of direct-to-consumer (DTC) clear aligner brands and advancements in orthodontics are also fueling market growth, leading to more cost-effective and widely accessible orthodontic treatment options across the globe.
Restraint
-
High Treatment Costs and Limited Insurance Coverage Restraining the Clear Aligners Market.
High treatment costs limiting accessibility is the key restraint in the clear aligners market, especially in price-sensitive areas. Clear aligners range in price from USD 3,000 to USD 8,000, based on the complexity level of the case, and this is a significant increase in price in comparison to traditional metal braces. Furthermore, movement toward clear aligners is often not covered by dental insurance, as these treatments are typically regarded as cosmetic treatment rather than medical needs. According to a 2023 survey conducted by the National Association of Dental Plans (NADP), only 35% of dental insurance policies in the U.S. provide partial coverage for clear aligners, limiting adoption rates among middle- and lower-income patients. Given its affordability challenges, market penetration of minimally invasive surgeries is slow, especially in developing economies where disposable income available for elective procedures is low.
Opportunities
-
Expanding Access to Clear Aligners Through E-Commerce and Direct-to-Consumer Sales Models Presents Significant Market Growth Potential
The growing trend of e-commerce and direct-to-consumer (DTC) models presents a significant opportunity for clear aligner companies. These companies are bringing aligners to a greater audience by also providing online consultations, home impression kits, and financing at an appealing interest rate. Further leveraging their market reach, brands can capitalize on consumers' familiarity with buying orthodontic solutions online. It reduces overhead costs and offers more convenient and affordable options to patients, resulting in the evolution of the market as it has gained momentum in developed to emerging markets.
Challenges
-
Regulatory and Compliance Barriers in Different Regions May Hinder the Global Expansion of Clear Aligners
Clear aligners face significant regulatory challenges in different markets, particularly when it comes to obtaining approvals from healthcare authorities. Different countries also face different regulations that can slow the expansion of clear aligner companies or hinder their entry into this market. Moreover, complying with local healthcare and safety regulations can demand significant investment in R&D and certification. While navigating the complexities of trade compliance is just one aspect of global expansion, navigating it can prove both logistically and financially overwhelming for businesses as regulations continue to evolve.
Clear Aligners Market Segmentation Insights
By Age
In 2023, the Adult segment held a dominant share of 59% in the clear aligners market, driven by increasing consumer awareness of orthodontic treatments that offer convenience and aesthetics. More adults are turning to clear aligners because their design is discreet and more comfortable than traditional braces. One example is Invisalign (Align Technology), whose offering is a custom solution that works for different adult lifestyles. Recent product launches, such as the Invisalign Full Treatment and the more recent and streamlined option offered by SmileDirectClub, particularly appeal to adults looking to subtly straighten their smile while experiencing minimal disruption to their everyday lives.
The Teens segment is projected to grow at the highest CAGR during the forecasted period, driven by increasing demand for orthodontic treatments that are more comfortable and less noticeable. With knowledge of clear aligners on the increase, teenagers are increasingly more willing to choose them over traditional braces due to the already-mentioned aesthetic and minimal-disruption solutions offered. Align Technology Company is one of the companies to create an age-specific product line with Invisalign Teen, including special features that cater to this unique age group, including eruption compensation and compliance indicators.
By Type
In 2023, the Polyurethane segment dominated the market with a 76% market share of the clear aligners market, primarily due to its superior material properties, such as flexibility, durability, and comfort. Polyurethane, known for its strength and clarity, makes it the most popular material used for creating clear aligners. Market leaders, such as Align Technology and its Invisalign brand, have been constantly innovating in this space, including through the use of sophisticated polyurethane formulas to improve aligner comfort and wearability. The best part is that this material is easier to adapt to their teeth and less susceptible to staining or discoloration, making it an optimal choice for adults and teens alike. Additionally, companies such as SmileDirectClub have expanded their use of polyurethane in aligner production, launching new products designed for improved fit and longer-lasting results.
By End-Use
In 2023, the stand-alone practices segment dominated the market with a 55% market share in the clear aligners market, driven by the growing number of independent dental professionals offering personalized orthodontic solutions. Stand-alone dental practices benefit from their ability to provide tailored treatments and more direct patient care, which is particularly appealing for clear aligner users seeking customized services.
Additionally, as digital dental technologies evolve, increasing numbers of stand-alone practices are investing in 3D scanning and digital impressions, which make for more rapid and accurate aligner fabrication. These innovations have also solidified stand-alone practices as the leading end-user segment. Strong growth is also anticipated through stand-alone practices due to a market trend of patients seeking direct consultation with experts in a private setting, which is helping to strengthen further the leading market share clear aligners have in the orthodontic treatment market.
By Distribution Channel
In 2023, the offline segment dominated the market with a 74% market share of the clear aligners market, largely driven by the traditional distribution through dental clinics, orthodontists, and stand-alone practices. The offline model remains the preferred choice for many patients due to the personalized consultation and treatment options it provides.
The face-to-face interaction allows for customized treatment plans, real-time adjustments, and better patient monitoring throughout the aligner process. Furthermore, the offline segment offers patients a higher level of trust and assurance, with in-person evaluations and hands-on care from orthodontic specialists. In response to growing demand, SmileDirectClub has also ventured into the offline space by launching physical stores and smile shops, offering consultations and impressions for clear aligners.
Regional Analysis of the Clear Aligners Market
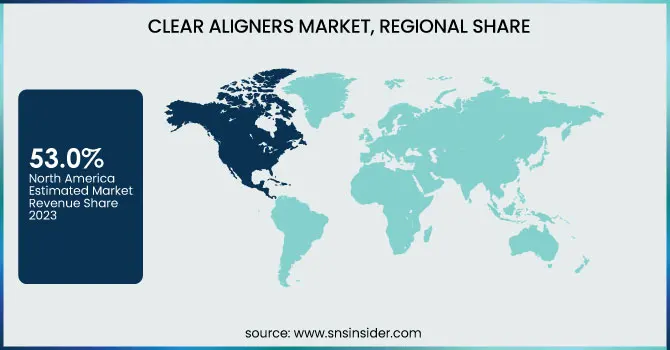
North America dominated the market and accounted for 53.0% of the market share of the clear aligners market in 2023. The dominance is primarily attributed to the growing adoption of clear aligners, particularly in the U.S. As an advanced medical care system with high disposable income and a rising urbanized population capable of funding aesthetic dental treatment, it boosts the demand. Moreover, North America has high levels of confidence among consumers in orthodontic treatment aided by accredited dental professionals, emerging dental technologies, and successful marketing campaigns. Furthermore, its market attractiveness is bolstered by a regional preference for discrete, comfortable, and effective products and improved access to financing for procedures.
The Asia Pacific region is predicted to witness the fastest-growing CAGR, projected at a CAGR of approximately 32.96% from 2024 to 2032. The orthodontic Treatment market in Asia is going to become one of the novel growing markets in the region due to an increase in awareness towards orthodontic treatments, an increase in disposable income, and a growing middle class in some major Asian countries like China, India, and Japan. With the increasing demand for cosmetic dentistry among young adults and teens, interest in clear aligners is booming, given the lower aesthetic impact. In addition, continuing development in digital technologies (e.g., 3D imaging and remote consultations) is giving patients more access to clear aligners and further driving adoption in this growing industry.
Do You Need any Customization Research on Clear Aligners Market - Enquire Now
Key Players in the Clear Aligners Market
-
Align Technology, Inc. (Invisalign Full, Invisalign Go)
-
Dentsply Sirona (SureSmile Aligners, Byte Aligners)
-
SmileDirectClub, Inc. (Nighttime Aligners, Impression Kit)
-
3M Company (Clarity Aligners, Unitek Treatment Planning)
-
Straumann Group (ClearCorrect, Smilers Aligners)
-
Ormco Corporation (Spark Aligners, Damon Clear Aligners)
-
Angel Align Technology Inc. (Angel Aligner Pro, Angel Aligner Classic)
-
Byte (A Dentsply Sirona Company) (HyperByte, Byte At-Night Aligners)
-
Candid Co. (CandidPro, Candid Clear Aligners)
-
SmileLife (SmileLife Day Aligners, SmileLife Night Aligners)
-
SnapCorrect (SnapCorrect Invisible Aligners, Whitening Foam)
-
WonderSmile (WonderSmile Day Aligners, WonderSmile Night Aligners)
-
EZ Smile (EZ Smile Clear Aligners, EZ Smile Retainers)
-
Uniform Teeth (Uniform Teeth Aligners, Uniform Retainers)
-
Grin (Grin Remote Monitoring, Grin Custom Aligners)
-
Bitesoft Co. (Bitesoft Day Aligners, Bitesoft Night Aligners)
-
Smile2Impress (Impress Standard Aligners, Impress Night Aligners)
-
NewSmile (NewSmile Day Aligners, NewSmile Night Aligners)
-
Zenyum (ZenyumClear, ZenyumClear Plus)
-
AORTA Orthodontics (AORTA Clear Aligners, AORTA Retainers)
Suppliers (These suppliers are pivotal in providing the materials, tools, and technology required for producing clear aligners, supporting both manufacturers and end-users in the orthodontic and dental fields.)
-
Align Technology, Inc.
-
Dentsply Sirona
-
3M Company
-
Ormco Corporation
-
Straumann Group
-
Angel Align Technology Inc.
-
SmileDirectClub, Inc.
-
Candid Co.
-
Grin
-
SnapCorrect
Recent Development in the Clear Aligners Industry
-
On August 22, 2024, Angelalign Technology Inc. announced its financial results for the first half of 2024 with continued strong growth in international markets. The company saw strong growth in major overseas markets and also continued to make progress at home in China.
-
In August 2024, Straumann Group announced its agreement to divest its DrSmile clear aligner business to Impress Group. This strategic move is consistent with Straumann’s focus on business-to-business (B2B) orthodontic products and services. Impress will also use the DrSmile brand to expand into new markets in Europe, although Straumann will maintain a minority share in the business.
-
September 6, 2023—Align Technology, Inc., the global medical device company known for transforming smiles and changing lives with its innovative Invisalign clear aligners, iTero intraoral scanners, and Exocad CAD/CAM software solutions, announced the release of Plan Editor for enhanced treatment planning available in ClinCheck treatment planning software.
| Report Attributes | Details |
|---|---|
| Market Size in 2023 | US$ 4.21 Billion |
| Market Size by 2032 | US$ 45.98 Billion |
| CAGR | CAGR of 29.20% From 2024 to 2032 |
| Base Year | 2023 |
| Forecast Period | 2024-2032 |
| Historical Data | 2020-2022 |
| Report Scope & Coverage | Market Size, Segments Analysis, Competitive Landscape, Regional Analysis, DROC & SWOT Analysis, Forecast Outlook |
| Key Segments | • By Age (Adults, Teens) • By Type (Polyurethane, Plastic Polyethylene Terephthalate Glycol, Others) • By End-Use (Hospitals, Stand Alone Practices, Group Practices, Others) • By Distribution Channel (Online, Offline) |
| Regional Analysis/Coverage | North America (US, Canada, Mexico), Europe (Eastern Europe [Poland, Romania, Hungary, Turkey, Rest of Eastern Europe] Western Europe] Germany, France, UK, Italy, Spain, Netherlands, Switzerland, Austria, Rest of Western Europe]), Asia Pacific (China, India, Japan, South Korea, Vietnam, Singapore, Australia, Rest of Asia Pacific), Middle East & Africa (Middle East [UAE, Egypt, Saudi Arabia, Qatar, Rest of Middle East], Africa [Nigeria, South Africa, Rest of Africa], Latin America (Brazil, Argentina, Colombia, Rest of Latin America) |
| Company Profiles | Align Technology, Inc., Dentsply Sirona, SmileDirectClub, Inc., 3M Company, Straumann Group, Ormco Corporation, Angel Align Technology Inc., Byte (A Dentsply Sirona Company), Candid Co., SmileLife, SnapCorrect, WonderSmile, EZ Smile, Uniform Teeth, Grin, Bitesoft Co., Smile2Impress, NewSmile, Zenyum, AORTA Orthodontics, and other players. |
