Get More Information on Cleanroom robots in the healthcare market - Request Sample Report
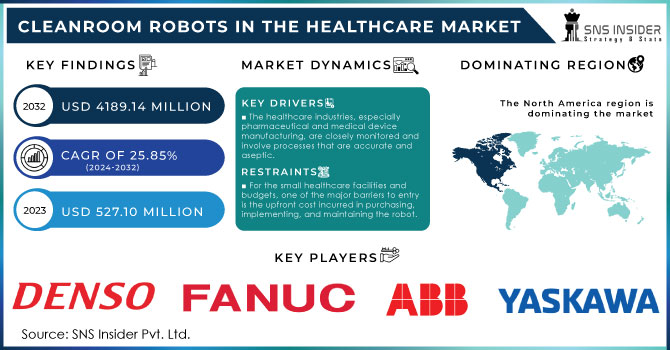
The Cleanroom Robots in the Healthcare Market size is projected to reach USD 4189.14 million by 2032 and grow at a CAGR of 25.85% over 2024-2032. The market was valued at USD 527.10 million in 2023.
Several key drivers drive the demand for cleanroom robots in the healthcare market, all contributing greatly to the growth of the market. First, with the growing concern about maintaining ultra-clean hygiene standards and reducing human contamination in pharmaceutical and biotech industries, the growing adoption has resulted in roughly 45% of healthcare facilities enhancing their automation processes using cleanroom robots. The growth in medical device manufacturing, accounting for almost 35% of demand, continues to fuel the need for precision and homogeneity in production environments. Regulatory pressure has also been promoting this trend of changeover to robotics because, with regard to new guiding principles for reducing the risks of contamination, more than 50% of pharmaceutical companies have adopted such technologies. Apart from that, increasing personalized medicine and growing biologics are other major drivers. Cleanroom automation in the biologics sector jumped by 40% for the preservation of the integrity of the product.
Moreover, high throughput and efficient laboratory workflow create further demand, having spiked the adoption of cleanroom robots in sample handling and preparation by 30%. In healthcare institutions, investment is also being made in automation technologies there is a 25% increase in budget allocation towards robotic solutions that seek to cut down operational costs while improving patient outcomes. Other key factors include the integration of AI and machine learning into robotic systems, as about 20% of all healthcare providers use them to make cleanroom robots more functional and adaptive, thus pushing the market further. These metrics prove that cleanroom robots would play a critical role in changing healthcare operations through the impetus of need for precision, compliance, and efficiency.
Drivers:
The healthcare industries, especially pharmaceutical and medical device manufacturing, are closely monitored and involve processes that are accurate and aseptic.
The handling of contamination-free products is highly related to patient safety. Cleanroom robots minimize human intervention and the consequent risk of contamination, thereby ensuring the integrity of the product.
With an increasing labor cost and lack of skilled workers in specific geographies, healthcare facilities are looking to automate their services.
Increasing labor costs and a considerable shortage of skilled labor in certain regions are forcing healthcare facilities to move toward adopting cleanroom robots. Labor costs in the healthcare industry alone have increased by about 15-20% over the last five years, thereby adding additional strain to operational budgets. At the same time, due to a shortage of skilled technicians, countries like North America and Europe are facing a gap of about 25% in demand versus supply.
This gap has compelled health institutions to look for solutions in automation in order to keep up with the set standards of delivery. Cleanroom robots, which are designed to be applied in sterile environments, are fast being institutionalized as a strategic solution. Their implementation has increased by over 30% in facilities that face challenges in labor. Moreover, deployments of these robots have contributed to reducing human error by 40%, thus ensuring a much higher compliance with the stringent regulations that govern healthcare.
Restrains:
For the small healthcare facilities and budgets, one of the major barriers to entry is the upfront cost incurred in purchasing, implementing, and maintaining the robot.
Healthcare facilities have to operate under very strict regulations concerning cleanliness, sterilization, and patient safety. Ensuring that these standards are met with the use of cleanroom robots may be complex and time-consuming.
The deployment of cleanroom robots in health facilities is theatrically challenging because such facilities are exposed to very strict regulation in terms of cleanliness, sterilization, and, most of all, patient safety. Following this, the robots must be certified as meeting the highest standards applicable, a process that, however, takes a lot of time. In this context, the adoption of automation to satisfy sterilization requirements by some 65% of healthcare providers in the cleanroom robots in healthcare market has increased with the regulatory demand growing by 30% over the past decade. On the other hand, 70% of such facilities described that labor shortages sped up the pace of cleanroom robot adoption and 58% said that stiffening prices for labor were a very important factor in making the decision to plow capital into automation.
And all this time, with these challenges, 48% of hospitals now were able to implement cleanroom robots with the latest regulations, hence increased patient safety and operational inferences. In the light of shifting regulatory tides within the healthcare sector, this demand for those cleanroom robotics compliant with regulations is expected to increase, further bringing out the imperative on accuracy and compliance of standards within such critical environments.
By Type
The traditional industrial robots’ segment, driven by their precision and repeatability in handling delicate tasks, held a share of approximately 60% in the total market share of the Cleanroom Robots in Healthcare Market. These robots find major End-Use in highly accurate and contamination-controlled environments, typically part of pharmaceutical manufacturing and medical device assembly.
It is expected that the Collaborative Robots segment will register huge growth during the forecast period attributed to rising demand for flexible and safe automation solutions within healthcare settings. Working side by side with human operators, cobots have only recently gained momentum, with the number of units deployed across hospitals and laboratories estimated to have risen by 40% over the past three years. This has been largely due to the potential of robots to minimize human errors while increasing productivity looking forward, particularly with a view to maintaining stringent cleanroom standards.
By End-use
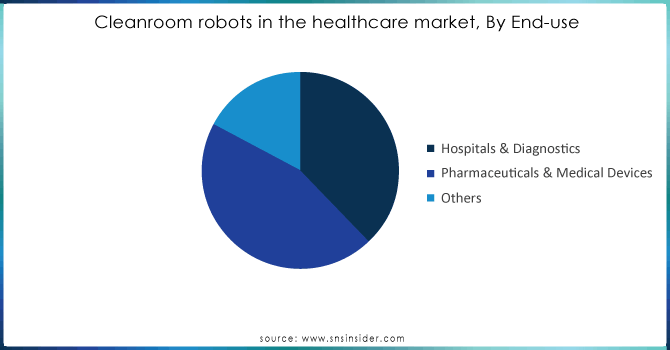
The Hospitals & Diagnostics segment is likely to capture a share of about 38% because rising automation helps get rid of the 'human factor' and its associated failures during diagnosis. This segment's growth is further supported by an increasing interest in superior, sophisticated robotics systems that can manage delicate samples and carry out functions with high accuracy in sterile conditions. The Pharmaceuticals & Medical Devices segment accounts for about 45% of the market and is seeing wide adoption due to strict regulatory requirements and demand for contamination-free manufacturing processes.
These robots play a crucial role in automating drug production, packaging, and the assembly of medical devices, thus minimizing the risk of contamination and increasing production efficiency. The Others segment consists of research laboratories and biotechnology companies that make up about 17% of the market. This segment is driven by the demand for reducing manual intervention in the research and development processes primarily in handling hazardous materials and experiments that involve a high degree of precision.
Need any customization research on Cleanroom Robots In The Healthcare Market- Enquiry Now
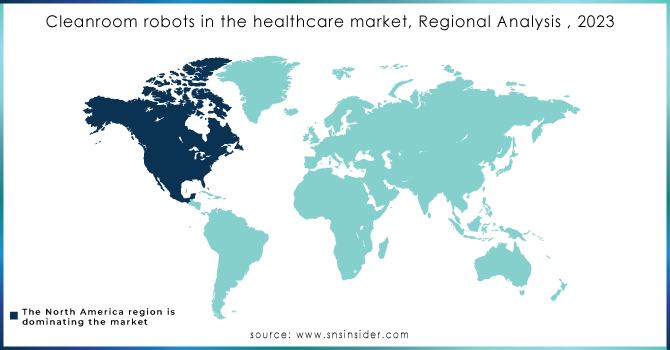
Regional Analysis:
In the North American regional analysis section, a set of several trends and quantitative insights of the cleanroom robots in healthcare market are studied by SNS Insider. The demand for cleanroom robots has increased at a higher rate for the past few years because labor costs have risen, and there is a diminishing number of people with enough expertise to handle such precise equipment. The adoption of cleanroom robots within healthcare facilities in the U.S. risen at a growth of around 18% y-o-y a solid effort in automation to make operations more efficient and accurate.
Recent government data shows the rate of technology adoption within the country's hospitals and diagnostics surged by 22% in the last five years on incentives and other support given for the installation of highly advanced and automated robotic solutions. Investments are also highly rising, by about 25% in the healthcare sector, particularly for flexible and seamlessly integrable technologies into the existing workflows, such as collaborative robots. Investments in traditional industrial robots have also risen by 20% in the pharmaceutical and medical devices sectors, underlining a more general trend toward automation.
The major key players are ABB, Denso Corp, FANUC Corp, Kawasaki Heavy Industries, Yaskawa Electric Corp, Aerotech, Nachi Fujikoshi Corp and others.
ABB: A new portfolio of clean designed control robot models to provide enhanced precision, speed, and load.
Omron: Extended the AMR lineup to include versions designed to meet the specific needs of cleanroom operations; can be provisioned with an optional UV-C disinfection system.
FANUC: Developed collaborative robots capable of carrying out cleanroom operations, including those related to assembly and packing, alongside human
| Report Attributes | Details |
|---|---|
| Market Size in 2023 | USD 527.10 Million |
| Market Size by 2032 | USD 4189.14 Million |
| CAGR | CAGR of 25.85% From 2024 to 2032 |
| Base Year | 2023 |
| Forecast Period | 2024-2032 |
| Historical Data | 2020-2022 |
| Report Scope & Coverage | Market Size, Segments Analysis, Competitive Landscape, Regional Analysis, DROC & SWOT Analysis, Forecast Outlook |
| Key Segments | • By Type (Traditional Industrial Robots, Collaborative Robots) • By Component (Robotic Arms, End Effectors, Drives, Controllers, Sensors, Power Supply, Motors, Others) • By End-use (Hospitals & Diagnostics, Pharmaceuticals & Medical Devices, Others) |
| Regional Analysis/Coverage | North America (US, Canada, Mexico), Europe (Eastern Europe [Poland, Romania, Hungary, Turkey, Rest of Eastern Europe] Western Europe] Germany, France, UK, Italy, Spain, Netherlands, Switzerland, Austria, Rest of Western Europe]), Asia Pacific (China, India, Japan, South Korea, Vietnam, Singapore, Australia, Rest of Asia Pacific), Middle East & Africa (Middle East [UAE, Egypt, Saudi Arabia, Qatar, Rest of Middle East], Africa [Nigeria, South Africa, Rest of Africa], Latin America (Brazil, Argentina, Colombia, Rest of Latin America) |
| Company Profiles | ABB, Denso Corp, FANUC Corp, Kawasaki Heavy Industries, Yaskawa Electric Corp, Aerotech, Nachi Fujikoshi Corp |
| Key Drivers | • With an increasing labor cost and lack of skilled workers in specific geographies, healthcare facilities are looking to automate their services. |
| RESTRAINTS | • Healthcare facilities have to operate under very strict regulations concerning cleanliness, sterilization, and patient safety. Ensuring that these standards are met with the use of cleanroom robots may be complex and time-consuming. |
Ans: The healthcare industries, especially pharmaceutical and medical device manufacturing, are closely monitored and involve processes that are accurate and aseptic.
Ans: For the small healthcare facilities and budgets, one of the major barriers to entry is the upfront cost incurred in purchasing, implementing, and maintaining the robot.
Ans: The market will grow at a CAGR of 25.85% over 2024-2032
Ans: North America will be dominating the market over the forecast period.
Ans: The Cleanroom robots in the healthcare market size is projected to reach USD 4189.14 million by 2032.
Table Of Contents:
1. Introduction
1.1 Market Definition
1.2 Scope (Inclusion and Exclusions)
1.3 Research Assumptions
2. Executive Summary
2.1 Market Overview
2.2 Regional Synopsis
2.3 Competitive Summary
3. Research Methodology
3.1 Top-Down Approach
3.2 Bottom-up Approach
3.3. Data Validation
3.4 Primary Interviews
4. Market Dynamics Impact Analysis
4.1 Market Driving Factors Analysis
4.1.1 Drivers
4.1.2 Restraints
4.1.3 Opportunities
4.1.4 Challenges
4.2 PESTLE Analysis
4.3 Porter’s Five Forces Model
5. Statistical Insights and Trends Reporting
5.1 Adoption Rates, 2023
5.2 User Demographics, By User Type and Roles, 2023
5.3 Feature Analysis, by Feature Type
5.4 Cost Analysis, by Software
5.5 Integration Capabilities
5.6 Regulatory Compliance, by Region
6. Competitive Landscape
6.1 List of Major Companies, By Region
6.2 Market Share Analysis, By Region
6.3 Product Benchmarking
6.3.1 Product specifications and features
6.3.2 Pricing
6.4 Strategic Initiatives
6.4.1 Marketing and promotional activities
6.4.2 Distribution and supply chain strategies
6.4.3 Expansion plans and new product launches
6.4.4 Strategic partnerships and collaborations
6.5 Technological Advancements
6.6 Market Positioning and Branding
7. Cleanroom Robots in the Healthcare Market Segmentation, by Type
7.1 Chapter Overview
7.2 Traditional Industrial Robots
7.2.1 Traditional Industrial Robots Market Trends Analysis (2020-2032)
7.2.2 Traditional Industrial Robots Market Size Estimates and Forecasts to 2032 (USD Million)
7.2.3 Collaborative Robots
7.2.3.1 Collaborative Robots Market Trends Analysis (2020-2032)
7.2.3.2 Collaborative Robots Market Size Estimates and Forecasts to 2032 (USD Million)
8. Cleanroom Robots in the Healthcare Market Segmentation, by Component
8.1 Chapter Overview
8.2 Robotic Arms
8.2.1 Robotic Arms Trends Analysis (2020-2032)
8.2.2 Robotic Arms Market Size Estimates and Forecasts to 2032 (USD Million)
8.3 End Effectors
8.3.1 End Effectors Market Trends Analysis (2020-2032)
8.3.2 End Effectors Market Size Estimates and Forecasts to 2032 (USD Million)
8.4 Drives
8.4.1 Drives Market Trends Analysis (2020-2032)
8.4.2 Drives Market Size Estimates and Forecasts to 2032 (USD Million)
8.5 Controllers
8.5.1 Controllers Market Trends Analysis (2020-2032)
8.5.2 Controllers Market Size Estimates and Forecasts to 2032 (USD Million)
8.6 Sensors
8.6.1 Sensors Market Trends Analysis (2020-2032)
8.6.2 Sensors Market Size Estimates and Forecasts to 2032 (USD Million)
8.7 Power Supply
8.7.1 Power Supply Market Trends Analysis (2020-2032)
8.7.2 Power Supply Market Size Estimates and Forecasts to 2032 (USD Million)
8.8 Motors
8.8.1 Sensors Market Trends Analysis (2020-2032)
8.8.2 Sensors Market Size Estimates and Forecasts to 2032 (USD Million)
9. Cleanroom Robots in the Healthcare Market Segmentation, by End-Use
9.1 Chapter Overview
9.2 Hospitals & Diagnostics
9.2.1 Hospitals & Diagnostics Market Trends Analysis (2020-2032)
9.2.2 Hospitals & Diagnostics Market Size Estimates and Forecasts to 2032 (USD Million)
9.3 Pharmaceuticals & Medical Devices
9.3.1 Pharmaceuticals & Medical Devices Market Trends Analysis (2020-2032)
9.3.2 Pharmaceuticals & Medical Devices Market Size Estimates and Forecasts to 2032 (USD Million)
9.4 Others
9.4.1 Others Market Trends Analysis (2020-2032)
9.4.2 Others Market Size Estimates and Forecasts to 2032 (USD Million)
10. Regional Analysis
10.1 Chapter Overview
10.2 North America
10.2.1 Trends Analysis
10.2.2 North America Cleanroom Robots in the Healthcare Market Estimates and Forecasts, by Country (2020-2032) (USD Million)
10.2.3 North America Cleanroom Robots in the Healthcare Market Estimates and Forecasts, by Type (2020-2032) (USD Million)
10.2.4 North America Cleanroom Robots in the Healthcare Market Estimates and Forecasts, by Component (2020-2032) (USD Million)
10.2.5 North America Cleanroom Robots in the Healthcare Market Estimates and Forecasts, by End-Use (2020-2032) (USD Million)
10.2.6 USA
10.2.6.1 USA Cleanroom Robots in the Healthcare Market Estimates and Forecasts, by Type (2020-2032) (USD Million)
10.2.6.2 USA Cleanroom Robots in the Healthcare Market Estimates and Forecasts, by Component (2020-2032) (USD Million)
10.2.6.3 USA Cleanroom Robots in the Healthcare Market Estimates and Forecasts, by End-Use (2020-2032) (USD Million)
10.2.7 Canada
10.2.7.1 Canada Cleanroom Robots in the Healthcare Market Estimates and Forecasts, by Type (2020-2032) (USD Million)
10.2.7.2 Canada Cleanroom Robots in the Healthcare Market Estimates and Forecasts, by Component (2020-2032) (USD Million)
10.2.7.3 Canada Cleanroom Robots in the Healthcare Market Estimates and Forecasts, by End-Use (2020-2032) (USD Million)
10.2.8 Mexico
10.2.8.1 Mexico Cleanroom Robots in the Healthcare Market Estimates and Forecasts, by Type (2020-2032) (USD Million)
10.2.8.2 Mexico Cleanroom Robots in the Healthcare Market Estimates and Forecasts, by Component (2020-2032) (USD Million)
10.2.8.3 Mexico Cleanroom Robots in the Healthcare Market Estimates and Forecasts, by End-Use (2020-2032) (USD Million)
10.3 Europe
10.3.1 Eastern Europe
10.3.1.1 Trends Analysis
10.3.1.2 Eastern Europe Cleanroom Robots in the Healthcare Market Estimates and Forecasts, by Country (2020-2032) (USD Million)
10.3.1.3 Eastern Europe Cleanroom Robots in the Healthcare Market Estimates and Forecasts, by Type (2020-2032) (USD Million)
10.3.1.4 Eastern Europe Cleanroom Robots in the Healthcare Market Estimates and Forecasts, by Component (2020-2032) (USD Million)
10.3.1.5 Eastern Europe Cleanroom Robots in the Healthcare Market Estimates and Forecasts, by End-Use (2020-2032) (USD Million)
10.3.1.6 Poland
10.3.1.6.1 Poland Cleanroom Robots in the Healthcare Market Estimates and Forecasts, by Type (2020-2032) (USD Million)
10.3.1.6.2 Poland Cleanroom Robots in the Healthcare Market Estimates and Forecasts, by Component (2020-2032) (USD Million)
10.3.1.6.3 Poland Cleanroom Robots in the Healthcare Market Estimates and Forecasts, by End-Use (2020-2032) (USD Million)
10.3.1.7 Romania
10.3.1.7.1 Romania Cleanroom Robots in the Healthcare Market Estimates and Forecasts, by Type (2020-2032) (USD Million)
10.3.1.7.2 Romania Cleanroom Robots in the Healthcare Market Estimates and Forecasts, by Component (2020-2032) (USD Million)
10.3.1.7.3 Romania Cleanroom Robots in the Healthcare Market Estimates and Forecasts, by End-Use (2020-2032) (USD Million)
10.3.1.8 Hungary
10.3.1.8.1 Hungary Cleanroom Robots in the Healthcare Market Estimates and Forecasts, by Type (2020-2032) (USD Million)
10.3.1.8.2 Hungary Cleanroom Robots in the Healthcare Market Estimates and Forecasts, by Component (2020-2032) (USD Million)
10.3.1.8.3 Hungary Cleanroom Robots in the Healthcare Market Estimates and Forecasts, by End-Use (2020-2032) (USD Million)
10.3.1.9 Turkey
10.3.1.9.1 Turkey Cleanroom Robots in the Healthcare Market Estimates and Forecasts, by Type (2020-2032) (USD Million)
10.3.1.9.2 Turkey Cleanroom Robots in the Healthcare Market Estimates and Forecasts, by Component (2020-2032) (USD Million)
10.3.1.9.3 Turkey Cleanroom Robots in the Healthcare Market Estimates and Forecasts, by End-Use (2020-2032) (USD Million)
10.3.1.10 Rest of Eastern Europe
10.3.1.10.1 Rest of Eastern Europe Cleanroom Robots in the Healthcare Market Estimates and Forecasts, by Type (2020-2032) (USD Million)
10.3.1.10.2 Rest of Eastern Europe Cleanroom Robots in the Healthcare Market Estimates and Forecasts, by Component (2020-2032) (USD Million)
10.3.1.10.3 Rest of Eastern Europe Cleanroom Robots in the Healthcare Market Estimates and Forecasts, by End-Use (2020-2032) (USD Million)
10.3.2 Western Europe
10.3.2.1 Trends Analysis
10.3.2.2 Western Europe Cleanroom Robots in the Healthcare Market Estimates and Forecasts, by Country (2020-2032) (USD Million)
10.3.2.3 Western Europe Cleanroom Robots in the Healthcare Market Estimates and Forecasts, by Type (2020-2032) (USD Million)
10.3.2.4 Western Europe Cleanroom Robots in the Healthcare Market Estimates and Forecasts, by Component (2020-2032) (USD Million)
10.3.2.5 Western Europe Cleanroom Robots in the Healthcare Market Estimates and Forecasts, by End-Use (2020-2032) (USD Million)
10.3.2.6 Germany
10.3.2.6.1 Germany Cleanroom Robots in the Healthcare Market Estimates and Forecasts, by Type (2020-2032) (USD Million)
10.3.2.6.2 Germany Cleanroom Robots in the Healthcare Market Estimates and Forecasts, by Component (2020-2032) (USD Million)
10.3.2.6.3 Germany Cleanroom Robots in the Healthcare Market Estimates and Forecasts, by End-Use (2020-2032) (USD Million)
10.3.2.7 France
10.3.2.7.1 France Cleanroom Robots in the Healthcare Market Estimates and Forecasts, by Type (2020-2032) (USD Million)
10.3.2.7.2 France Cleanroom Robots in the Healthcare Market Estimates and Forecasts, by Component (2020-2032) (USD Million)
10.3.2.7.3 France Cleanroom Robots in the Healthcare Market Estimates and Forecasts, by End-Use (2020-2032) (USD Million)
10.3.2.8 UK
10.3.2.8.1 UK Cleanroom Robots in the Healthcare Market Estimates and Forecasts, by Type (2020-2032) (USD Million)
10.3.2.8.2 UK Cleanroom Robots in the Healthcare Market Estimates and Forecasts, by Component (2020-2032) (USD Million)
10.3.2.8.3 UK Cleanroom Robots in the Healthcare Market Estimates and Forecasts, by End-Use (2020-2032) (USD Million)
10.3.2.9 Italy
10.3.2.9.1 Italy Cleanroom Robots in the Healthcare Market Estimates and Forecasts, by Type (2020-2032) (USD Million)
10.3.2.9.2 Italy Cleanroom Robots in the Healthcare Market Estimates and Forecasts, by Component (2020-2032) (USD Million)
10.3.2.9.3 Italy Cleanroom Robots in the Healthcare Market Estimates and Forecasts, by End-Use (2020-2032) (USD Million)
10.3.2.10 Spain
10.3.2.10.1 Spain Cleanroom Robots in the Healthcare Market Estimates and Forecasts, by Type (2020-2032) (USD Million)
10.3.2.10.2 Spain Cleanroom Robots in the Healthcare Market Estimates and Forecasts, by Component (2020-2032) (USD Million)
10.3.2.10.3 Spain Cleanroom Robots in the Healthcare Market Estimates and Forecasts, by End-Use (2020-2032) (USD Million)
10.3.2.11 Netherlands
10.3.2.11.1 Netherlands Cleanroom Robots in the Healthcare Market Estimates and Forecasts, by Type (2020-2032) (USD Million)
10.3.2.11.2 Netherlands Cleanroom Robots in the Healthcare Market Estimates and Forecasts, by Component (2020-2032) (USD Million)
10.3.2.11.3 Netherlands Cleanroom Robots in the Healthcare Market Estimates and Forecasts, by End-Use (2020-2032) (USD Million)
10.3.2.12 Switzerland
10.3.2.12.1 Switzerland Cleanroom Robots in the Healthcare Market Estimates and Forecasts, by Type (2020-2032) (USD Million)
10.3.2.12.2 Switzerland Cleanroom Robots in the Healthcare Market Estimates and Forecasts, by Component (2020-2032) (USD Million)
10.3.2.12.3 Switzerland Cleanroom Robots in the Healthcare Market Estimates and Forecasts, by End-Use (2020-2032) (USD Million)
10.3.2.13 Austria
10.3.2.13.1 Austria Cleanroom Robots in the Healthcare Market Estimates and Forecasts, by Type (2020-2032) (USD Million)
10.3.2.13.2 Austria Cleanroom Robots in the Healthcare Market Estimates and Forecasts, by Component (2020-2032) (USD Million)
10.3.2.13.3 Austria Cleanroom Robots in the Healthcare Market Estimates and Forecasts, by End-Use (2020-2032) (USD Million)
10.3.2.14 Rest of Western Europe
10.3.2.14.1 Rest of Western Europe Cleanroom Robots in the Healthcare Market Estimates and Forecasts, by Type (2020-2032) (USD Million)
10.3.2.14.2 Rest of Western Europe Cleanroom Robots in the Healthcare Market Estimates and Forecasts, by Component (2020-2032) (USD Million)
10.3.2.14.3 Rest of Western Europe Cleanroom Robots in the Healthcare Market Estimates and Forecasts, by End-Use (2020-2032) (USD Million)
10.4 Asia Pacific
10.4.1 Trends Analysis
10.4.2 Asia Pacific Cleanroom Robots in the Healthcare Market Estimates and Forecasts, by Country (2020-2032) (USD Million)
10.4.3 Asia Pacific Cleanroom Robots in the Healthcare Market Estimates and Forecasts, by Type (2020-2032) (USD Million)
10.4.4 Asia Pacific Cleanroom Robots in the Healthcare Market Estimates and Forecasts, by Component (2020-2032) (USD Million)
10.4.5 Asia Pacific Cleanroom Robots in the Healthcare Market Estimates and Forecasts, by End-Use (2020-2032) (USD Million)
10.4.6 China
10.4.6.1 China Cleanroom Robots in the Healthcare Market Estimates and Forecasts, by Type (2020-2032) (USD Million)
10.4.6.2 China Cleanroom Robots in the Healthcare Market Estimates and Forecasts, by Component (2020-2032) (USD Million)
10.4.6.3 China Cleanroom Robots in the Healthcare Market Estimates and Forecasts, by End-Use (2020-2032) (USD Million)
10.4.7 India
10.4.7.1 India Cleanroom Robots in the Healthcare Market Estimates and Forecasts, by Type (2020-2032) (USD Million)
10.4.7.2 India Cleanroom Robots in the Healthcare Market Estimates and Forecasts, by Component (2020-2032) (USD Million)
10.4.7.3 India Cleanroom Robots in the Healthcare Market Estimates and Forecasts, by End-Use (2020-2032) (USD Million)
10.4.8 Japan
10.4.8.1 Japan Cleanroom Robots in the Healthcare Market Estimates and Forecasts, by Type (2020-2032) (USD Million)
10.4.8.2 Japan Cleanroom Robots in the Healthcare Market Estimates and Forecasts, by Component (2020-2032) (USD Million)
10.4.8.3 Japan Cleanroom Robots in the Healthcare Market Estimates and Forecasts, by End-Use (2020-2032) (USD Million)
10.4.9 South Korea
10.4.9.1 South Korea Cleanroom Robots in the Healthcare Market Estimates and Forecasts, by Type (2020-2032) (USD Million)
10.4.9.2 South Korea Cleanroom Robots in the Healthcare Market Estimates and Forecasts, by Component (2020-2032) (USD Million)
10.4.9.3 South Korea Cleanroom Robots in the Healthcare Market Estimates and Forecasts, by End-Use (2020-2032) (USD Million)
10.4.10 Vietnam
10.4.10.1 Vietnam Cleanroom Robots in the Healthcare Market Estimates and Forecasts, by Type (2020-2032) (USD Million)
10.4.10.2 Vietnam Cleanroom Robots in the Healthcare Market Estimates and Forecasts, by Component (2020-2032) (USD Million)
10.4.10.3 Vietnam Cleanroom Robots in the Healthcare Market Estimates and Forecasts, by End-Use (2020-2032) (USD Million)
10.4.11 Singapore
10.4.11.1 Singapore Cleanroom Robots in the Healthcare Market Estimates and Forecasts, by Type (2020-2032) (USD Million)
10.4.11.2 Singapore Cleanroom Robots in the Healthcare Market Estimates and Forecasts, by Component (2020-2032) (USD Million)
10.4.11.3 Singapore Cleanroom Robots in the Healthcare Market Estimates and Forecasts, by End-Use (2020-2032) (USD Million)
10.4.12 Australia
10.4.12.1 Australia Cleanroom Robots in the Healthcare Market Estimates and Forecasts, by Type (2020-2032) (USD Million)
10.4.12.2 Australia Cleanroom Robots in the Healthcare Market Estimates and Forecasts, by Component (2020-2032) (USD Million)
10.4.12.3 Australia Cleanroom Robots in the Healthcare Market Estimates and Forecasts, by End-Use (2020-2032) (USD Million)
10.4.13 Rest of Asia Pacific
10.4.13.1 Rest of Asia Pacific Cleanroom Robots in the Healthcare Market Estimates and Forecasts, by Type (2020-2032) (USD Million)
10.4.13.2 Rest of Asia Pacific Cleanroom Robots in the Healthcare Market Estimates and Forecasts, by Component (2020-2032) (USD Million)
10.4.13.3 Rest of Asia Pacific Cleanroom Robots in the Healthcare Market Estimates and Forecasts, by End-Use (2020-2032) (USD Million)
10.5 Middle East and Africa
10.5.1 Middle East
10.5.1.1 Trends Analysis
10.5.1.2 Middle East Cleanroom Robots in the Healthcare Market Estimates and Forecasts, by Country (2020-2032) (USD Million)
10.5.1.3 Middle East Cleanroom Robots in the Healthcare Market Estimates and Forecasts, by Type (2020-2032) (USD Million)
10.5.1.4 Middle East Cleanroom Robots in the Healthcare Market Estimates and Forecasts, by Component (2020-2032) (USD Million)
10.5.1.5 Middle East Cleanroom Robots in the Healthcare Market Estimates and Forecasts, by End-Use (2020-2032) (USD Million)
10.5.1.6 UAE
10.5.1.6.1 UAE Cleanroom Robots in the Healthcare Market Estimates and Forecasts, by Type (2020-2032) (USD Million)
10.5.1.6.2 UAE Cleanroom Robots in the Healthcare Market Estimates and Forecasts, by Component (2020-2032) (USD Million)
10.5.1.6.3 UAE Cleanroom Robots in the Healthcare Market Estimates and Forecasts, by End-Use (2020-2032) (USD Million)
10.5.1.7 Egypt
10.5.1.7.1 Egypt Cleanroom Robots in the Healthcare Market Estimates and Forecasts, by Type (2020-2032) (USD Million)
10.5.1.7.2 Egypt Cleanroom Robots in the Healthcare Market Estimates and Forecasts, by Component (2020-2032) (USD Million)
10.5.1.7.3 Egypt Cleanroom Robots in the Healthcare Market Estimates and Forecasts, by End-Use (2020-2032) (USD Million)
10.5.1.8 Saudi Arabia
10.5.1.8.1 Saudi Arabia Cleanroom Robots in the Healthcare Market Estimates and Forecasts, by Type (2020-2032) (USD Million)
10.5.1.8.2 Saudi Arabia Cleanroom Robots in the Healthcare Market Estimates and Forecasts, by Component (2020-2032) (USD Million)
10.5.1.8.3 Saudi Arabia Cleanroom Robots in the Healthcare Market Estimates and Forecasts, by End-Use (2020-2032) (USD Million)
10.5.1.9 Qatar
10.5.1.9.1 Qatar Cleanroom Robots in the Healthcare Market Estimates and Forecasts, by Type (2020-2032) (USD Million)
10.5.1.9.2 Qatar Cleanroom Robots in the Healthcare Market Estimates and Forecasts, by Component (2020-2032) (USD Million)
10.5.1.9.3 Qatar Cleanroom Robots in the Healthcare Market Estimates and Forecasts, by End-Use (2020-2032) (USD Million)
10.5.1.10 Rest of Middle East
10.5.1.10.1 Rest of Middle East Cleanroom Robots in the Healthcare Market Estimates and Forecasts, by Type (2020-2032) (USD Million)
10.5.1.10.2 Rest of Middle East Cleanroom Robots in the Healthcare Market Estimates and Forecasts, by Component (2020-2032) (USD Million)
10.5.1.10.3 Rest of Middle East Cleanroom Robots in the Healthcare Market Estimates and Forecasts, by End-Use (2020-2032) (USD Million)
10.5.2 Africa
10.5.2.1 Trends Analysis
10.5.2.2 Africa Cleanroom Robots in the Healthcare Market Estimates and Forecasts, by Country (2020-2032) (USD Million)
10.5.2.3 Africa Cleanroom Robots in the Healthcare Market Estimates and Forecasts, by Type (2020-2032) (USD Million)
10.5.2.4 Africa Cleanroom Robots in the Healthcare Market Estimates and Forecasts, by Component (2020-2032) (USD Million)
10.5.2.5 Africa Cleanroom Robots in the Healthcare Market Estimates and Forecasts, by End-Use (2020-2032) (USD Million)
10.5.2.6 South Africa
10.5.2.6.1 South Africa Cleanroom Robots in the Healthcare Market Estimates and Forecasts, by Type (2020-2032) (USD Million)
10.5.2.6.2 South Africa Cleanroom Robots in the Healthcare Market Estimates and Forecasts, by Component (2020-2032) (USD Million)
10.5.2.6.3 South Africa Cleanroom Robots in the Healthcare Market Estimates and Forecasts, by End-Use (2020-2032) (USD Million)
10.5.2.7 Nigeria
10.5.2.7.1 Nigeria Cleanroom Robots in the Healthcare Market Estimates and Forecasts, by Type (2020-2032) (USD Million)
10.5.2.7.2 Nigeria Cleanroom Robots in the Healthcare Market Estimates and Forecasts, by Component (2020-2032) (USD Million)
10.5.2.7.3 Nigeria Cleanroom Robots in the Healthcare Market Estimates and Forecasts, by End-Use (2020-2032) (USD Million)
10.5.2.8 Rest of Africa
10.5.2.8.1 Rest of Africa Cleanroom Robots in the Healthcare Market Estimates and Forecasts, by Type (2020-2032) (USD Million)
10.5.2.8.2 Rest of Africa Cleanroom Robots in the Healthcare Market Estimates and Forecasts, by Component (2020-2032) (USD Million)
10.5.2.8.3 Rest of Africa Cleanroom Robots in the Healthcare Market Estimates and Forecasts, by End-Use (2020-2032) (USD Million)
10.6 Latin America
10.6.1 Trends Analysis
10.6.2 Latin America Cleanroom Robots in the Healthcare Market Estimates and Forecasts, by Country (2020-2032) (USD Million)
10.6.3 Latin America Cleanroom Robots in the Healthcare Market Estimates and Forecasts, by Type (2020-2032) (USD Million)
10.6.4 Latin America Cleanroom Robots in the Healthcare Market Estimates and Forecasts, by Component (2020-2032) (USD Million)
10.6.5 Latin America Cleanroom Robots in the Healthcare Market Estimates and Forecasts, by End-Use (2020-2032) (USD Million)
10.6.6 Brazil
10.6.6.1 Brazil Cleanroom Robots in the Healthcare Market Estimates and Forecasts, by Type (2020-2032) (USD Million)
10.6.6.2 Brazil Cleanroom Robots in the Healthcare Market Estimates and Forecasts, by Component (2020-2032) (USD Million)
10.6.6.3 Brazil Cleanroom Robots in the Healthcare Market Estimates and Forecasts, by End-Use (2020-2032) (USD Million)
10.6.7 Argentina
10.6.7.1 Argentina Cleanroom Robots in the Healthcare Market Estimates and Forecasts, by Type (2020-2032) (USD Million)
10.6.7.2 Argentina Cleanroom Robots in the Healthcare Market Estimates and Forecasts, by Component (2020-2032) (USD Million)
10.6.7.3 Argentina Cleanroom Robots in the Healthcare Market Estimates and Forecasts, by End-Use (2020-2032) (USD Million)
10.6.8 Colombia
10.6.8.1 Colombia Cleanroom Robots in the Healthcare Market Estimates and Forecasts, by Type (2020-2032) (USD Million)
10.6.8.2 Colombia Cleanroom Robots in the Healthcare Market Estimates and Forecasts, by Component (2020-2032) (USD Million)
10.6.8.3 Colombia Cleanroom Robots in the Healthcare Market Estimates and Forecasts, by End-Use (2020-2032) (USD Million)
10.6.9 Rest of Latin America
10.6.9.1 Rest of Latin America Cleanroom Robots in the Healthcare Market Estimates and Forecasts, by Type (2020-2032) (USD Million)
10.6.9.2 Rest of Latin America Cleanroom Robots in the Healthcare Market Estimates and Forecasts, by Component (2020-2032) (USD Million)
10.6.9.3 Rest of Latin America Cleanroom Robots in the Healthcare Market Estimates and Forecasts, by End-Use (2020-2032) (USD Million)
11. Company Profiles
11.1 ABB
11.1.1 Company Overview
11.1.2 Financial
11.1.3 Products/ Services Offered
11.1.4 The SNS View
11.2 Denso Corp
11.2.1 Company Overview
11.2.2 Financial
11.2.3 Products / Services Offered
11.2.4 The SNS View
11.3 FANUC Corp
11.3.1 Company Overview
11.3.2 Financial
11.3.3 Products / Services Offered
11.3.4 The SNS View
11.4 Kawasaki Heavy Industries
11.4.1 Company Overview
11.4.2 Financial
11.4.3 Products / Services Offered
11.4.4 The SNS View
11.5 Yaskawa Electric Corp
11.5.1 Company Overview
11.5.2 Financial
11.5.3 Products / Services Offered
11.5.4 The SNS View
11.6 Aerotech
11.6.1 Company Overview
11.6.2 Financial
11.6.3 Products / Services Offered
11.6.4 The SNS View
11.7 Nachi Fujikoshi Corp
11.7.1 Company Overview
11.7.2 Financial
11.7.3 Products / Services Offered
11.7.4 The SNS View
11.8 Others
11.8.1 Company Overview
11.8.2 Financial
11.8.3 Products / Services Offered
11.8.4 The SNS View
12. Competitive Landscape
12.1 Competitive Benchmarking
12.2 Market Share Analysis
12.3 Recent Developments
12.3.1 Industry News
12.3.2 Company News
12.3.3 Mergers & Acquisitions
13. Use Case and Best Practices
14. Conclusion
An accurate research report requires proper strategizing as well as implementation. There are multiple factors involved in the completion of good and accurate research report and selecting the best methodology to compete the research is the toughest part. Since the research reports we provide play a crucial role in any company’s decision-making process, therefore we at SNS Insider always believe that we should choose the best method which gives us results closer to reality. This allows us to reach at a stage wherein we can provide our clients best and accurate investment to output ratio.
Each report that we prepare takes a timeframe of 350-400 business hours for production. Starting from the selection of titles through a couple of in-depth brain storming session to the final QC process before uploading our titles on our website we dedicate around 350 working hours. The titles are selected based on their current market cap and the foreseen CAGR and growth.
The 5 steps process:
Step 1: Secondary Research:
Secondary Research or Desk Research is as the name suggests is a research process wherein, we collect data through the readily available information. In this process we use various paid and unpaid databases which our team has access to and gather data through the same. This includes examining of listed companies’ annual reports, Journals, SEC filling etc. Apart from this our team has access to various associations across the globe across different industries. Lastly, we have exchange relationships with various university as well as individual libraries.

Step 2: Primary Research
When we talk about primary research, it is a type of study in which the researchers collect relevant data samples directly, rather than relying on previously collected data. This type of research is focused on gaining content specific facts that can be sued to solve specific problems. Since the collected data is fresh and first hand therefore it makes the study more accurate and genuine.
We at SNS Insider have divided Primary Research into 2 parts.
Part 1 wherein we interview the KOLs of major players as well as the upcoming ones across various geographic regions. This allows us to have their view over the market scenario and acts as an important tool to come closer to the accurate market numbers. As many as 45 paid and unpaid primary interviews are taken from both the demand and supply side of the industry to make sure we land at an accurate judgement and analysis of the market.
This step involves the triangulation of data wherein our team analyses the interview transcripts, online survey responses and observation of on filed participants. The below mentioned chart should give a better understanding of the part 1 of the primary interview.

Part 2: In this part of primary research the data collected via secondary research and the part 1 of the primary research is validated with the interviews from individual consultants and subject matter experts.
Consultants are those set of people who have at least 12 years of experience and expertise within the industry whereas Subject Matter Experts are those with at least 15 years of experience behind their back within the same space. The data with the help of two main processes i.e., FGDs (Focused Group Discussions) and IDs (Individual Discussions). This gives us a 3rd party nonbiased primary view of the market scenario making it a more dependable one while collation of the data pointers.
Step 3: Data Bank Validation
Once all the information is collected via primary and secondary sources, we run that information for data validation. At our intelligence centre our research heads track a lot of information related to the market which includes the quarterly reports, the daily stock prices, and other relevant information. Our data bank server gets updated every fortnight and that is how the information which we collected using our primary and secondary information is revalidated in real time.

Step 4: QA/QC Process
After all the data collection and validation our team does a final level of quality check and quality assurance to get rid of any unwanted or undesired mistakes. This might include but not limited to getting rid of the any typos, duplication of numbers or missing of any important information. The people involved in this process include technical content writers, research heads and graphics people. Once this process is completed the title gets uploader on our platform for our clients to read it.
Step 5: Final QC/QA Process:
This is the last process and comes when the client has ordered the study. In this process a final QA/QC is done before the study is emailed to the client. Since we believe in giving our clients a good experience of our research studies, therefore, to make sure that we do not lack at our end in any way humanly possible we do a final round of quality check and then dispatch the study to the client.
By Type
Traditional Industrial Robots
Articulated Robots
SCARA Robots
Parallel Robots
Cartesian Robots
Collaborative Robots
By Component
Robotic Arms
End Effectors
Drives
Controllers
Sensors
Power Supply
Motors
Others
By End-use
Hospitals & Diagnostics
Pharmaceuticals & Medical Devices
Others
Request for Segment Customization as per your Business Requirement: Segment Customization Request
REGIONAL COVERAGE:
North America
US
Canada
Mexico
Europe
Eastern Europe
Poland
Romania
Hungary
Turkey
Rest of Eastern Europe
Western Europe
Germany
France
UK
Italy
Spain
Netherlands
Switzerland
Austria
Rest of Western Europe
Asia Pacific
China
India
Japan
South Korea
Vietnam
Singapore
Australia
Rest of Asia Pacific
Middle East & Africa
Middle East
UAE
Egypt
Saudi Arabia
Qatar
Rest of the Middle East
Africa
Nigeria
South Africa
Rest of Africa
Latin America
Brazil
Argentina
Colombia
Request for Country Level Research Report: Country Level Customization Request
Available Customization
With the given market data, SNS Insider offers customization as per the company’s specific needs. The following customization options are available for the report:
Product Analysis
Criss-Cross segment analysis (e.g. Product X Application)
Product Matrix which gives a detailed comparison of product portfolio of each company
Geographic Analysis
Additional countries in any of the regions
Company Information
Detailed analysis and profiling of additional market players (Up to five)
Overactive Bladder Treatment Market was valued at USD 3.63 billion in 2023 and is expected to reach USD 5.45 billion by 2032, growing at a CAGR of 4.64% over the forecast period 2024-2032.
The Respiratory Syncytial Virus Diagnostics Market size was estimated at USD 6.01 Billion in 2023 and is expected to reach USD 9.99 Billion by 2032.
Molecular Imaging Market Size was valued at USD 8.47 billion in 2023 and is expected to reach USD 12.5 billion by 2032, growing at 4.5% CAGR from 2024-2032.
Quantum Sensing in the Medical Imaging Market valued at USD 290.82 million in 2023, projected to reach USD 574.6 million by 2032 with a 7.49% CAGR from 2024 to 2032.
The Medical Holography Market was USD 1.57 billion in 2023 and is expected to reach USD 11.35 billion by 2032, growing at a CAGR of 23.81% by 2024-2032.
The Prostate Health Market Size was valued at USD 37.73 billion in 2023, and is expected to reach USD 82.62 billion by 2032 and grow at a CAGR of 9.1% over the forecast period 2024-2032.

Hi! Click one of our member below to chat on Phone
© 2025 All Rights Reserved by SNS Insider Pvt Ltd


