Class D Audio Amplifier Market Report Scope & Overview:
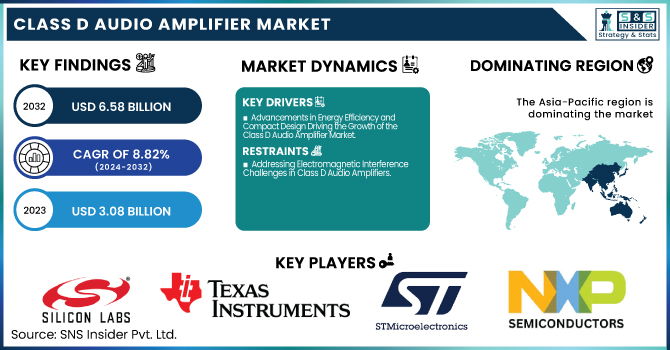
The Class D Audio Amplifier Market was valued at USD 3.08 Billion in 2023 and is projected to reach USD 6.58 Billion by 2032, growing at a CAGR of 8.82% from 2024 to 2032.
To Get More Information About Class D Audio Amplifier Market - Request Free Sample Report
This growth is primarily driven by the rising demand for energy-efficient, compact, and high-performance audio systems across consumer electronics, automotive infotainment, and smart home applications. Technological advancements such as improved adoption rates, enhanced signal-to-noise ratio (SNR), and reduced latency are significantly enhancing audio quality and device responsiveness. In the United States, the market stood at USD 0.39 billion in 2023 and is expected to grow to USD 0.83 billion by 2032 at a CAGR of 8.72%.The increasing integration of Class D amplifiers into smart devices, including smart speakers, wireless earbuds, and connected TVs, is also accelerating market expansion. Battery drain efficiency has become a crucial factor, especially in portable and wearable devices, where these amplifiers provide extended usage with minimal power consumption. Furthermore, the reduction in design-in cycle time is encouraging faster product development and quicker time-to-market for OEMs, particularly in the competitive U.S. landscape.
Class D Audio Amplifier Market Dynamics:
Drivers:
The growing demand for energy-efficient audio solutions, especially in compact and battery-powered devices, is a key driver of the Class D Audio Amplifier Market. Known for their superior power efficiency, often exceeding 90%, Class D amplifiers significantly reduce energy consumption and heat generation compared to traditional linear amplifiers. This makes them ideal for portable electronics like smartphones, earbuds, and smart speakers. Recent innovations, such as optimizing MOS full-bridge circuits and incorporating Gallium Nitride (GaN) and Silicon Carbide (SiC) devices, have pushed efficiency beyond 80%, reaching up to 91.8%. Additionally, the use of a full-bridge output structure has improved power output and frequency response. With a focus on reducing power loss and enhancing performance, these advancements are making Class D amplifiers the standard in modern audio engineering, offering both higher efficiency and compact designs.
Restraints
Electromagnetic Interference (EMI) a significant challenge for Class D amplifiers due to their high switching frequencies, which can generate unwanted electromagnetic radiation. This interference can affect the operation of nearby circuitry, causing signal distortion, compromising audio clarity, or even causing system malfunctions. To prevent EMI from affecting stable functioning, manufacturers need to deploy extra mechanisms such as advanced filtering techniques and electromagnetic shielding. These solutions also add complexity to the amplifier’s design, raising the cost of manufacture. This is especially challenging when it comes to mobile or compact devices with little surface area for effective EMI protection. EMI may require adding extra components, leading to larger and heavier devices. Thus, with high efficiency comes the challenge of EMI management, making EMI control a significant factor in the adoption of Class D amplifiers across a range of applications, and especially in sensitive and high-performance audio applications.
Opportunities:
The automotive industry is increasingly adopting Class D amplifiers for infotainment and in- car audio systems, driven by their high efficiency and compact design. As vehicles become more technology-driven, the demand for advanced audio systems that deliver superior sound quality while optimizing power consumption has grown. Class D amplifiers are perfect for that purpose: While highly efficient, even at high volumes, we can get loud, powerful audio without burning away a lot of room. These amplifiers take advantage of modern space-efficient automotive interiors, promoting system integration in an ever-diminishing package. Second, Class D amplifiers produce low amounts of heat, which is vital in confined spaces that may also have temperature changes like a car. With increasing consumer demands for in-car infotainment systems, Class D amplifiers are becoming ever more widespread amongst automotive audio applications.
Challenges:
Class D amplifier technology has come a long way since its early introduction, filling a niche for the many of consumers who feel it offers less sound quality than conventional Class A or AB amplifier designs. This view, which is particularly common among audiophiles and sound engineers, derives from the established reputation of amplifiers of the Class A and AB type for greater audio fidelity, warmth, and clarity. While Class D amplifiers excel in efficiency and compact design, their digital nature can sometimes lead to concerns about distortion and a lack of smoothness in the audio output. As a result, their adoption is limited in high-end audio markets where sound quality is critical. For Class D amplifiers to gain wider acceptance, manufacturers must focus on enhancing sound clarity, reducing distortion, and educating consumers about the capabilities of modern Class D technology in achieving high-quality audio performance.
Class D Audio Amplifier Market Segment Analysis:
By Amplifier Type
The 2-channel segment of the Class D audio amplifier market dominates with a significant market share of 38% in 2023. The prominence of this segment is due to its major usage in numerous consumer electronics such as home audio systems, portable speakers, and automotive infotainment systems, where balanced audio output is of critical importance. Their 2-channel amplifiers are a cost-effective way to meet high-power, small, and high-quality sound challenges, making them very attractive for mass-market products. With the increasing demand for audio systems (especially due to the emergence of smart speakers and wireless audio system) in consumer electronics, the 2-channel Class D amplifiers will continue to hold the top position in the market. In addition, a surge in energy-efficient designs and space-saving features is reinforcing the growth of the 2-channel segment.
The 4-channel segment of the Class D audio amplifier market is projected to experience the fastest growth during the forecast period from 2024 to 2032. This rapid expansion is primarily driven by the increasing demand for multi-channel audio systems that deliver immersive sound experiences in various applications, including home theaters, automotive infotainment systems, and professional audio equipment. The ability of 4-channel amplifiers to efficiently power multiple speakers without significant heat generation makes them particularly attractive for modern audio setups. As consumers seek more sophisticated and high-fidelity audio solutions, manufacturers are focusing on enhancing the performance and affordability of 4-channel Class D amplifiers, further fueling their adoption and contributing to the segment's robust growth.
By Devices
The Home Audio Systems segment leads the Class D audio amplifier market, holding the largest revenue share of 31% in 2023, and is projected to be the fastest-growing segment from 2024 to 2032. his expansion, driven by approaching consumers demands for quality loudspeaker options, and home environments where energy-efficient, compact designs are essential for loud-sound and crystal clear loudspeaker systems. They work well for home audio because they produce very little heat and are very energy efficient, making class D amplifiers very strong in high peak performance. As technology progresses for home entertainment, the demand for high-end audio equipment, like smart speakers, soundbars, and home cinema systems, is growing. Advances in audio technology, the proliferation of smart home technology, and the rising demand for energy-efficient consumer electronics complement these factors.
By End Use
The Consumer Electronics segment dominates the Class D audio amplifier market with the largest revenue share of 59% in 2023. This leadership is driven by the increasing demand for energy-efficient, high-performance audio solutions in various consumer electronics, including smartphones, tablets, smart speakers, and other portable devices. Class D amplifiers are favored for their compact design, power efficiency, and ability to deliver high-quality audio without excessive heat generation. As consumer electronics continue to evolve, the integration of advanced audio technologies in these devices is expected to fuel further growth in this segment.
The Automotive segment is the fastest-growing in the Class D audio amplifier market over the forecast period from 2024 to 2032. The demand can be attributed to the need for sophisticated in-car sound systems and infotainment solutions that offer energy-efficient, high-quality sound. Class D amplifiers, thanks to their size, high power efficiency, and ability to pump out clear, rich sound with minimal heat, are perfect to be used in an auto setup. With the automotive industry shifting towards advanced technology like EVs and autonomous driving, the need for smarter audio systems are increasing as well. The rapidly evolving segment of car audio is witnessing the hike due to the blend of high-performance requirements in conjunction with optimized power consumptions, both of which are targeted by Class D amplifiers.
Class D Audio Amplifier Market Regional Analysis:
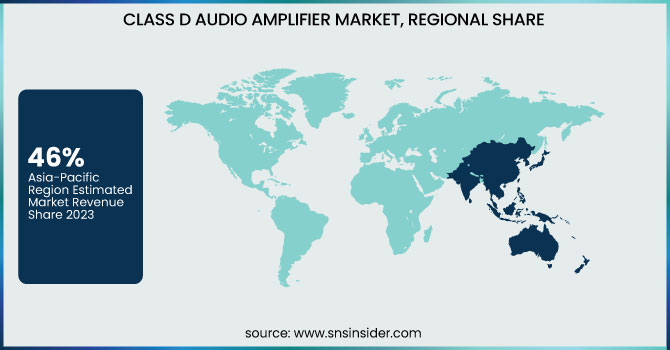
The Asia-Pacific region dominates the Class D audio amplifier market with the largest revenue share of around 46% in 2023. This dominance is also due to the explosive growth of sectors such as consumer electronics and automotive in countries such as China, Japan, and South Korea, where demand for energy-efficient and high-quality audio solutions is on the rise. The region boasts a solid manufacturing base, as well as technological advances in audio systems are driving growth of the Class D amplifier in a range of applications, including home audio systems, smartphones, and automotive infotainment. Additionally, the expanding middle-class population and the rise of smart home technology further fuel the demand for advanced audio products in Asia-Pacific, ensuring continued market growth.
The North America segment is expected to be the fastest-growing region in the Class D audio amplifier market from 2024 to 2032. This growth is attributed to factors such as the growing adoption of energy-efficient, high-performance audio solutions and rise in demand for audio systems in numerous applications, like home audio systems, automotive infotainment, and consumer electronic devices. Rising demand for smart home devices in North America, backed by sound technological infrastructure, is contributing to the proliferation of Class D amplifiers. Moreover, the region's emphasis on sustainability and energy efficiency in electronics is accelerating the shift toward Class D amplifiers, which offer superior power efficiency and compact designs. The automotive sector, in particular, is driving growth with the demand for high-quality in-car audio systems and infotainment solutions, contributing significantly to the regional market expansion.
Get Customized Report As Per Your Business Requirement - Enquiry Now
Class D Audio Amplifier Market Key Players:
Some of the Major Players in Class D Audio Amplifier Market along with their Products:
List of companies that produce RAM and related components for the Class D Audio Amplifiers market:
Recent Development:
Ans: The Class D Audio Amplifier Market is expected to grow at a CAGR of 8.82% during 2024-2032.
Ans: The Class D Audio Amplifier was USD 3.08 Billion in 2023 and is expected to Reach USD 6.58 Billion by 2032.
Ans: Rising demand for energy-efficient, compact, and high-performance audio solutions across consumer electronics and automotive applications.
Ans: The “2-Channel” segment dominated the Class D Audio Amplifier Market.
Ans: Asia-Pacific dominated the Class D Audio Amplifier in 2023.
Table of Content
1. Introduction
1.1 Market Definition
1.2 Scope (Inclusion and Exclusions)
1.3 Research Assumptions
2. Executive Summary
2.1 Market Overview
2.2 Regional Synopsis
2.3 Competitive Summary
3. Research Methodology
3.1 Top-Down Approach
3.2 Bottom-up Approach
3.3. Data Validation
3.4 Primary Interviews
4. Market Dynamics Impact Analysis
4.1 Market Driving Factors Analysis
4.1.1 Drivers
4.1.2 Restraints
4.1.3 Opportunities
4.1.4 Challenges
4.2 PESTLE Analysis
4.3 Porter’s Five Forces Model
5. Statistical Insights and Trends Reporting
5.1 Adoption Rate
5.2 Latency and Signal-to-Noise Ratio (SNR) Trends
5.3 Integration Rate in Smart Devices
5.4 Battery Drain Efficiency Metrics
5.5 Design-in Cycle Time
6. Competitive Landscape
6.1 List of Major Companies, By Region
6.2 Market Share Analysis, By Region
6.3 Product Benchmarking
6.3.1 Product specifications and features
6.3.2 Pricing
6.4 Strategic Initiatives
6.4.1 Marketing and promotional activities
6.4.2 Distribution and supply chain strategies
6.4.3 Expansion plans and new product launches
6.4.4 Strategic partnerships and collaborations
6.5 Technological Advancements
6.6 Market Positioning and Branding
7. Class D Audio Amplifier Market Segmentation, by Type
7.1 Chapter Overview
7.2 Tow Vehicles
7.2.1 Tow Vehicles Market Trends Analysis (2020-2032)
7.2.2 Tow Vehicles Market Size Estimates and Forecasts to 2032 (USD Billion)
7.3 Assembly Line Vehicles
7.3.1 Assembly Line Vehicles Market Trends Analysis (2020-2032)
7.3.2 Assembly Line Vehicles Market Size Estimates and Forecasts to 2032 (USD Billion)
7.4 Pallet Trucks
7.4.1 Pallet Trucks Market Trends Analysis (2020-2032)
7.4.2 Pallet Trucks Market Size Estimates and Forecasts to 2032 (USD Billion)
7.5 Unit Load Carriers
7.5.1 Unit Load Carriers Market Trends Analysis (2020-2032)
7.5.2 Unit Load Carriers Market Size Estimates and Forecasts to 2032 (USD Billion)
7.6 Forklift Vehicles
7.5.1 Forklift Vehicles Market Trends Analysis (2020-2032)
7.5.2 Forklift Vehicles Market Size Estimates and Forecasts to 2032 (USD Billion)
7.7 Others
7.5.1 Others Market Trends Analysis (2020-2032)
7.5.2 Others Market Size Estimates and Forecasts to 2032 (USD Billion)
8. Class D Audio Amplifier Market Segmentation, by Navigation Technology
8.1 Chapter Overview
8.2 Laser Guidance
8.2.1 Laser Guidance Market Trends Analysis (2020-2032)
8.2.2 Laser Guidance Market Size Estimates and Forecasts to 2032 (USD Billion)
8.3 Inductive Guidance
8.3.1 Inductive Guidance Market Trends Analysis (2020-2032)
8.3.2 Inductive Guidance Market Size Estimates and Forecasts to 2032 (USD Billion)
8.4 Magnetic Guidance
8.4.1 Magnetic Guidance Market Trends Analysis (2020-2032)
8.4.2 Magnetic Guidance Market Size Estimates and Forecasts to 2032 (USD Billion)
8.5 Vision Guidance
8.5.1 Vision Guidance Market Trends Analysis (2020-2032)
8.5.2 Vision Guidance Market Size Estimates and Forecasts to 2032 (USD Billion)
8.6 Optical Tape Guidance
8.6.1 Optical Tape Guidance Market Trends Analysis (2020-2032)
8.6.2 Optical Tape Guidance Market Size Estimates and Forecasts to 2032 (USD Billion)
8.7 Others
8.7.1 Others Market Trends Analysis (2020-2032)
8.7.2 Others Market Size Estimates and Forecasts to 2032 (USD Billion)
9. Class D Audio Amplifier Market Segmentation, by Industry
9.1 Chapter Overview
9.2 Automotive
9.2.1 Automotive Market Trends Analysis (2020-2032)
9.2.2 Automotive Market Size Estimates and Forecasts to 2032 (USD Billion)
9.3 Food & Beverages
9.3.1 Food & Beverages Market Trends Analysis (2020-2032)
9.3.2 Food & Beverages Market Size Estimates and Forecasts to 2032 (USD Billion)
9.4 Metals & Heavy Machinery
9.4.1 Metals & Heavy Machinery Market Trends Analysis (2020-2032)
9.4.2 Metals & Heavy Machinery Market Size Estimates and Forecasts to 2032 (USD Billion)
9.5 Semiconductors & Electronics
9.5.1 Semiconductors & Electronics Market Trends Analysis (2020-2032)
9.5.2 Semiconductors & Electronics Market Size Estimates and Forecasts to 2032 (USD Billion)
9.6 E-commerce
9.6.1 E-commerce Market Trends Analysis (2020-2032)
9.6.2 E-commerce Market Size Estimates and Forecasts to 2032 (USD Billion)
9.7 Chemicals
9.7.1 Chemicals Market Trends Analysis (2020-2032)
9.7.2 Chemicals Market Size Estimates and Forecasts to 2032 (USD Billion)
9.8 Healthcare
9.8.1 Healthcare Market Trends Analysis (2020-2032)
9.8.2 Healthcare Market Size Estimates and Forecasts to 2032 (USD Billion)
9.9 3PL
9.9.1 3PL Market Trends Analysis (2020-2032)
9.9.2 3PL Market Size Estimates and Forecasts to 2032 (USD Billion)
9.10 Aviation
9.10.1 Aviation Market Trends Analysis (2020-2032)
9.10.2 Aviation Market Size Estimates and Forecasts to 2032 (USD Billion)
9.11 Others
9.11.1 Others Market Trends Analysis (2020-2032)
9.11.2 Others Market Size Estimates and Forecasts to 2032 (USD Billion)
10. Regional Analysis
10.1 Chapter Overview
10.2 North America
10.2.1 Trends Analysis
10.2.2 North America Class D Audio Amplifier Market Estimates and Forecasts, by Country (2020-2032) (USD Billion)
10.2.3 North America Class D Audio Amplifier Market Estimates and Forecasts, by Type (2020-2032) (USD Billion)
10.2.4 North America Class D Audio Amplifier Market Estimates and Forecasts, by Navigation Technology (2020-2032) (USD Billion)
10.2.5 North America Class D Audio Amplifier Market Estimates and Forecasts, by Industry (2020-2032) (USD Billion)
10.2.6 USA
10.2.6.1 USA Class D Audio Amplifier Market Estimates and Forecasts, by Type (2020-2032) (USD Billion)
10.2.6.2 USA Class D Audio Amplifier Market Estimates and Forecasts, by Navigation Technology (2020-2032) (USD Billion)
10.2.6.3 USA Class D Audio Amplifier Market Estimates and Forecasts, by Industry (2020-2032) (USD Billion)
10.2.7 Canada
10.2.7.1 Canada Class D Audio Amplifier Market Estimates and Forecasts, by Type (2020-2032) (USD Billion)
10.2.7.2 Canada Class D Audio Amplifier Market Estimates and Forecasts, by Navigation Technology (2020-2032) (USD Billion)
10.2.7.3 Canada Class D Audio Amplifier Market Estimates and Forecasts, by Industry (2020-2032) (USD Billion)
10.2.8 Mexico
10.2.8.1 Mexico Class D Audio Amplifier Market Estimates and Forecasts, by Type (2020-2032) (USD Billion)
10.2.8.2 Mexico Class D Audio Amplifier Market Estimates and Forecasts, by Navigation Technology (2020-2032) (USD Billion)
10.2.8.3 Mexico Class D Audio Amplifier Market Estimates and Forecasts, by Industry (2020-2032) (USD Billion)
10.3 Europe
10.3.1 Eastern Europe
10.3.1.1 Trends Analysis
10.3.1.2 Eastern Europe Class D Audio Amplifier Market Estimates and Forecasts, by Country (2020-2032) (USD Billion)
10.3.1.3 Eastern Europe Class D Audio Amplifier Market Estimates and Forecasts, by Type (2020-2032) (USD Billion)
10.3.1.4 Eastern Europe Class D Audio Amplifier Market Estimates and Forecasts, by Navigation Technology (2020-2032) (USD Billion)
10.3.1.5 Eastern Europe Class D Audio Amplifier Market Estimates and Forecasts, by Industry (2020-2032) (USD Billion)
10.3.1.6 Poland
10.3.1.6.1 Poland Class D Audio Amplifier Market Estimates and Forecasts, by Type (2020-2032) (USD Billion)
10.3.1.6.2 Poland Class D Audio Amplifier Market Estimates and Forecasts, by Navigation Technology (2020-2032) (USD Billion)
10.3.1.6.3 Poland Class D Audio Amplifier Market Estimates and Forecasts, by Industry (2020-2032) (USD Billion)
10.3.1.7 Romania
10.3.1.7.1 Romania Class D Audio Amplifier Market Estimates and Forecasts, by Type (2020-2032) (USD Billion)
10.3.1.7.2 Romania Class D Audio Amplifier Market Estimates and Forecasts, by Navigation Technology (2020-2032) (USD Billion)
10.3.1.7.3 Romania Class D Audio Amplifier Market Estimates and Forecasts, by Industry (2020-2032) (USD Billion)
10.3.1.8 Hungary
10.3.1.8.1 Hungary Class D Audio Amplifier Market Estimates and Forecasts, by Type (2020-2032) (USD Billion)
10.3.1.8.2 Hungary Class D Audio Amplifier Market Estimates and Forecasts, by Navigation Technology (2020-2032) (USD Billion)
10.3.1.8.3 Hungary Class D Audio Amplifier Market Estimates and Forecasts, by Industry (2020-2032) (USD Billion)
10.3.1.9 Turkey
10.3.1.9.1 Turkey Class D Audio Amplifier Market Estimates and Forecasts, by Type (2020-2032) (USD Billion)
10.3.1.9.2 Turkey Class D Audio Amplifier Market Estimates and Forecasts, by Navigation Technology (2020-2032) (USD Billion)
10.3.1.9.3 Turkey Class D Audio Amplifier Market Estimates and Forecasts, by Industry (2020-2032) (USD Billion)
10.3.1.10 Rest of Eastern Europe
10.3.1.10.1 Rest of Eastern Europe Class D Audio Amplifier Market Estimates and Forecasts, by Type (2020-2032) (USD Billion)
10.3.1.10.2 Rest of Eastern Europe Class D Audio Amplifier Market Estimates and Forecasts, by Navigation Technology (2020-2032) (USD Billion)
10.3.1.10.3 Rest of Eastern Europe Class D Audio Amplifier Market Estimates and Forecasts, by Industry (2020-2032) (USD Billion)
10.3.2 Western Europe
10.3.2.1 Trends Analysis
10.3.2.2 Western Europe Class D Audio Amplifier Market Estimates and Forecasts, by Country (2020-2032) (USD Billion)
10.3.2.3 Western Europe Class D Audio Amplifier Market Estimates and Forecasts, by Type (2020-2032) (USD Billion)
10.3.2.4 Western Europe Class D Audio Amplifier Market Estimates and Forecasts, by Navigation Technology (2020-2032) (USD Billion)
10.3.2.5 Western Europe Class D Audio Amplifier Market Estimates and Forecasts, by Industry (2020-2032) (USD Billion)
10.3.2.6 Germany
10.3.2.6.1 Germany Class D Audio Amplifier Market Estimates and Forecasts, by Type (2020-2032) (USD Billion)
10.3.2.6.2 Germany Class D Audio Amplifier Market Estimates and Forecasts, by Navigation Technology (2020-2032) (USD Billion)
10.3.2.6.3 Germany Class D Audio Amplifier Market Estimates and Forecasts, by Industry (2020-2032) (USD Billion)
10.3.2.7 France
10.3.2.7.1 France Class D Audio Amplifier Market Estimates and Forecasts, by Type (2020-2032) (USD Billion)
10.3.2.7.2 France Class D Audio Amplifier Market Estimates and Forecasts, by Navigation Technology (2020-2032) (USD Billion)
10.3.2.7.3 France Class D Audio Amplifier Market Estimates and Forecasts, by Industry (2020-2032) (USD Billion)
10.3.2.8 UK
10.3.2.8.1 UK Class D Audio Amplifier Market Estimates and Forecasts, by Type (2020-2032) (USD Billion)
10.3.2.8.2 UK Class D Audio Amplifier Market Estimates and Forecasts, by Navigation Technology (2020-2032) (USD Billion)
10.3.2.8.3 UK Class D Audio Amplifier Market Estimates and Forecasts, by Industry (2020-2032) (USD Billion)
10.3.2.9 Italy
10.3.2.9.1 Italy Class D Audio Amplifier Market Estimates and Forecasts, by Type (2020-2032) (USD Billion)
10.3.2.9.2 Italy Class D Audio Amplifier Market Estimates and Forecasts, by Navigation Technology (2020-2032) (USD Billion)
10.3.2.9.3 Italy Class D Audio Amplifier Market Estimates and Forecasts, by Industry (2020-2032) (USD Billion)
10.3.2.10 Spain
10.3.2.10.1 Spain Class D Audio Amplifier Market Estimates and Forecasts, by Type (2020-2032) (USD Billion)
10.3.2.10.2 Spain Class D Audio Amplifier Market Estimates and Forecasts, by Navigation Technology (2020-2032) (USD Billion)
10.3.2.10.3 Spain Class D Audio Amplifier Market Estimates and Forecasts, by Industry (2020-2032) (USD Billion)
10.3.2.11 Netherlands
10.3.2.11.1 Netherlands Class D Audio Amplifier Market Estimates and Forecasts, by Type (2020-2032) (USD Billion)
10.3.2.11.2 Netherlands Class D Audio Amplifier Market Estimates and Forecasts, by Navigation Technology (2020-2032) (USD Billion)
10.3.2.11.3 Netherlands Class D Audio Amplifier Market Estimates and Forecasts, by Industry (2020-2032) (USD Billion)
10.3.2.12 Switzerland
10.3.2.12.1 Switzerland Class D Audio Amplifier Market Estimates and Forecasts, by Type (2020-2032) (USD Billion)
10.3.2.12.2 Switzerland Class D Audio Amplifier Market Estimates and Forecasts, by Navigation Technology (2020-2032) (USD Billion)
10.3.2.12.3 Switzerland Class D Audio Amplifier Market Estimates and Forecasts, by Industry (2020-2032) (USD Billion)
10.3.2.13 Austria
10.3.2.13.1 Austria Class D Audio Amplifier Market Estimates and Forecasts, by Type (2020-2032) (USD Billion)
10.3.2.13.2 Austria Class D Audio Amplifier Market Estimates and Forecasts, by Navigation Technology (2020-2032) (USD Billion)
10.3.2.13.3 Austria Class D Audio Amplifier Market Estimates and Forecasts, by Industry (2020-2032) (USD Billion)
10.3.2.14 Rest of Western Europe
10.3.2.14.1 Rest of Western Europe Class D Audio Amplifier Market Estimates and Forecasts, by Type (2020-2032) (USD Billion)
10.3.2.14.2 Rest of Western Europe Class D Audio Amplifier Market Estimates and Forecasts, by Navigation Technology (2020-2032) (USD Billion)
10.3.2.14.3 Rest of Western Europe Class D Audio Amplifier Market Estimates and Forecasts, by Industry (2020-2032) (USD Billion)
10.4 Asia Pacific
10.4.1 Trends Analysis
10.4.2 Asia Pacific Class D Audio Amplifier Market Estimates and Forecasts, by Country (2020-2032) (USD Billion)
10.4.3 Asia Pacific Class D Audio Amplifier Market Estimates and Forecasts, by Type (2020-2032) (USD Billion)
10.4.4 Asia Pacific Class D Audio Amplifier Market Estimates and Forecasts, by Navigation Technology (2020-2032) (USD Billion)
10.4.5 Asia Pacific Class D Audio Amplifier Market Estimates and Forecasts, by Industry (2020-2032) (USD Billion)
10.4.6 China
10.4.6.1 China Class D Audio Amplifier Market Estimates and Forecasts, by Type (2020-2032) (USD Billion)
10.4.6.2 China Class D Audio Amplifier Market Estimates and Forecasts, by Navigation Technology (2020-2032) (USD Billion)
10.4.6.3 China Class D Audio Amplifier Market Estimates and Forecasts, by Industry (2020-2032) (USD Billion)
10.4.7 India
10.4.7.1 India Class D Audio Amplifier Market Estimates and Forecasts, by Type (2020-2032) (USD Billion)
10.4.7.2 India Class D Audio Amplifier Market Estimates and Forecasts, by Navigation Technology (2020-2032) (USD Billion)
10.4.7.3 India Class D Audio Amplifier Market Estimates and Forecasts, by Industry (2020-2032) (USD Billion)
10.4.8 Japan
10.4.8.1 Japan Class D Audio Amplifier Market Estimates and Forecasts, by Type (2020-2032) (USD Billion)
10.4.8.2 Japan Class D Audio Amplifier Market Estimates and Forecasts, by Navigation Technology (2020-2032) (USD Billion)
10.4.8.3 Japan Class D Audio Amplifier Market Estimates and Forecasts, by Industry (2020-2032) (USD Billion)
10.4.9 South Korea
10.4.9.1 South Korea Class D Audio Amplifier Market Estimates and Forecasts, by Type (2020-2032) (USD Billion)
10.4.9.2 South Korea Class D Audio Amplifier Market Estimates and Forecasts, by Navigation Technology (2020-2032) (USD Billion)
10.4.9.3 South Korea Class D Audio Amplifier Market Estimates and Forecasts, by Industry (2020-2032) (USD Billion)
10.4.10 Vietnam
10.4.10.1 Vietnam Class D Audio Amplifier Market Estimates and Forecasts, by Type (2020-2032) (USD Billion)
10.4.10.2 Vietnam Class D Audio Amplifier Market Estimates and Forecasts, by Navigation Technology (2020-2032) (USD Billion)
10.4.10.3 Vietnam Class D Audio Amplifier Market Estimates and Forecasts, by Industry (2020-2032) (USD Billion)
10.4.11 Singapore
10.4.11.1 Singapore Class D Audio Amplifier Market Estimates and Forecasts, by Type (2020-2032) (USD Billion)
10.4.11.2 Singapore Class D Audio Amplifier Market Estimates and Forecasts, by Navigation Technology (2020-2032) (USD Billion)
10.4.11.3 Singapore Class D Audio Amplifier Market Estimates and Forecasts, by Industry (2020-2032) (USD Billion)
10.4.12 Australia
10.4.12.1 Australia Class D Audio Amplifier Market Estimates and Forecasts, by Type (2020-2032) (USD Billion)
10.4.12.2 Australia Class D Audio Amplifier Market Estimates and Forecasts, by Navigation Technology (2020-2032) (USD Billion)
10.4.12.3 Australia Class D Audio Amplifier Market Estimates and Forecasts, by Industry (2020-2032) (USD Billion)
10.4.13 Rest of Asia Pacific
10.4.13.1 Rest of Asia Pacific Class D Audio Amplifier Market Estimates and Forecasts, by Type (2020-2032) (USD Billion)
10.4.13.2 Rest of Asia Pacific Class D Audio Amplifier Market Estimates and Forecasts, by Navigation Technology (2020-2032) (USD Billion)
10.4.13.3 Rest of Asia Pacific Class D Audio Amplifier Market Estimates and Forecasts, by Industry (2020-2032) (USD Billion)
10.5 Middle East and Africa
10.5.1 Middle East
10.5.1.1 Trends Analysis
10.5.1.2 Middle East Class D Audio Amplifier Market Estimates and Forecasts, by Country (2020-2032) (USD Billion)
10.5.1.3 Middle East Class D Audio Amplifier Market Estimates and Forecasts, by Type (2020-2032) (USD Billion)
10.5.1.4 Middle East Class D Audio Amplifier Market Estimates and Forecasts, by Navigation Technology (2020-2032) (USD Billion)
10.5.1.5 Middle East Class D Audio Amplifier Market Estimates and Forecasts, by Industry (2020-2032) (USD Billion)
10.5.1.6 UAE
10.5.1.6.1 UAE Class D Audio Amplifier Market Estimates and Forecasts, by Type (2020-2032) (USD Billion)
10.5.1.6.2 UAE Class D Audio Amplifier Market Estimates and Forecasts, by Navigation Technology (2020-2032) (USD Billion)
10.5.1.6.3 UAE Class D Audio Amplifier Market Estimates and Forecasts, by Industry (2020-2032) (USD Billion)
10.5.1.7 Egypt
10.5.1.7.1 Egypt Class D Audio Amplifier Market Estimates and Forecasts, by Type (2020-2032) (USD Billion)
10.5.1.7.2 Egypt Class D Audio Amplifier Market Estimates and Forecasts, by Navigation Technology (2020-2032) (USD Billion)
10.5.1.7.3 Egypt Class D Audio Amplifier Market Estimates and Forecasts, by Industry (2020-2032) (USD Billion)
10.5.1.8 Saudi Arabia
10.5.1.8.1 Saudi Arabia Class D Audio Amplifier Market Estimates and Forecasts, by Type (2020-2032) (USD Billion)
10.5.1.8.2 Saudi Arabia Class D Audio Amplifier Market Estimates and Forecasts, by Navigation Technology (2020-2032) (USD Billion)
10.5.1.8.3 Saudi Arabia Class D Audio Amplifier Market Estimates and Forecasts, by Industry (2020-2032) (USD Billion)
10.5.1.9 Qatar
10.5.1.9.1 Qatar Class D Audio Amplifier Market Estimates and Forecasts, by Type (2020-2032) (USD Billion)
10.5.1.9.2 Qatar Class D Audio Amplifier Market Estimates and Forecasts, by Navigation Technology (2020-2032) (USD Billion)
10.5.1.9.3 Qatar Class D Audio Amplifier Market Estimates and Forecasts, by Industry (2020-2032) (USD Billion)
10.5.1.10 Rest of Middle East
10.5.1.10.1 Rest of Middle East Class D Audio Amplifier Market Estimates and Forecasts, by Type (2020-2032) (USD Billion)
10.5.1.10.2 Rest of Middle East Class D Audio Amplifier Market Estimates and Forecasts, by Navigation Technology (2020-2032) (USD Billion)
10.5.1.10.3 Rest of Middle East Class D Audio Amplifier Market Estimates and Forecasts, by Industry (2020-2032) (USD Billion)
10.5.2 Africa
10.5.2.1 Trends Analysis
10.5.2.2 Africa Class D Audio Amplifier Market Estimates and Forecasts, by Country (2020-2032) (USD Billion)
10.5.2.3 Africa Class D Audio Amplifier Market Estimates and Forecasts, by Type (2020-2032) (USD Billion)
10.5.2.4 Africa Class D Audio Amplifier Market Estimates and Forecasts, by Navigation Technology (2020-2032) (USD Billion)
10.5.2.5 Africa Class D Audio Amplifier Market Estimates and Forecasts, by Industry (2020-2032) (USD Billion)
10.5.2.6 South Africa
10.5.2.6.1 South Africa Class D Audio Amplifier Market Estimates and Forecasts, by Type (2020-2032) (USD Billion)
10.5.2.6.2 South Africa Class D Audio Amplifier Market Estimates and Forecasts, by Navigation Technology (2020-2032) (USD Billion)
10.5.2.6.3 South Africa Class D Audio Amplifier Market Estimates and Forecasts, by Industry (2020-2032) (USD Billion)
10.5.2.7 Nigeria
10.5.2.7.1 Nigeria Class D Audio Amplifier Market Estimates and Forecasts, by Type (2020-2032) (USD Billion)
10.5.2.7.2 Nigeria Class D Audio Amplifier Market Estimates and Forecasts, by Navigation Technology (2020-2032) (USD Billion)
10.5.2.7.3 Nigeria Class D Audio Amplifier Market Estimates and Forecasts, by Industry (2020-2032) (USD Billion)
10.5.2.8 Rest of Africa
10.5.2.8.1 Rest of Africa Class D Audio Amplifier Market Estimates and Forecasts, by Type (2020-2032) (USD Billion)
10.5.2.8.2 Rest of Africa Class D Audio Amplifier Market Estimates and Forecasts, by Navigation Technology (2020-2032) (USD Billion)
10.5.2.8.3 Rest of Africa Class D Audio Amplifier Market Estimates and Forecasts, by Industry (2020-2032) (USD Billion)
10.6 Latin America
10.6.1 Trends Analysis
10.6.2 Latin America Class D Audio Amplifier Market Estimates and Forecasts, by Country (2020-2032) (USD Billion)
10.6.3 Latin America Class D Audio Amplifier Market Estimates and Forecasts, by Type (2020-2032) (USD Billion)
10.6.4 Latin America Class D Audio Amplifier Market Estimates and Forecasts, by Navigation Technology (2020-2032) (USD Billion)
10.6.5 Latin America Class D Audio Amplifier Market Estimates and Forecasts, by Industry (2020-2032) (USD Billion)
10.6.6 Brazil
10.6.6.1 Brazil Class D Audio Amplifier Market Estimates and Forecasts, by Type (2020-2032) (USD Billion)
10.6.6.2 Brazil Class D Audio Amplifier Market Estimates and Forecasts, by Navigation Technology (2020-2032) (USD Billion)
10.6.6.3 Brazil Class D Audio Amplifier Market Estimates and Forecasts, by Industry (2020-2032) (USD Billion)
10.6.7 Argentina
10.6.7.1 Argentina Class D Audio Amplifier Market Estimates and Forecasts, by Type (2020-2032) (USD Billion)
10.6.7.2 Argentina Class D Audio Amplifier Market Estimates and Forecasts, by Navigation Technology (2020-2032) (USD Billion)
10.6.7.3 Argentina Class D Audio Amplifier Market Estimates and Forecasts, by Industry (2020-2032) (USD Billion)
10.6.8 Colombia
10.6.8.1 Colombia Class D Audio Amplifier Market Estimates and Forecasts, by Type (2020-2032) (USD Billion)
10.6.8.2 Colombia Class D Audio Amplifier Market Estimates and Forecasts, by Navigation Technology (2020-2032) (USD Billion)
10.6.8.3 Colombia Class D Audio Amplifier Market Estimates and Forecasts, by Industry (2020-2032) (USD Billion)
10.6.9 Rest of Latin America
10.6.9.1 Rest of Latin America Class D Audio Amplifier Market Estimates and Forecasts, by Type (2020-2032) (USD Billion)
10.6.9.2 Rest of Latin America Class D Audio Amplifier Market Estimates and Forecasts, by Navigation Technology (2020-2032) (USD Billion)
10.6.9.3 Rest of Latin America Class D Audio Amplifier Market Estimates and Forecasts, by Industry (2020-2032) (USD Billion)
11. Company Profiles
11.1 Silicon Labs
11.1.1 Company Overview
11.1.2 Financial
11.1.3 Products/ Services Offered
11.1.4 SWOT Analysis
11.2 STMicroelectronics
11.2.1 Company Overview
11.2.2 Financial
11.2.3 Products/ Services Offered
11.2.4 SWOT Analysis
11.3 Texas Instruments
11.3.1 Company Overview
11.3.2 Financial
11.3.3 Products/ Services Offered
11.3.4 SWOT Analysis
11.4 NXP Semiconductors
11.4.1 Company Overview
11.4.2 Financial
11.4.3 Products/ Services Offered
11.4.4 SWOT Analysis
11.5 Qualcomm
11.5.1 Company Overview
11.5.2 Financial
11.5.3 Products/ Services Offered
11.5.4 SWOT Analysis
11.6 ON Semiconductor
11.6.1 Company Overview
11.6.2 Financial
11.6.3 Products/ Services Offered
11.6.4 SWOT Analysis
11.7 ROHM Semiconductor
11.7.1 Company Overview
11.7.2 Financial
11.7.3 Products/ Services Offered
11.7.4 SWOT Analysis
11.8 Monolithic Power Systems
11.8.1 Company Overview
11.8.2 Financial
11.8.3 Products/ Services Offered
11.8.4 SWOT Analysis
11.9 Tempo Semiconductor
11.9.1 Company Overview
11.9.2 Financial
11.9.3 Products/ Services Offered
11.9.4 SWOT Analysis
11.10 Nuvoton Technology
11.10.1 Company Overview
11.10.2 Financial
11.10.3 Products/ Services Offered
11.10.4 SWOT Analysis
12. Use Cases and Best Practices
13. Conclusion
An accurate research report requires proper strategizing as well as implementation. There are multiple factors involved in the completion of good and accurate research report and selecting the best methodology to compete the research is the toughest part. Since the research reports we provide play a crucial role in any company’s decision-making process, therefore we at SNS Insider always believe that we should choose the best method which gives us results closer to reality. This allows us to reach at a stage wherein we can provide our clients best and accurate investment to output ratio.
Each report that we prepare takes a timeframe of 350-400 business hours for production. Starting from the selection of titles through a couple of in-depth brain storming session to the final QC process before uploading our titles on our website we dedicate around 350 working hours. The titles are selected based on their current market cap and the foreseen CAGR and growth.
The 5 steps process:
Step 1: Secondary Research:
Secondary Research or Desk Research is as the name suggests is a research process wherein, we collect data through the readily available information. In this process we use various paid and unpaid databases which our team has access to and gather data through the same. This includes examining of listed companies’ annual reports, Journals, SEC filling etc. Apart from this our team has access to various associations across the globe across different industries. Lastly, we have exchange relationships with various university as well as individual libraries.
Step 2: Primary Research
When we talk about primary research, it is a type of study in which the researchers collect relevant data samples directly, rather than relying on previously collected data. This type of research is focused on gaining content specific facts that can be sued to solve specific problems. Since the collected data is fresh and first hand therefore it makes the study more accurate and genuine.
We at SNS Insider have divided Primary Research into 2 parts.
Part 1 wherein we interview the KOLs of major players as well as the upcoming ones across various geographic regions. This allows us to have their view over the market scenario and acts as an important tool to come closer to the accurate market numbers. As many as 45 paid and unpaid primary interviews are taken from both the demand and supply side of the industry to make sure we land at an accurate judgement and analysis of the market.
This step involves the triangulation of data wherein our team analyses the interview transcripts, online survey responses and observation of on filed participants. The below mentioned chart should give a better understanding of the part 1 of the primary interview.
Part 2: In this part of primary research the data collected via secondary research and the part 1 of the primary research is validated with the interviews from individual consultants and subject matter experts.
Consultants are those set of people who have at least 12 years of experience and expertise within the industry whereas Subject Matter Experts are those with at least 15 years of experience behind their back within the same space. The data with the help of two main processes i.e., FGDs (Focused Group Discussions) and IDs (Individual Discussions). This gives us a 3rd party nonbiased primary view of the market scenario making it a more dependable one while collation of the data pointers.
Step 3: Data Bank Validation
Once all the information is collected via primary and secondary sources, we run that information for data validation. At our intelligence centre our research heads track a lot of information related to the market which includes the quarterly reports, the daily stock prices, and other relevant information. Our data bank server gets updated every fortnight and that is how the information which we collected using our primary and secondary information is revalidated in real time.
Step 4: QA/QC Process
After all the data collection and validation our team does a final level of quality check and quality assurance to get rid of any unwanted or undesired mistakes. This might include but not limited to getting rid of the any typos, duplication of numbers or missing of any important information. The people involved in this process include technical content writers, research heads and graphics people. Once this process is completed the title gets uploader on our platform for our clients to read it.
Step 5: Final QC/QA Process:
This is the last process and comes when the client has ordered the study. In this process a final QA/QC is done before the study is emailed to the client. Since we believe in giving our clients a good experience of our research studies, therefore, to make sure that we do not lack at our end in any way humanly possible we do a final round of quality check and then dispatch the study to the client.
Key Segments:
By Amplifier Type
Mono-Channel
2-Channel
4-Channel
6-Channel
Others
By Devices
Television Sets
Home Audio Systems
Desktop and Laptops
Automotive Infotainment Systems
Others
By End Use
Automotive
Consumer Electronics
Others
Request for Segment Customization as per your Business Requirement: Segment Customization Request
Regional Coverage:
North America
US
Canada
Mexico
Europe
Eastern Europe
Poland
Romania
Hungary
Turkey
Rest of Eastern Europe
Western Europe
Germany
France
UK
Italy
Spain
Netherlands
Switzerland
Austria
Rest of Western Europe
Asia Pacific
China
India
Japan
South Korea
Vietnam
Singapore
Australia
Rest of Asia Pacific
Middle East & Africa
Middle East
UAE
Egypt
Saudi Arabia
Qatar
Rest of Middle East
Africa
Nigeria
South Africa
Rest of Africa
Latin America
Brazil
Argentina
Colombia
Rest of Latin America
Request for Country Level Research Report: Country Level Customization Request
Available Customization
With the given market data, SNS Insider offers customization as per the company’s specific needs. The following customization options are available for the report:
Detailed Volume Analysis
Criss-Cross segment analysis (e.g. Product X Application)
Competitive Product Benchmarking
Geographic Analysis
Additional countries in any of the regions
Customized Data Representation
Detailed analysis and profiling of additional market players
The IoT in Smart Cities Market Size was valued at USD 195.18 Billion in 2023 and is expected to grow at a CAGR of 19.3% to reach USD 952.69 Billion by 2032.
The Thin Film and Printed Battery Market was valued at 178.23 Million in 2023 and is projected to reach USD 1374.74 Million by 2032, growing at a CAGR of 25.48% from 2024 to 2032.
The Embedded Security Market Size was valued at USD 7.07 Billion in 2023 and is expected to grow at 6.60% CAGR to reach USD 12.52 Billion by 2032.
The DIY Home Automation Market was valued at USD 50.46 billion in 2023 and is projected to reach USD 508.78 billion by 2032, growing at a CAGR of 29.28 % from 2024 to 2032.
The global Defect Detection Market Size was valued at USD 3.73 Billion in 2023 and is expected to grow at a CAGR of 7.45% to reach USD 7.12 Billion by 2032.
The Automatic Ticket Machine Market Size was valued at USD 13.19 Billion in 2023 and is expected to grow at 13.11% CAGR to reach USD 39.91 Billion by 2032.
Hi! Click one of our member below to chat on Phone