image

CIP Chemicals Market Report Scope & Overview:

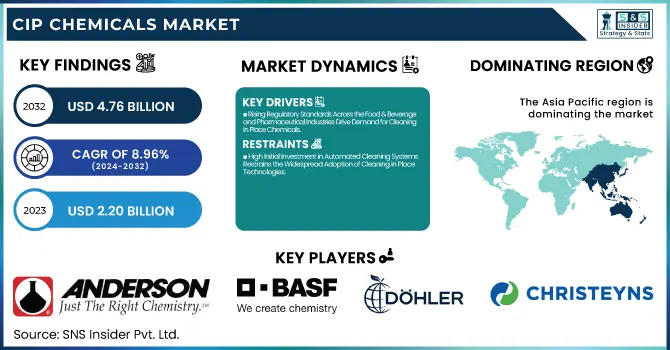
The CIP Chemicals Market Size was valued at USD 2.20 Billion in 2023 and is expected to reach USD 4.76 Billion by 2032, growing at a CAGR of 8.96% over the forecast period of 2024-2032.

The CIP Chemicals Market is experiencing notable growth, fueled by key drivers that shape its evolution. Regulatory compliance plays a crucial role, ensuring that companies adhere to strict safety standards in chemical usage. As industries look to improve efficiency, the cost-saving benefits of Cleaning in Place systems are becoming evident, significantly lowering operational expenses. Cleaning chemical consumption varies by region, with North America and Europe leading in adoption due to stringent regulations. The shift from manual cleaning to automated CIP chemicals is accelerating, driven by efficiency and sustainability. Meanwhile, increased R&D investment is fueling innovation in the sector, with manufacturers focusing on advanced, eco-friendly chemical solutions. Our report offers an in-depth analysis of these key trends shaping the market's future.

Market Dynamics

Drivers

  • Rising Regulatory Standards Across the Food & Beverage and Pharmaceutical Industries Drive Demand for Cleaning in Place Chemicals

The growing demand for Cleaning in Place chemicals is significantly influenced by stringent regulatory standards in industries such as food processing, beverages, and pharmaceuticals. Governments worldwide are imposing increasingly stringent hygiene and safety standards to ensure that food, beverages, and pharmaceutical products meet health and safety regulations. To comply with these regulations, manufacturers in these industries are turning to Cleaning in Place systems for their ability to maintain consistent and high-quality cleaning standards. CIP chemicals are critical in ensuring that all surfaces, including production lines, equipment, and storage vessels, are thoroughly cleaned and disinfected. Failure to comply with hygiene standards can lead to significant fines, recalls, or damage to a brand’s reputation, which is why companies are increasingly adopting these chemicals to stay compliant. The regulatory pressure driving this demand will continue to push the growth of the Cleaning in Place chemicals market.

Restraints

  • High Initial Investment in Automated Cleaning Systems Restrains the Widespread Adoption of Cleaning in Place Technologies

Despite the numerous benefits offered by automated Cleaning in Place systems, the high initial investment required to adopt these technologies can be a major restraint, particularly for smaller enterprises or businesses operating in price-sensitive markets. The upfront costs for installing automated systems, training staff, and maintaining these systems can be prohibitively expensive for businesses that are already under financial pressure. Small and medium-sized companies may be hesitant to switch from traditional cleaning methods to automated systems because of the significant capital expenditure involved. Additionally, some companies may already have existing manual cleaning processes in place, and upgrading to more advanced systems could disrupt their operations. This financial barrier limits the adoption of automated Cleaning in Place technologies, particularly in emerging economies where cost considerations are more critical. Overcoming this restraint requires creating cost-effective solutions and offering incentives to encourage investment in automated cleaning technologies.

Opportunities

  • Technological Advancements in Chemical Formulations for Specific Industry Applications Open New Market Segments

Technological advancements in chemical formulations present a significant opportunity for companies operating in the Cleaning in Place chemicals market. As industries such as pharmaceuticals, biotechnology, and high-tech manufacturing become more specialized, there is an increasing demand for cleaning chemicals that are specifically designed for their unique requirements. For instance, pharmaceutical manufacturing requires cleaners that do not leave residue and can be used on highly sensitive equipment. Similarly, biotechnology applications demand chemicals that do not interfere with delicate bioprocesses. By investing in research and development, manufacturers can create tailored Cleaning in Place chemical formulations that meet the precise needs of these specialized industries. These innovations can lead to the emergence of new market segments, enabling manufacturers to diversify their offerings and create a competitive advantage in a rapidly evolving market.

Challenge

  • Resistance to Change and Slow Adoption of Advanced Cleaning Systems in Traditional Industries

Despite the growing advantages of Cleaning in Place systems, many traditional industries remain resistant to adopting newer technologies. Industries such as textiles, agriculture, and chemicals, which have relied on manual cleaning processes for decades, often face challenges in transitioning to automated systems. Concerns about high upfront costs, the complexity of implementation, and the need to retrain employees can delay the adoption of Cleaning in Place systems. In some cases, companies might be comfortable with their existing systems and hesitant to make the necessary investments for modernization. Additionally, businesses in developing economies may be more focused on cost-cutting measures and less willing to adopt automated systems. Overcoming this challenge requires manufacturers to provide clear evidence of the long-term cost savings, operational benefits, and compliance advantages associated with automated cleaning systems.

Segmental Analysis

By Product Type

Alkaline cleaners dominated the Cleaning in Place chemicals market in 2023, holding a significant market share of 40.2%. Their dominance is attributed to their effectiveness in removing organic materials such as fats, oils, and proteins, which are common in industries like food processing, beverages, and dairy. Regulatory bodies like the U.S. Food and Drug Administration (FDA) and the European Food Safety Authority (EFSA) have set strict hygiene standards, pushing industries to adopt more efficient and reliable cleaning methods. Alkaline cleaners provide consistent cleaning results in high-temperature environments, which is a key factor in their widespread use across these industries. The growing focus on maintaining hygiene standards and preventing contamination further supports the continued use of alkaline-based chemicals, making them indispensable in CIP systems.  

By Process Type

Recirculated cleaning dominated the CIP chemicals market in 2023, accounting for 64.7% of the market share. This process allows for the reuse of cleaning chemicals and water, which makes it highly cost-effective and environmentally sustainable. Many industries, especially in food and beverage production, are increasingly adopting recirculated cleaning systems due to their reduced water and chemical usage. The sustainability movement, backed by environmental regulations, is a significant factor driving this trend. Regulatory bodies such as the Environmental Protection Agency (EPA) and the European Union have emphasized resource conservation, including water and chemicals, reinforcing the preference for recirculated cleaning systems. Their widespread use in industries that require continuous production processes, such as dairy and brewing, further highlights their dominance.

By Form

In 2023, liquid forms of Cleaning in Place chemicals dominated the CIP chemicals market, with a 72.4% market share. Liquid cleaners are highly effective and versatile, making them ideal for automatic and continuous cleaning applications across various industries. Their easy application and ability to cover large surface areas quickly make them a preferred choice for businesses. Regulatory authorities like the FDA and the European Medicines Agency (EMA) have reinforced stringent cleaning standards, further driving the demand for liquid-based solutions. For example, in pharmaceutical and biotechnology industries, liquid cleaners are essential in maintaining the required cleanliness levels without leaving any residue. This widespread application in diverse industries, especially in regulated sectors, solidifies their dominance in the market.

By End-Use Industry

The Food and Beverage industry dominated the Cleaning in Place chemicals market in 2023, holding a 32.8% market share. This industry’s demand for stringent hygiene practices has driven the adoption of Cleaning in Place systems, which help prevent contamination and ensure product safety. Regulatory organizations such as the U.S. Food Safety and Inspection Service (FSIS) and the European Union’s Food Safety Authority have enforced strict regulations that mandate the use of effective cleaning systems to safeguard public health. The high volume of daily cleaning requirements in food production facilities, combined with increasing consumer demand for hygienic products, continues to drive growth in this sector. The Food and Beverage industry’s reliance on efficient, effective cleaning systems ensures its dominance in the market.

Regional Analysis

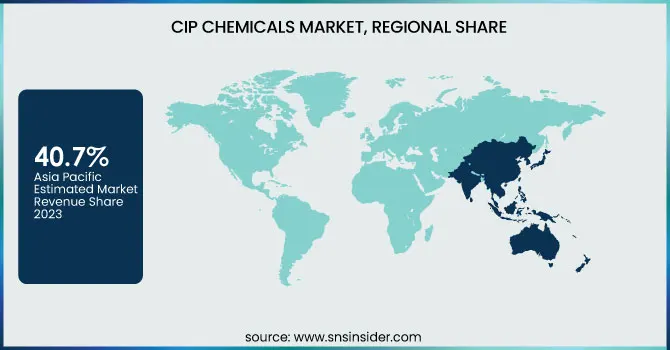
In 2023, the Asia Pacific region dominated the Cleaning in Place chemicals market, accounting for approximately 40.7% of the total market share. The region's growth can be attributed to the rapid expansion of industries such as food and beverage, pharmaceuticals, and manufacturing. Countries like China and India are leading this surge, driven by increasing urbanization, rising disposable incomes, and heightened awareness of hygiene standards. For instance, China's food processing sector has witnessed a significant boom, with the government implementing stricter food safety regulations, thereby boosting the demand for effective cleaning solutions. Additionally, India's dairy industry, one of the largest globally, is increasingly adopting Cleaning in Place systems to ensure compliance with health standards. As the region continues to industrialize and invest in advanced cleaning technologies, its dominance in the Cleaning in Place chemicals market is expected to persist.

The European region emerged as the fastest-growing market for Cleaning in Place chemicals, with a significant growth rate during the forecast period. This growth is primarily driven by stringent regulatory standards surrounding hygiene and safety, particularly in the food and beverage and pharmaceutical sectors. Countries such as Germany, France, and the United Kingdom are at the forefront of adopting advanced Cleaning in Place technologies to meet these regulations. For example, the German food processing industry, known for its high standards, is increasingly investing in innovative cleaning solutions to comply with EU hygiene directives. Moreover, the rising consumer preference for organic and clean-label products is prompting manufacturers to implement rigorous cleaning protocols, further driving the demand for Cleaning in Place chemicals in the region. As Europe prioritizes sustainability and health safety, its market for Cleaning in Place chemicals is set for substantial growth.

Key Players

  • Anderson Chemical Company (ProClean CIP, ProClean Alka CIP)

  • BASF SE (Sokalan CP 5, Trilon M)

  • CCL Pentasol (Pentasol CIP Cleaner, Pentasol Acid Detergent)

  • Christeyns (Acifoam, Neutrafoam)

  • DeLaval Inc. (DeLaval CIP Super, DeLaval Acid Cleaner)

  • Diversey Holdings, Ltd. (Divo CIP, Diverclean Sonic)

  • Döhler Group (Döhler CIP Acid, Döhler CIP Caustic)

  • Ecolab Inc. (Horolith CIP, P3-Ultrasil)

  • FINK TEC GmbH (FINK Alka CIP, FINK Desana CIP)

  • Hydrite Chemical Co. (Hydri-Clean CIP, Hydri-San 100)

  • Kersia Group (CIP Alkaline, CIP Acid)

  • Neogen Corporation (Acid-A-Foam, BioSentry 904)

  • Novozymes A/S (Medley Enzymatic Cleaner, Carezyme)

  • Quat-Chem Ltd. (Quat-Chem CIP 200, Quat-Chem Acid CIP)

  • Sanosil Ltd. (Sanosil S015, Sanosil Super 25)

  • Spartan Chemical Company, Inc. (High Acid Cleaner FP, Spartan CIP Alkaline)

  • Steris Corporation (Steris CIP 200, ProKlenz ONE)

  • Zep Inc. (Zep FS CIP Cleaner, Zep Alkaline CIP)

  • Zschimmer & Schwarz (ZETALON CIP, ZETALON Acid Cleaner)

Recent Developments

  • August 2024: Norges Bank invested in renewable energy, focusing on the Cleaning in Place chemicals sector to enhance sustainability within its portfolio and support eco-friendly practices.

  • March 2024: Lotte Chemical partnered with a consortium to develop blue and green ammonia technologies, promoting sustainable hydrogen production methods and highlighting a shift towards cleaner alternatives in chemical production.

CIP Chemicals Market Report Scope:

Report Attributes Details
Market Size in 2023 USD 2.20 Billion
Market Size by 2032 USD 4.76 Billion
CAGR CAGR of 8.96% From 2024 to 2032
Base Year 2023
Forecast Period 2024-2032
Historical Data 2020-2022
Report Scope & Coverage Market Size, Segments Analysis, Competitive  Landscape, Regional Analysis, DROC & SWOT Analysis, Forecast Outlook
Key Segments •By Product Type (Alkaline Cleaners, Acid Cleaners, Disinfectants/Sanitizers, Enzyme-Based Cleaners, Others)
•By Process Type (Single-Use Cleaning, Recirculated Cleaning)
•By Form (Liquid, Powder)
•By End-Use Industry (Food & Beverage, Dairy Processing, Brewery & Distillery, Pharmaceutical & Biotechnology, Cosmetics & Personal Care, Others)
Regional Analysis/Coverage North America (US, Canada, Mexico), Europe (Eastern Europe [Poland, Romania, Hungary, Turkey, Rest of Eastern Europe] Western Europe] Germany, France, UK, Italy, Spain, Netherlands, Switzerland, Austria, Rest of Western Europe]), Asia Pacific (China, India, Japan, South Korea, Vietnam, Singapore, Australia, Rest of Asia Pacific), Middle East & Africa (Middle East [UAE, Egypt, Saudi Arabia, Qatar, Rest of Middle East], Africa [Nigeria, South Africa, Rest of Africa], Latin America (Brazil, Argentina, Colombia, Rest of Latin America)
Company Profiles Ecolab Inc., Diversey Holdings, Ltd., Kersia Group, Neogen Corporation, Spartan Chemical Company, Inc., Quat-Chem Ltd., Zep Inc., Sanosil Ltd., Hydrite Chemical Co., Döhler Group and other key players

Frequently Asked Questions

Table of Contents

1. Introduction

1.1 Market Definition

1.2 Scope (Inclusion and Exclusions)

1.3 Research Assumptions

2. Executive Summary

2.1 Market Overview

2.2 Regional Synopsis

2.3 Competitive Summary

3. Research Methodology

3.1 Top-Down Approach

3.2 Bottom-up Approach

3.3. Data Validation

3.4 Primary Interviews

4. Market Dynamics Impact Analysis

4.1 Market Driving Factors Analysis

4.1.1 Drivers

4.1.2 Restraints

4.1.3 Opportunities

4.1.4 Challenges

4.2 PESTLE Analysis

4.3 Porter’s Five Forces Model

5. Statistical Insights and Trends Reporting

5.1 Regulatory Compliance Data

5.2 Cost-Saving Benefits of CIP Systems

5.3 Cleaning Chemical Consumption by Region

5.4 CIP Chemicals Demand vs. Manual Cleaning

5.5 R&D Investment in CIP Chemicals

6. Competitive Landscape

6.1 List of Major Companies, By Region

6.2 Market Share Analysis, By Region

6.3 Product Benchmarking

6.3.1 Product specifications and features

6.3.2 Pricing

6.4 Strategic Initiatives

6.4.1 Marketing and promotional activities

6.4.2 Distribution and supply chain strategies

6.4.3 Expansion plans and new product launches

6.4.4 Strategic partnerships and collaborations

6.5 Technological Advancements

6.6 Market Positioning and Branding

7. CIP Chemicals Market Segmentation, by Product Type

7.1 Chapter Overview

7.2 Alkaline Cleaners

7.2.1 Alkaline Cleaners Market Trends Analysis (2020-2032)

7.2.2 Alkaline Cleaners Market Size Estimates and Forecasts to 2032 (USD Billion)

7.3 Acid Cleaners

7.3.1 Acid Cleaners Market Trends Analysis (2020-2032)

7.3.2 Acid Cleaners Market Size Estimates and Forecasts to 2032 (USD Billion)

7.4 Disinfectants/Sanitizers

7.4.1 Disinfectants/Sanitizers Market Trends Analysis (2020-2032)

7.4.2 Disinfectants/Sanitizers Market Size Estimates and Forecasts to 2032 (USD Billion)

7.5 Enzyme-Based Cleaners

7.5.1 Enzyme-Based Cleaners Market Trends Analysis (2020-2032)

7.5.2 Enzyme-Based Cleaners Market Size Estimates and Forecasts to 2032 (USD Billion)

7.6 Others

7.6.1 Others Market Trends Analysis (2020-2032)

7.6.2 Others Market Size Estimates and Forecasts to 2032 (USD Billion)

8. CIP Chemicals Market Segmentation, by Process Type

8.1 Chapter Overview

8.2 Single-Use Cleaning

8.2.1 Single-Use Cleaning Market Trends Analysis (2020-2032)

8.2.2 Single-Use Cleaning Market Size Estimates and Forecasts to 2032 (USD Billion)

8.3 Recirculated Cleaning

8.3.1 Recirculated Cleaning Market Trends Analysis (2020-2032)

8.3.2 Recirculated Cleaning Market Size Estimates and Forecasts to 2032 (USD Billion)

9. CIP Chemicals Market Segmentation, by Form

9.1 Chapter Overview

9.2 Liquid

9.2.1 Liquid Market Trends Analysis (2020-2032)

9.2.2 Liquid Market Size Estimates and Forecasts to 2032 (USD Billion)

9.3 Powder

9.3.1 Powder Market Trends Analysis (2020-2032)

9.3.2 Powder Market Size Estimates and Forecasts to 2032 (USD Billion)

10. CIP Chemicals Market Segmentation, by End-Use Industry

10.1 Chapter Overview

10.2 Food & Beverage

10.2.1 Food & Beverage Market Trends Analysis (2020-2032)

10.2.2 Food & Beverage Market Size Estimates and Forecasts to 2032 (USD Billion)

10.3 Dairy Processing

10.3.1 Dairy Processing Market Trends Analysis (2020-2032)

10.3.2 Dairy Processing Market Size Estimates and Forecasts to 2032 (USD Billion)

10.4 Brewery & Distillery

               10.4.1 Brewery & Distillery Market Trends Analysis (2020-2032)

10.4.2 Brewery & Distillery Market Size Estimates and Forecasts to 2032 (USD Billion)

10.5 Pharmaceutical & Biotechnology

10.5.1 Pharmaceutical & Biotechnology Market Trends Analysis (2020-2032)

10.5.2 Pharmaceutical & Biotechnology Market Size Estimates and Forecasts to 2032 (USD Billion)

10.6 Cosmetics & Personal Care

10.6.1 Cosmetics & Personal Care Market Trends Analysis (2020-2032)

10.6.2 Cosmetics & Personal Care Market Size Estimates and Forecasts to 2032 (USD Billion)

10.7 Others

10.7.1 Others Market Trends Analysis (2020-2032)

10.7.2 Others Market Size Estimates and Forecasts to 2032 (USD Billion)

11. Regional Analysis

11.1 Chapter Overview

11.2 North America

11.2.1 Trends Analysis

11.2.2 North America CIP Chemicals Market Estimates and Forecasts, by Country (2020-2032) (USD Billion)

11.2.3 North America CIP Chemicals Market Estimates and Forecasts, by Product Type (2020-2032) (USD Billion) 

11.2.4 North America CIP Chemicals Market Estimates and Forecasts, by Process Type (2020-2032) (USD Billion)

11.2.5 North America CIP Chemicals Market Estimates and Forecasts, by Form (2020-2032) (USD Billion)

11.2.6 North America CIP Chemicals Market Estimates and Forecasts, by End-Use Industry (2020-2032) (USD Billion)

11.2.7 USA

11.2.7.1 USA CIP Chemicals Market Estimates and Forecasts, by Product Type (2020-2032) (USD Billion)

11.2.7.2 USA CIP Chemicals Market Estimates and Forecasts, by Process Type (2020-2032) (USD Billion)

11.2.7.3 USA CIP Chemicals Market Estimates and Forecasts, by Form (2020-2032) (USD Billion)

11.2.7.4 USA CIP Chemicals Market Estimates and Forecasts, by End-Use Industry (2020-2032) (USD Billion)

11.2.8 Canada

11.2.8.1 Canada CIP Chemicals Market Estimates and Forecasts, by Product Type (2020-2032) (USD Billion)

11.2.8.2 Canada CIP Chemicals Market Estimates and Forecasts, by Process Type (2020-2032) (USD Billion)

11.2.8.3 Canada CIP Chemicals Market Estimates and Forecasts, by Form (2020-2032) (USD Billion)

11.2.8.4 Canada CIP Chemicals Market Estimates and Forecasts, by End-Use Industry (2020-2032) (USD Billion)

11.2.9 Mexico

11.2.9.1 Mexico CIP Chemicals Market Estimates and Forecasts, by Product Type (2020-2032) (USD Billion)

11.2.9.2 Mexico CIP Chemicals Market Estimates and Forecasts, by Process Type (2020-2032) (USD Billion)

11.2.9.3 Mexico CIP Chemicals Market Estimates and Forecasts, by Form (2020-2032) (USD Billion)

11.2.9.4 Mexico CIP Chemicals Market Estimates and Forecasts, by End-Use Industry (2020-2032) (USD Billion)

11.3 Europe

11.3.1 Eastern Europe

11.3.1.1 Trends Analysis

11.3.1.2 Eastern Europe CIP Chemicals Market Estimates and Forecasts, by Country (2020-2032) (USD Billion)

11.3.1.3 Eastern Europe CIP Chemicals Market Estimates and Forecasts, by Product Type (2020-2032) (USD Billion) 

11.3.1.4 Eastern Europe CIP Chemicals Market Estimates and Forecasts, by Process Type (2020-2032) (USD Billion)

11.3.1.5 Eastern Europe CIP Chemicals Market Estimates and Forecasts, by Form (2020-2032) (USD Billion)

11.3.1.6 Eastern Europe CIP Chemicals Market Estimates and Forecasts, by End-Use Industry (2020-2032) (USD Billion)

11.3.1.7 Poland

11.3.1.7.1 Poland CIP Chemicals Market Estimates and Forecasts, by Product Type (2020-2032) (USD Billion)

11.3.1.7.2 Poland CIP Chemicals Market Estimates and Forecasts, by Process Type (2020-2032) (USD Billion)

11.3.1.7.3 Poland CIP Chemicals Market Estimates and Forecasts, by Form (2020-2032) (USD Billion)

11.3.1.7.4 Poland CIP Chemicals Market Estimates and Forecasts, by End-Use Industry (2020-2032) (USD Billion)

11.3.1.8 Romania

11.3.1.8.1 Romania CIP Chemicals Market Estimates and Forecasts, by Product Type (2020-2032) (USD Billion)

11.3.1.8.2 Romania CIP Chemicals Market Estimates and Forecasts, by Process Type (2020-2032) (USD Billion)

11.3.1.8.3 Romania CIP Chemicals Market Estimates and Forecasts, by Form (2020-2032) (USD Billion)

11.3.1.8.4 Romania CIP Chemicals Market Estimates and Forecasts, by End-Use Industry (2020-2032) (USD Billion)

11.3.1.9 Hungary

11.3.1.9.1 Hungary CIP Chemicals Market Estimates and Forecasts, by Product Type (2020-2032) (USD Billion)

11.3.1.9.2 Hungary CIP Chemicals Market Estimates and Forecasts, by Process Type (2020-2032) (USD Billion)

11.3.1.9.3 Hungary CIP Chemicals Market Estimates and Forecasts, by Form (2020-2032) (USD Billion)

11.3.1.9.4 Hungary CIP Chemicals Market Estimates and Forecasts, by End-Use Industry (2020-2032) (USD Billion)

11.3.1.10 Turkey

11.3.1.10.1 Turkey CIP Chemicals Market Estimates and Forecasts, by Product Type (2020-2032) (USD Billion)

11.3.1.10.2 Turkey CIP Chemicals Market Estimates and Forecasts, by Process Type (2020-2032) (USD Billion)

11.3.1.10.3 Turkey CIP Chemicals Market Estimates and Forecasts, by Form (2020-2032) (USD Billion)

11.3.1.10.4 Turkey CIP Chemicals Market Estimates and Forecasts, by End-Use Industry (2020-2032) (USD Billion)

11.3.1.11 Rest of Eastern Europe

11.3.1.11.1 Rest of Eastern Europe CIP Chemicals Market Estimates and Forecasts, by Product Type (2020-2032) (USD Billion)

11.3.1.11.2 Rest of Eastern Europe CIP Chemicals Market Estimates and Forecasts, by Process Type (2020-2032) (USD Billion)

11.3.1.11.3 Rest of Eastern Europe CIP Chemicals Market Estimates and Forecasts, by Form (2020-2032) (USD Billion)

11.3.1.11.4 Rest of Eastern Europe CIP Chemicals Market Estimates and Forecasts, by End-Use Industry (2020-2032) (USD Billion)

11.3.2 Western Europe

11.3.2.1 Trends Analysis

11.3.2.2 Western Europe CIP Chemicals Market Estimates and Forecasts, by Country (2020-2032) (USD Billion)

11.3.2.3 Western Europe CIP Chemicals Market Estimates and Forecasts, by Product Type (2020-2032) (USD Billion) 

11.3.2.4 Western Europe CIP Chemicals Market Estimates and Forecasts, by Process Type (2020-2032) (USD Billion)

11.3.2.5 Western Europe CIP Chemicals Market Estimates and Forecasts, by Form (2020-2032) (USD Billion)

11.3.2.6 Western Europe CIP Chemicals Market Estimates and Forecasts, by End-Use Industry (2020-2032) (USD Billion)

11.3.2.7 Germany

11.3.2.7.1 Germany CIP Chemicals Market Estimates and Forecasts, by Product Type (2020-2032) (USD Billion)

11.3.2.7.2 Germany CIP Chemicals Market Estimates and Forecasts, by Process Type (2020-2032) (USD Billion)

11.3.2.7.3 Germany CIP Chemicals Market Estimates and Forecasts, by Form (2020-2032) (USD Billion)

11.3.2.7.4 Germany CIP Chemicals Market Estimates and Forecasts, by End-Use Industry (2020-2032) (USD Billion)

11.3.2.8 France

11.3.2.8.1 France CIP Chemicals Market Estimates and Forecasts, by Product Type (2020-2032) (USD Billion)

11.3.2.8.2 France CIP Chemicals Market Estimates and Forecasts, by Process Type (2020-2032) (USD Billion)

11.3.2.8.3 France CIP Chemicals Market Estimates and Forecasts, by Form (2020-2032) (USD Billion)

11.3.2.8.4 France CIP Chemicals Market Estimates and Forecasts, by End-Use Industry (2020-2032) (USD Billion)

11.3.2.9 UK

11.3.2.9.1 UK CIP Chemicals Market Estimates and Forecasts, by Product Type (2020-2032) (USD Billion)

11.3.2.9.2 UK CIP Chemicals Market Estimates and Forecasts, by Process Type (2020-2032) (USD Billion)

11.3.2.9.3 UK CIP Chemicals Market Estimates and Forecasts, by Form (2020-2032) (USD Billion)

11.3.2.9.4 UK CIP Chemicals Market Estimates and Forecasts, by End-Use Industry (2020-2032) (USD Billion)

11.3.2.10 Italy

11.3.2.10.1 Italy CIP Chemicals Market Estimates and Forecasts, by Product Type (2020-2032) (USD Billion)

11.3.2.10.2 Italy CIP Chemicals Market Estimates and Forecasts, by Process Type (2020-2032) (USD Billion)

11.3.2.10.3 Italy CIP Chemicals Market Estimates and Forecasts, by Form (2020-2032) (USD Billion)

11.3.2.10.4 Italy CIP Chemicals Market Estimates and Forecasts, by End-Use Industry (2020-2032) (USD Billion)

11.3.2.11 Spain

11.3.2.11.1 Spain CIP Chemicals Market Estimates and Forecasts, by Product Type (2020-2032) (USD Billion)

11.3.2.11.2 Spain CIP Chemicals Market Estimates and Forecasts, by Process Type (2020-2032) (USD Billion)

11.3.2.11.3 Spain CIP Chemicals Market Estimates and Forecasts, by Form (2020-2032) (USD Billion)

11.3.2.11.4 Spain CIP Chemicals Market Estimates and Forecasts, by End-Use Industry (2020-2032) (USD Billion)

11.3.2.12 Netherlands

11.3.2.12.1 Netherlands CIP Chemicals Market Estimates and Forecasts, by Product Type (2020-2032) (USD Billion)

11.3.2.12.2 Netherlands CIP Chemicals Market Estimates and Forecasts, by Process Type (2020-2032) (USD Billion)

11.3.2.12.3 Netherlands CIP Chemicals Market Estimates and Forecasts, by Form (2020-2032) (USD Billion)

11.3.2.12.4 Netherlands CIP Chemicals Market Estimates and Forecasts, by End-Use Industry (2020-2032) (USD Billion)

11.3.2.13 Switzerland

11.3.2.13.1 Switzerland CIP Chemicals Market Estimates and Forecasts, by Product Type (2020-2032) (USD Billion)

11.3.2.13.2 Switzerland CIP Chemicals Market Estimates and Forecasts, by Process Type (2020-2032) (USD Billion)

11.3.2.13.3 Switzerland CIP Chemicals Market Estimates and Forecasts, by Form (2020-2032) (USD Billion)

11.3.2.13.4 Switzerland CIP Chemicals Market Estimates and Forecasts, by End-Use Industry (2020-2032) (USD Billion)

11.3.2.14 Austria

11.3.2.14.1 Austria CIP Chemicals Market Estimates and Forecasts, by Product Type (2020-2032) (USD Billion)

11.3.2.14.2 Austria CIP Chemicals Market Estimates and Forecasts, by Process Type (2020-2032) (USD Billion)

11.3.2.14.3 Austria CIP Chemicals Market Estimates and Forecasts, by Form (2020-2032) (USD Billion)

11.3.2.14.4 Austria CIP Chemicals Market Estimates and Forecasts, by End-Use Industry (2020-2032) (USD Billion)

11.3.2.15 Rest of Western Europe

11.3.2.15.1 Rest of Western Europe CIP Chemicals Market Estimates and Forecasts, by Product Type (2020-2032) (USD Billion)

11.3.2.15.2 Rest of Western Europe CIP Chemicals Market Estimates and Forecasts, by Process Type (2020-2032) (USD Billion)

11.3.2.15.3 Rest of Western Europe CIP Chemicals Market Estimates and Forecasts, by Form (2020-2032) (USD Billion)

11.3.2.15.4 Rest of Western Europe CIP Chemicals Market Estimates and Forecasts, by End-Use Industry (2020-2032) (USD Billion)

11.4 Asia Pacific

11.4.1 Trends Analysis

11.4.2 Asia Pacific CIP Chemicals Market Estimates and Forecasts, by Country (2020-2032) (USD Billion)

11.4.3 Asia Pacific CIP Chemicals Market Estimates and Forecasts, by Product Type (2020-2032) (USD Billion) 

11.4.4 Asia Pacific CIP Chemicals Market Estimates and Forecasts, by Process Type (2020-2032) (USD Billion)

11.4.5 Asia Pacific CIP Chemicals Market Estimates and Forecasts, by Form (2020-2032) (USD Billion)

11.4.6 Asia Pacific CIP Chemicals Market Estimates and Forecasts, by End-Use Industry (2020-2032) (USD Billion)

11.4.7 China

11.4.7.1 China CIP Chemicals Market Estimates and Forecasts, by Product Type (2020-2032) (USD Billion)

11.4.7.2 China CIP Chemicals Market Estimates and Forecasts, by Process Type (2020-2032) (USD Billion)

11.4.7.3 China CIP Chemicals Market Estimates and Forecasts, by Form (2020-2032) (USD Billion)

11.4.7.4 China CIP Chemicals Market Estimates and Forecasts, by End-Use Industry (2020-2032) (USD Billion)

11.4.8 India

11.4.8.1 India CIP Chemicals Market Estimates and Forecasts, by Product Type (2020-2032) (USD Billion)

11.4.8.2 India CIP Chemicals Market Estimates and Forecasts, by Process Type (2020-2032) (USD Billion)

11.4.8.3 India CIP Chemicals Market Estimates and Forecasts, by Form (2020-2032) (USD Billion)

11.4.8.4 India CIP Chemicals Market Estimates and Forecasts, by End-Use Industry (2020-2032) (USD Billion)

11.4.9 Japan

11.4.9.1 Japan CIP Chemicals Market Estimates and Forecasts, by Product Type (2020-2032) (USD Billion)

11.4.9.2 Japan CIP Chemicals Market Estimates and Forecasts, by Process Type (2020-2032) (USD Billion)

11.4.9.3 Japan CIP Chemicals Market Estimates and Forecasts, by Form (2020-2032) (USD Billion)

11.4.9.4 Japan CIP Chemicals Market Estimates and Forecasts, by End-Use Industry (2020-2032) (USD Billion)

11.4.10 South Korea

11.4.10.1 South Korea CIP Chemicals Market Estimates and Forecasts, by Product Type (2020-2032) (USD Billion)

11.4.10.2 South Korea CIP Chemicals Market Estimates and Forecasts, by Process Type (2020-2032) (USD Billion)

11.4.10.3 South Korea CIP Chemicals Market Estimates and Forecasts, by Form (2020-2032) (USD Billion)

11.4.10.4 South Korea CIP Chemicals Market Estimates and Forecasts, by End-Use Industry (2020-2032) (USD Billion)

11.4.11 Vietnam

11.4.11.1 Vietnam CIP Chemicals Market Estimates and Forecasts, by Product Type (2020-2032) (USD Billion)

11.4.11.2 Vietnam CIP Chemicals Market Estimates and Forecasts, by Process Type (2020-2032) (USD Billion)

11.4.11.3 Vietnam CIP Chemicals Market Estimates and Forecasts, by Form (2020-2032) (USD Billion)

11.4.11.4 Vietnam CIP Chemicals Market Estimates and Forecasts, by End-Use Industry (2020-2032) (USD Billion)

11.4.12 Singapore

11.4.12.1 Singapore CIP Chemicals Market Estimates and Forecasts, by Product Type (2020-2032) (USD Billion)

11.4.12.2 Singapore CIP Chemicals Market Estimates and Forecasts, by Process Type (2020-2032) (USD Billion)

11.4.12.3 Singapore CIP Chemicals Market Estimates and Forecasts, by Form (2020-2032) (USD Billion)

11.4.12.4 Singapore CIP Chemicals Market Estimates and Forecasts, by End-Use Industry (2020-2032) (USD Billion)

11.4.13 Australia

11.4.13.1 Australia CIP Chemicals Market Estimates and Forecasts, by Product Type (2020-2032) (USD Billion)

11.4.13.2 Australia CIP Chemicals Market Estimates and Forecasts, by Process Type (2020-2032) (USD Billion)

11.4.13.3 Australia CIP Chemicals Market Estimates and Forecasts, by Form (2020-2032) (USD Billion)

11.4.13.4 Australia CIP Chemicals Market Estimates and Forecasts, by End-Use Industry (2020-2032) (USD Billion)

11.4.14 Rest of Asia Pacific

11.4.14.1 Rest of Asia Pacific CIP Chemicals Market Estimates and Forecasts, by Product Type (2020-2032) (USD Billion)

11.4.14.2 Rest of Asia Pacific CIP Chemicals Market Estimates and Forecasts, by Process Type (2020-2032) (USD Billion)

11.4.14.3 Rest of Asia Pacific CIP Chemicals Market Estimates and Forecasts, by Form (2020-2032) (USD Billion)

11.4.14.4 Rest of Asia Pacific CIP Chemicals Market Estimates and Forecasts, by End-Use Industry (2020-2032) (USD Billion)

11.5 Middle East and Africa

11.5.1 Middle East

11.5.1.1 Trends Analysis

11.5.1.2 Middle East CIP Chemicals Market Estimates and Forecasts, by Country (2020-2032) (USD Billion)

11.5.1.3 Middle East CIP Chemicals Market Estimates and Forecasts, by Product Type (2020-2032) (USD Billion) 

11.5.1.4 Middle East CIP Chemicals Market Estimates and Forecasts, by Process Type (2020-2032) (USD Billion)

11.5.1.5 Middle East CIP Chemicals Market Estimates and Forecasts, by Form (2020-2032) (USD Billion)

11.5.1.6 Middle East CIP Chemicals Market Estimates and Forecasts, by End-Use Industry (2020-2032) (USD Billion)

11.5.1.7 UAE

11.5.1.7.1 UAE CIP Chemicals Market Estimates and Forecasts, by Product Type (2020-2032) (USD Billion)

11.5.1.7.2 UAE CIP Chemicals Market Estimates and Forecasts, by Process Type (2020-2032) (USD Billion)

11.5.1.7.3 UAE CIP Chemicals Market Estimates and Forecasts, by Form (2020-2032) (USD Billion)

11.5.1.7.4 UAE CIP Chemicals Market Estimates and Forecasts, by End-Use Industry  (2020-2032) (USD Billion)

11.5.1.8 Egypt

11.5.1.8.1 Egypt CIP Chemicals Market Estimates and Forecasts, by Product Type (2020-2032) (USD Billion)

11.5.1.8.2 Egypt CIP Chemicals Market Estimates and Forecasts, by Process Type (2020-2032) (USD Billion)

11.5.1.8.3 Egypt CIP Chemicals Market Estimates and Forecasts, by Form (2020-2032) (USD Billion)

11.5.1.8.4 Egypt CIP Chemicals Market Estimates and Forecasts, by End-Use Industry (2020-2032) (USD Billion)

11.5.1.9 Saudi Arabia

11.5.1.9.1 Saudi Arabia CIP Chemicals Market Estimates and Forecasts, by Product Type (2020-2032) (USD Billion)

11.5.1.9.2 Saudi Arabia CIP Chemicals Market Estimates and Forecasts, by Process Type (2020-2032) (USD Billion)

11.5.1.9.3 Saudi Arabia CIP Chemicals Market Estimates and Forecasts, by Form (2020-2032) (USD Billion)

11.5.1.9.4 Saudi Arabia CIP Chemicals Market Estimates and Forecasts, by End-Use Industry (2020-2032) (USD Billion)

11.5.1.10 Qatar

11.5.1.10.1 Qatar CIP Chemicals Market Estimates and Forecasts, by Product Type (2020-2032) (USD Billion)

11.5.1.10.2 Qatar CIP Chemicals Market Estimates and Forecasts, by Process Type (2020-2032) (USD Billion)

11.5.1.10.3 Qatar CIP Chemicals Market Estimates and Forecasts, by Form (2020-2032) (USD Billion)

11.5.1.10.4 Qatar CIP Chemicals Market Estimates and Forecasts, by End-Use Industry (2020-2032) (USD Billion)

11.5.1.11 Rest of Middle East

11.5.1.11.1 Rest of Middle East CIP Chemicals Market Estimates and Forecasts, by Product Type (2020-2032) (USD Billion)

11.5.1.11.2 Rest of Middle East CIP Chemicals Market Estimates and Forecasts, by Process Type (2020-2032) (USD Billion)

11.5.1.11.3 Rest of Middle East CIP Chemicals Market Estimates and Forecasts, by Form (2020-2032) (USD Billion)

11.5.1.11.4 Rest of Middle East CIP Chemicals Market Estimates and Forecasts, by End-Use Industry (2020-2032) (USD Billion)

11.5.2 Africa

11.5.2.1 Trends Analysis

11.5.2.2 Africa CIP Chemicals Market Estimates and Forecasts, by Country (2020-2032) (USD Billion)

11.5.2.3 Africa CIP Chemicals Market Estimates and Forecasts, by Product Type (2020-2032) (USD Billion) 

11.5.2.4 Africa CIP Chemicals Market Estimates and Forecasts, by Process Type (2020-2032) (USD Billion)

11.5.2.5 Africa CIP Chemicals Market Estimates and Forecasts, by Form (2020-2032) (USD Billion)

11.5.2.6 Africa CIP Chemicals Market Estimates and Forecasts, by End-Use Industry (2020-2032) (USD Billion)

11.5.2.7 South Africa

11.5.2.7.1 South Africa CIP Chemicals Market Estimates and Forecasts, by Product Type (2020-2032) (USD Billion)

11.5.2.7.2 South Africa CIP Chemicals Market Estimates and Forecasts, by Process Type (2020-2032) (USD Billion)

11.5.2.7.3 South Africa CIP Chemicals Market Estimates and Forecasts, by Form (2020-2032) (USD Billion)

11.5.2.7.4 South Africa CIP Chemicals Market Estimates and Forecasts, by End-Use Industry (2020-2032) (USD Billion)

11.5.2.8 Nigeria

11.5.2.8.1 Nigeria CIP Chemicals Market Estimates and Forecasts, by Product Type (2020-2032) (USD Billion)

11.5.2.8.2 Nigeria CIP Chemicals Market Estimates and Forecasts, by Process Type (2020-2032) (USD Billion)

11.5.2.8.3 Nigeria CIP Chemicals Market Estimates and Forecasts, by Form (2020-2032) (USD Billion)

11.5.2.8.4 Nigeria CIP Chemicals Market Estimates and Forecasts, by End-Use Industry (2020-2032) (USD Billion)

11.5.2.9 Rest of Africa

11.5.2.9.1 Rest of Africa CIP Chemicals Market Estimates and Forecasts, by Product Type (2020-2032) (USD Billion)

11.5.2.9.2 Rest of Africa CIP Chemicals Market Estimates and Forecasts, by Process Type (2020-2032) (USD Billion)

11.5.2.9.3 Rest of Africa CIP Chemicals Market Estimates and Forecasts, by Form (2020-2032) (USD Billion)

11.5.2.9.4 Rest of Africa CIP Chemicals Market Estimates and Forecasts, by End-Use Industry (2020-2032) (USD Billion)

11.6 Latin America

11.6.1 Trends Analysis

11.6.2 Latin America CIP Chemicals Market Estimates and Forecasts, by Country (2020-2032) (USD Billion)

11.6.3 Latin America CIP Chemicals Market Estimates and Forecasts, by Product Type (2020-2032) (USD Billion) 

11.6.4 Latin America CIP Chemicals Market Estimates and Forecasts, by Process Type (2020-2032) (USD Billion)

11.6.5 Latin America CIP Chemicals Market Estimates and Forecasts, by Form (2020-2032) (USD Billion)

11.6.6 Latin America CIP Chemicals Market Estimates and Forecasts, by End-Use Industry (2020-2032) (USD Billion)

11.6.7 Brazil

11.6.7.1 Brazil CIP Chemicals Market Estimates and Forecasts, by Product Type (2020-2032) (USD Billion)

11.6.7.2 Brazil CIP Chemicals Market Estimates and Forecasts, by Process Type (2020-2032) (USD Billion)

11.6.7.3 Brazil CIP Chemicals Market Estimates and Forecasts, by Form (2020-2032) (USD Billion)

11.6.7.4 Brazil CIP Chemicals Market Estimates and Forecasts, by End-Use Industry (2020-2032) (USD Billion)

11.6.8 Argentina

11.6.8.1 Argentina CIP Chemicals Market Estimates and Forecasts, by Product Type (2020-2032) (USD Billion)

11.6.8.2 Argentina CIP Chemicals Market Estimates and Forecasts, by Process Type (2020-2032) (USD Billion)

11.6.8.3 Argentina CIP Chemicals Market Estimates and Forecasts, by Form (2020-2032) (USD Billion)

11.6.8.4 Argentina CIP Chemicals Market Estimates and Forecasts, by End-Use Industry (2020-2032) (USD Billion)

11.6.9 Colombia

11.6.9.1 Colombia CIP Chemicals Market Estimates and Forecasts, by Product Type (2020-2032) (USD Billion)

11.6.9.2 Colombia CIP Chemicals Market Estimates and Forecasts, by Process Type (2020-2032) (USD Billion)

11.6.9.3 Colombia CIP Chemicals Market Estimates and Forecasts, by Form (2020-2032) (USD Billion)

11.6.9.4 Colombia CIP Chemicals Market Estimates and Forecasts, by End-Use Industry (2020-2032) (USD Billion)

11.6.10 Rest of Latin America

11.6.10.1 Rest of Latin America CIP Chemicals Market Estimates and Forecasts, by Product Type (2020-2032) (USD Billion)

11.6.10.2 Rest of Latin America CIP Chemicals Market Estimates and Forecasts, by Process Type (2020-2032) (USD Billion)

11.6.10.3 Rest of Latin America CIP Chemicals Market Estimates and Forecasts, by Form (2020-2032) (USD Billion)

11.6.10.4 Rest of Latin America CIP Chemicals Market Estimates and Forecasts, by End-Use Industry (2020-2032) (USD Billion)

12. Company Profiles

12.1 Ecolab Inc.

12.1.1 Company Overview

12.1.2 Financial

12.1.3 Products/ Services Offered

12.1.4 SWOT Analysis

12.2 Diversey Holdings, Ltd.

12.2.1 Company Overview

12.2.2 Financial

12.2.3 Products/ Services Offered

12.2.4 SWOT Analysis

12.3 Kersia Group

12.3.1 Company Overview

12.3.2 Financial

12.3.3 Products/ Services Offered

12.3.4 SWOT Analysis

12.4 Neogen Corporation

12.4.1 Company Overview

12.4.2 Financial

12.4.3 Products/ Services Offered

12.4.4 SWOT Analysis

12.5 Spartan Chemical Company, Inc.

12.5.1 Company Overview

12.5.2 Financial

12.5.3 Products/ Services Offered

12.5.4 SWOT Analysis

12.6 Quat-Chem Ltd.

12.6.1 Company Overview

12.6.2 Financial

12.6.3 Products/ Services Offered

12.6.4 SWOT Analysis

12.7 Zep Inc.

12.7.1 Company Overview

12.7.2 Financial

12.7.3 Products/ Services Offered

12.7.4 SWOT Analysis

12.8 Sanosil Ltd.

12.8.1 Company Overview

12.8.2 Financial

12.8.3 Products/ Services Offered

12.8.4 SWOT Analysis

12.9 Hydrite Chemical Co.

12.9.1 Company Overview

12.9.2 Financial

12.9.3 Products/ Services Offered

12.9.4 SWOT Analysis

12.10 Döhler Group

12.10.1 Company Overview

12.10.2 Financial

12.10.3 Products/ Services Offered

12.10.4 SWOT Analysis

13. Use Cases and Best Practices

14. Conclusion

An accurate research report requires proper strategizing as well as implementation. There are multiple factors involved in the completion of good and accurate research report and selecting the best methodology to compete the research is the toughest part. Since the research reports we provide play a crucial role in any company’s decision-making process, therefore we at SNS Insider always believe that we should choose the best method which gives us results closer to reality. This allows us to reach at a stage wherein we can provide our clients best and accurate investment to output ratio.

Each report that we prepare takes a timeframe of 350-400 business hours for production. Starting from the selection of titles through a couple of in-depth brain storming session to the final QC process before uploading our titles on our website we dedicate around 350 working hours. The titles are selected based on their current market cap and the foreseen CAGR and growth.


The 5 steps process:

Step 1: Secondary Research:

Secondary Research or Desk Research is as the name suggests is a research process wherein, we collect data through the readily available information. In this process we use various paid and unpaid databases which our team has access to and gather data through the same. This includes examining of listed companies’ annual reports, Journals, SEC filling etc. Apart from this our team has access to various associations across the globe across different industries. Lastly, we have exchange relationships with various university as well as individual libraries.

Secondary Research

Step 2: Primary Research

When we talk about primary research, it is a type of study in which the researchers collect relevant data samples directly, rather than relying on previously collected data.  This type of research is focused on gaining content specific facts that can be sued to solve specific problems. Since the collected data is fresh and first hand therefore it makes the study more accurate and genuine.

We at SNS Insider have divided Primary Research into 2 parts.

Part 1 wherein we interview the KOLs of major players as well as the upcoming ones across various geographic regions. This allows us to have their view over the market scenario and acts as an important tool to come closer to the accurate market numbers. As many as 45 paid and unpaid primary interviews are taken from both the demand and supply side of the industry to make sure we land at an accurate judgement and analysis of the market.

This step involves the triangulation of data wherein our team analyses the interview transcripts, online survey responses and observation of on filed participants. The below mentioned chart should give a better understanding of the part 1 of the primary interview.

Primary Research

Part 2: In this part of primary research the data collected via secondary research and the part 1 of the primary research is validated with the interviews from individual consultants and subject matter experts.

Consultants are those set of people who have at least 12 years of experience and expertise within the industry whereas Subject Matter Experts are those with at least 15 years of experience behind their back within the same space. The data with the help of two main processes i.e., FGDs (Focused Group Discussions) and IDs (Individual Discussions). This gives us a 3rd party nonbiased primary view of the market scenario making it a more dependable one while collation of the data pointers.

Step 3: Data Bank Validation

Once all the information is collected via primary and secondary sources, we run that information for data validation. At our intelligence centre our research heads track a lot of information related to the market which includes the quarterly reports, the daily stock prices, and other relevant information. Our data bank server gets updated every fortnight and that is how the information which we collected using our primary and secondary information is revalidated in real time.

Data Bank Validation

Step 4: QA/QC Process

After all the data collection and validation our team does a final level of quality check and quality assurance to get rid of any unwanted or undesired mistakes. This might include but not limited to getting rid of the any typos, duplication of numbers or missing of any important information. The people involved in this process include technical content writers, research heads and graphics people. Once this process is completed the title gets uploader on our platform for our clients to read it.

Step 5: Final QC/QA Process:

This is the last process and comes when the client has ordered the study. In this process a final QA/QC is done before the study is emailed to the client. Since we believe in giving our clients a good experience of our research studies, therefore, to make sure that we do not lack at our end in any way humanly possible we do a final round of quality check and then dispatch the study to the client.

Key Segments:

By Product Type

  • Alkaline Cleaners

  • Acid Cleaners

  • Disinfectants/Sanitizers

  • Enzyme-Based Cleaners

  • Others

By Process Type

  • Single-Use Cleaning

  • Recirculated Cleaning

By Form

  • Liquid

  • Powder

By End-Use Industry

  • Food & Beverage

  • Dairy Processing

  • Brewery & Distillery

  • Pharmaceutical & Biotechnology

  • Cosmetics & Personal Care

  • Others

Request for Segment Customization as per your Business Requirement: Segment Customization Request

Regional Coverage:

North America

  • US

  • Canada

  • Mexico

Europe

  • Eastern Europe

    • Poland

    • Romania

    • Hungary

    • Turkey

    • Rest of Eastern Europe

  • Western Europe

    • Germany

    • France

    • UK

    • Italy

    • Spain

    • Netherlands

    • Switzerland

    • Austria

    • Rest of Western Europe

Asia Pacific

  • China

  • India

  • Japan

  • South Korea

  • Vietnam

  • Singapore

  • Australia

  • Rest of Asia Pacific

Middle East & Africa

  • Middle East

    • UAE

    • Egypt

    • Saudi Arabia

    • Qatar

    • Rest of Middle East

  • Africa

    • Nigeria

    • South Africa

    • Rest of Africa

Latin America

  • Brazil

  • Argentina

  • Colombia

  • Rest of Latin America

Request for Country Level Research Report: Country Level Customization Request

Available Customization

With the given market data, SNS Insider offers customization as per the company’s specific needs. The following customization options are available for the report:

  • Detailed Volume Analysis

  • Criss-Cross segment analysis (e.g. Product X Application)

  • Competitive Product Benchmarking

  • Geographic Analysis

  • Additional countries in any of the regions

  • Customized Data Representation

  • Detailed analysis and profiling of additional market players


  •            5000 (33% Discount)


  •            8950 (40% Discount)


  •            3050 (23% Discount)

Start a Conversation

Hi! Click one of our member below to chat on Phone