Choline Chloride Market Report Scope & Overview:
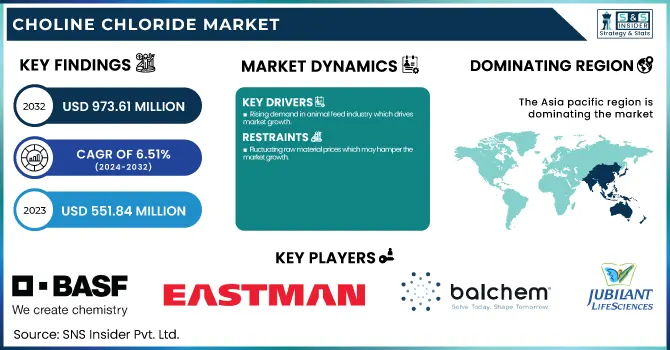
The Choline Chloride Market size was USD 551.84 Million in 2023 and is expected to reach USD 973.61 Million by 2032 and grow at a CAGR of 6.51 % over the forecast period of 2024-2032. The choline chloride market report provides a detailed analysis of global production capacity and utilization, segmented by country and grade in 2023. It covers feedstock price fluctuations and supply trends, highlighting cost dynamics. The report examines regulatory impacts on production and trade, including government policies and import-export restrictions. It also assesses environmental sustainability metrics, such as emissions, waste management, and compliance initiatives. Additionally, the report explores R&D investments in advanced formulations and the growing adoption of choline chloride in animal feed and emerging sectors like pharmaceuticals and personal care.
To Get more information on Choline Chloride Market - Request Free Sample Report
Choline Chloride Market Dynamics
Drivers
-
Rising demand in animal feed industry which drives market growth.
The increasing food requirement of the rising population is a leading factor propelling the demand for Choline Chloride Market owing to its growing importance in livestock nutrition. Choline chloride is an important feed additive for growth in poultry, swine and ruminant, it promotes fat metabolism, prevents fatty liver syndrome of poultry, potty pig and cow, and improves growth rates. Livestock production is growing in response to increasing global consumption of meat, eggs and dairy products, especially in many emerging economies such as China, India and Brazil. Furthermore, the expansion of government regulations on animal nutrients is bolstering the market demand for Choline Chloride for feedstuff quality and overall animal health. The application of this choline chloride in feed industry is supported by its high demand due to the trend toward producing high-quality protein sources and the growing scale of livestock farming.
Restraint
-
Fluctuating raw material prices which may hamper the market growth.
The high variability in the cost of raw materials presents a major threat to the choline chloride market, given that the bulk of the feedstocks used to produce choline chloride are trimethylamine and ethylene oxide. The prices of crude oil and associated products are a major factor in demand and production, as these raw materials are derived from petrochemical sources; hence, we find that crude oil price, supply chain disruptions and geopolitical uncertainties are the key variables affecting the price of these raw materials. Inflation or currency fluctuations, trade restrictions, or shifting environmental regulations can also affect the cost of production. Manufacturers profit margins can shrink when the prices surge all of a sudden which can drive the prices of the end product up and cause the demand fall. This kind of instability can redirect end-users towards alternative feed additives such as betaine or methionine, which, will ultimately stent the growth of choline chloride market as a whole.
Opportunity
-
Rising demand for sustainable and natural feed additives creates an opportunity in the market.
Sustainable and natural feed additives are gaining traction, and this market trend is seen as highly lucrative for the choline chloride market. As awareness of artificial additives, antibiotic resistance, and environmental sustainability grows, livestock producers are moving toward green and natural feeding options. Consumers have also played a role in this transformation, wanting organic meat, dairy and eggs, thus leading the feed manufacturers to favour plant protein, non-GMO and overall sustainable feed ingredients. Moreover, as regulatory authorities globally are setting and sharpening the rules regarding feed additives, it is becoming essential to employ those which have biodegradable and eco-friendly substitutes. This trend is providing room for growth for bio-based choline chloride by way of biotechnological processes, while positioning it as an essential ingredient in the advancing market for sustainable animal nutrition.
Challenges
-
Supply chain disruptions may create the challenges for the market.
The major hindrance to the growth of the choline chloride market is supply chain disruptions disrupting production and distribution. Geopolitical tensions, trade restrictions, scarcity of raw materials and bottlenecks during transportation could trigger the periodic instability of supply and lifting prices. Because choline chloride is based on important feedstocks such as trimethylamine and ethylene oxide, their availability to manufacturers can be interrupted, slowing age production and causing price fluctuations. Moreover, pandemics, congested ports, and high energy prices have been taxing the global supply chain, challenging the ability for manufacturers to maintain production while meeting rising demand. Such challenges can lead to delayed deliveries of products, increased operational costs, and slow market growth, especially in regions with heavy reliance on imports.
Choline Chloride Market Segmentation Analysis
By Type
Liquid held the largest market share around 52% in 2023. This is due to its high solubility, easier way to incorporate in animal feed formulations and low cost. In the poultry and livestock industries, it is commonly preferred because it promotes consistency in feed, leading to efficient absorption and metabolic exploitation of the nutrients. Liquid choline chloride is more convenient to handle, generates less dust and lowers processing cost than powdered or granular forms, which makes it the most preferred type for feed manufacturers in weighty production rates. Moreover, its stability in the storage plus high compatibility with the automated production systems for feed production fuels its market growth. Liquid choline chloride continues to maintain its stronghold in the market owing to the growing demand for a more efficient and high-performance feed additive in emerging economies.
By Application
Animal feed held the largest market share around 32% in 2023. It is due to the vital role choline plays in livestock metabolism & nutrition. Choline chloride, an essential nutrient for animal fat metabolism, liver function, and nervous system health, is widely used in poultry, swine, ruminants, and aquaculture feed formulations. The global demand for meat, eggs, and dairy products is on the rise, the number of livestock farms also increases, especially in Asia-Pacific, Latin America and Europe regions, which make demands for quality animal feed in high quantity. Besides, the associated government regulations focusing on animal health and production have also propelled the adoption of choline chloride for its incorporation in the feed formulations.
Choline Chloride Market Regional Outlook
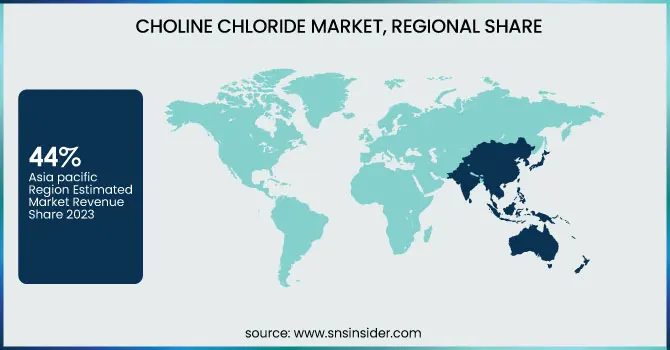
Asia pacific held the largest market share around 44% in 2023. It is due to the rapid growth of the livestock and poultry sector in countries such as China, India, and Indonesia. Population growth, urbanization, and rising affluence have led to strong demand for meat, eggs, and, more recently, dairy products in the region. Furthermore, the government schemes and plans to support animal feed and nutrition has promoted the use of choline chloride in livestock. In addition to an increasing number of major feed manufacturers having a presence in the market, large-scale production facilities reinforce this trajectory. Additionally, the factors such as lower production costs, abundant availability of raw materials, and growing aquaculture industries are driving the choline chloride market growth in the region, thus making Asia Pacific a leading region in choline chloride market.
North America held a significant market share in 2023. It is owing to the growing feed industry and increasing animal meat intake demands of the US and Canadian countries. There is a solid regulatory and policy framework in the region that encourages the use of important supplements and other nutrients in animal feeds so as to increase the viability and productivity of livestock. Moreover, animal nutrition research advancements and the increasing recognition of choline's value in human health and pharmaceuticals have broadened its applications from animal feed. Increase in leading feed manufacturers, well-established supply chains, and technological advancements in production processes of choline chloride are some of the other factors which are expected to create huge market opportunity for choline chloride over the forecast period. increase in demand for dietary supplements and functional food products that contain choline has resulted in a large share of North America in the market.
Get Customized Report as per Your Business Requirement - Enquiry Now
Key Players
-
BASF SE
-
Balchem Corporation
-
Jubilant Life Sciences
-
Taminco Corporation
-
NB Group Co., Ltd.
-
Algry Química, S.L.
-
Impextraco NV
-
Balaji Amines Ltd.
-
Yara International ASA
-
GHW International
-
Havay Chemicals
-
Pestell Minerals & Ingredients Inc.
-
The Global Group
-
A&C Co., Ltd.
-
Global Chemical Co., Ltd.
-
Balchem Italia Srl
-
Liaoning Biochem Co., Ltd.
Recent Development:
-
In March 2024, Eastman secured up to USD 375 million in funding from the U.S. Department of Energy to support its second U.S. molecular recycling project, advancing its sustainability efforts.
-
In March 2023, Balchem established a new choline chloride production facility in St. Gabriel, Louisiana, to meet the rising demand in the animal feed sector and enhance its presence in the North American market.
| Report Attributes | Details |
| Market Size in 2023 | US$ 515.84 Million |
| Market Size by 2032 | US$ 973.61 Million |
| CAGR | CAGR of 6.51% From 2024 to 2032 |
| Base Year | 2023 |
| Forecast Period | 2024-2032 |
| Historical Data | 2020-2022 |
| Report Scope & Coverage | Market Size, Segments Analysis, Competitive Landscape, Regional Analysis, DROC & SWOT Analysis, Forecast Outlook |
| Key Segments | •By Form (Liquid, Powder) •By Application (Oil & Gas, Animal Feed, Human Nutrition, Personal Care, Pharmaceutical, Others) |
| Regional Analysis/Coverage | North America (US, Canada, Mexico), Europe (Eastern Europe [Poland, Romania, Hungary, Turkey, Rest of Eastern Europe] Western Europe] Germany, France, UK, Italy, Spain, Netherlands, Switzerland, Austria, Rest of Western Europe]), Asia Pacific (China, India, Japan, South Korea, Vietnam, Singapore, Australia, Rest of Asia Pacific), Middle East & Africa (Middle East [UAE, Egypt, Saudi Arabia, Qatar, Rest of Middle East], Africa [Nigeria, South Africa, Rest of Africa], Latin America (Brazil, Argentina, Colombia, Rest of Latin America) |
| Company Profiles | BASF SE, Eastman Chemical Company, Balchem Corporation, Jubilant Life Sciences, Kemin Industries, Taminco Corporation, NB Group Co., Ltd., Algry Química, S.L., Impextraco NV, Balaji Amines Ltd., Yara International ASA, GHW International, Havay Chemicals, Pestell Minerals & Ingredients Inc., The Global Group, Chemlock Nutrition Corporation, A&C Co., Ltd., Global Chemical Co., Ltd., Balchem Italia Srl, Liaoning Biochem Co., Ltd. |
