The Chloromethanes Market size was USD 4.62 Billion in 2023 and is expected to reach USD 6.82 Billion by 2032 and grow at a CAGR of 4.41 % over the forecast period of 2024-2032.

To Get more information on Chloromethanes Market - Request Free Sample Report
The report provides a comprehensive analysis of production capacity and utilization by country and type in 2023, along with feedstock availability and pricing trends across regions. It examines the regulatory impact on manufacturing and trade, highlighting key compliance challenges. The report also covers environmental metrics, including emissions data, waste management practices, and sustainability initiatives by region. Additionally, it explores end-use sector demand trends, such as silicones, pharmaceuticals, and agrochemicals, while assessing technological advancements and R&D investments in chloromethane derivatives.
Drivers
Rising demand for silicones in automotive and construction which drives market growth.
The increasing use of silicones in automotive and construction is crucial to boosting the chloromethanes market. Silicones are broadly utilized in automotive applications such as sealants, adhesives, lubricants, and coatings for the enhancement of automotive durability and performance. Silicones are used in the construction sector for high-performance weatherproofing, glazing, and structural applications because of their robust resistance to extreme temperatures and UV light. Chloromethane consumption is directly driven by the rising trend for energy-efficient buildings and lightweight automotive components in the commercial as well as residential sectors with increasing technological advancements. Since the rise of infrastructure projects with more & more automobile production likely to rise, it is expected that the demand for silicones will further extend the presence of chloromethanes in the market as a basic raw material needed.
Restraint
High energy consumption in production which may hamper the market growth.
The significant restraint to growth in the chloromethane production industry is its high energy consumption which may affect the market growth. Industry: The Synthesis Process, which consumes a lot of energy (high electricity and thermal energy in chlorination, distillation, and purification of the material). This means that OPEX does skyrocket, especially in places where energy prices are unstable. The stringent environmental regulations on carbon emissions and energy efficiency also put pressure on manufacturers to implement more expensive sustainable technologies affecting profitability as well. The chloromethanes market is one of the most established chemicals globally, however, alternative chemicals that have lesser the impact on environment are being explored by the various industries, which may act as a restraint in the market in the long range period.
Opportunity
Potential in high-performance insulation materials creates an opportunity in the market.
The increasing need for high-performance insulation materials is expected to be a lucrative opportunity for the chloromethanes market, especially in the construction and refrigeration sectors. Methyl chloride and other chloromethanes are used in the manufacture of silicone coatings and insulation for refrigerators and air conditioning units or for insulating buildings containing such materials for energy conservation purposes. In light of the greater emphasis placed on energy-saving endeavors through the reduction of carbon emissions, governments and industries are turning to technology for advanced insulation solutions to minimize energy use. Moreover, the growing adoption of green building standards and increased energy regulations are promoting the need for improved insulation solutions, which will indirectly fuel the demand for chloromethanes soon. Hence, chloromethanes are set to create many lucrative growth opportunities in the market as several industries search for lightweight, durable, and high-performance insulation solutions.
Challenges
Energy-intensive production processes may challenge the market growth.
The growth of the chloromethanes market is the production processes for chloromethanes which are energy intensive, as they demand high electricity input as well as thermal heat, which increases the operational costs associated with chloromethanes production. Methanol reacts with Chlorine in a continuous and high-pressure system; thus, the reaction requires high energy for heat, cooling, and separation. Due to increasing energy prices and a growing concern for sustainability, energy-efficient technologies have been under pressure to drive demand for manufacturers since 2020 to cut their carbon emissions. Moreover, tighter restrictions related to greenhouse gas emissions and industrial energy consumption further constrain production. While investments in alternative energy sources and process optimizations adopted at necessary scales by the industry may lessen these stresses, the upfront capital investments needed for such transitions can slow market growth.
By Product Type
Methylene Chloride held the largest market share around 52% in 2023. It is extensively used in industrial in-plant applications, primarily as a solvent in adhesive processes, the product was the major chloromethane type driving the chloromethanes market. Being that it is a solvent in paint removers, pharmaceuticals, adhesives, and metal cleaning, this makes it a big player in a variety of industries. This is especially true for the pharmaceutical industry in which methylene chloride is extensively employed, thereby allowing it to prevail through the growing pharmaceutical sector. Also, its application as a blowing agent for various foam manufacturing like insulation, has fueled the demand as it is primarily used in the construction and packaging industry. Although many countries have restricted the use of this toxin due to safety and environmental concerns, controlled-use applications and industrial-grade formulations have contributed to its continued market share over time.
By Application
Pharmaceuticals held the largest market share around 38% in 2023. Methylene chloride is an essential building block in the production of active pharmaceutical ingredients (APIs), tablet coatings, and vitamin synthesis; it is largely irreplaceable to industry, in which methylene chloride plays a critical role. Increased medicines demand coupled with a rising global population, developing prevalence of chronic diseases, and expanding healthcare infrastructure are anticipated to propel demand for chloromethanes. Moreover, the upsurge of contract manufacturing organizations (CMOs) and investment in pharmaceutical R&D will further bolster demand for high-purity solvents. While the regulatory landscape around toxic solvent use has been scrutinized for its toxic and environmental detriments, more recent technological developments in solvent recovery and purification have allowed the pharmaceutical industry to retain its position as the leading consumer of chloromethane.
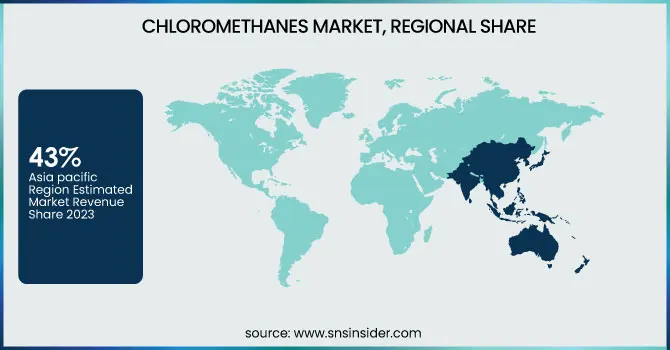
Asia Pacific held the largest market share around 43% in 2023. This is owing to the presence of the largest industrial base in the world coupled with high demand in end-use industries and comparatively cheap availability of chloromethanes in producing countries in the region. The region accounts for significant chemical and pharmaceutical manufacturing centers such as China, India, and Japan, which are expected to witness chloromethane demand due to vast usage in the pharmaceutical, silicone, agrochemical, and foam manufacturing sectors. Apart from this, the region is experiencing a boom in the construction and automotive sectors, thus fuelling the demand for silicones, which are dependent on chloromethanes as key intermediates. In addition, the presence of cost-effective raw materials, favorable governmental policies, and foreign investments for chemical production is further likely to drive up market growth. The existence of several major production plants as well as constant expansions of capacity, carried out by prominent stakeholders in the region is yet another element that has entrenched the position of Asia Pacific in the global chloromethanes market.
North America held a significant market share in 2023. The region is the largest consumer of methylene chloride and chloroform, especially in the pharmaceutical manufacturing, metal cleaning, and foam production sectors. The growth in healthcare and the abrupt rise in R&D spending have, in return, re-inflamed the need for chloromethane in drug composition and laboratory needs. Furthermore, market stability has been driven by the presence of leading chemical manufacturers and technologies that are being developed for eco-friendly production processes. Technological innovations in solvent recovery, as well as regulated-use applications, have attributed to a responsible approach, albeit regulatory restraints in chlorinated solvent sectors have hindered market growth in North America within the past few years.
Get Customized Report as per Your Business Requirement - Enquiry Now
Key Players
AkzoNobel N.V.
Shin-Etsu Chemical Co., Ltd.
Gujarat Alkalies and Chemical Limited
Nouryon
Occidental Petroleum Corporation
INEOS Group
Dow Chemical Company
Tokuyama Corporation
Ercros
Jinling Group
Juhua Chemical
LUXI Chemical
Dongyue
Jiangsu Meilan Chemical
Lee & Man Chemical
Dahai-Group
CHC
Recent Development:
In January 2023, Nouryon acquired a Poland-based company specializing in chelated micronutrients and agricultural solutions. This acquisition aimed to enhance Nouryon's product portfolio in the industry. The move strengthened its position in the specialty chemicals market.
In July 2023, GACL partnered with a European chemical company to announce plans for a new chloromethane production facility in India. This joint venture is aimed at capitalizing on the rapidly expanding market and enhancing their presence in the global supply chain.
| Report Attributes | Details |
| Market Size in 2023 | US$ 4.62 Billion |
| Market Size by 2032 | US$ 6.82 Billion |
| CAGR | CAGR of 4.41 % From 2024 to 2032 |
| Base Year | 2023 |
| Forecast Period | 2024-2032 |
| Historical Data | 2020-2022 |
| Report Scope & Coverage | Market Size, Segments Analysis, Competitive Landscape, Regional Analysis, DROC & SWOT Analysis, Forecast Outlook |
| Key Segments | •By Product Type (Methylene Chloride, Methyl Chloride, Carbon Tetrachloride, Chloroform, Others) •By Application (Silicones Manufacturing, Pharmaceuticals, Foaming Agents, Agrochemicals, Chemical Intermediates, Others) |
| Regional Analysis/Coverage | North America (US, Canada, Mexico), Europe (Eastern Europe [Poland, Romania, Hungary, Turkey, Rest of Eastern Europe] Western Europe] Germany, France, UK, Italy, Spain, Netherlands, Switzerland, Austria, Rest of Western Europe]), Asia Pacific (China, India, Japan, South Korea, Vietnam, Singapore, Australia, Rest of Asia Pacific), Middle East & Africa (Middle East [UAE, Egypt, Saudi Arabia, Qatar, Rest of Middle East], Africa [Nigeria, South Africa, Rest of Africa], Latin America (Brazil, Argentina, Colombia, Rest of Latin America) |
| Company Profiles | AGC Inc., AkzoNobel N.V., Shin-Etsu Chemical Co., Ltd., Gujarat Alkalies and Chemical Limited, Nouryon, Occidental Petroleum Corporation, KEM ONE, INEOS Group, Dow Chemical Company, Tokuyama Corporation, SRF Limited, Ercros, Jinling Group, Juhua Chemical, LUXI Chemical, Dongyue, Jiangsu Meilan Chemical, Lee & Man Chemical, Dahai-Group, CHC |
Ans: The Chloromethanes Market was valued at USD 4.62 Billion in 2023.
Ans: The expected CAGR of the global Chloromethanes Market during the forecast period is 4.41%
Ans: Methylene Chloride will grow rapidly in the Chloromethanes Market from 2024-2032.
Ans: Rising demand for silicones in automotive and construction drives market growth.
Ans: Asia Pacific led the Chloromethanes Market in the region with the highest revenue share in 2023.
Table of Contents:
1. Introduction
1.1 Market Definition
1.2 Scope (Inclusion and Exclusions)
1.3 Research Assumptions
2. Executive Summary
2.1 Market Overview
2.2 Regional Synopsis
2.3 Competitive Summary
3. Research Methodology
3.1 Top-Down Approach
3.2 Bottom-up Approach
3.3. Data Validation
3.4 Primary Interviews
4. Market Dynamics Impact Analysis
4.1 Market Driving Factors Analysis
4.1.2 Drivers
4.1.2 Restraints
4.1.3 Opportunities
4.1.4 Challenges
4.2 PESTLE Analysis
4.3 Porter’s Five Forces Model
5. Statistical Insights and Trends Reporting
5.1 Production Capacity and Utilization, by Country, By Type, 2023
5.2 Feedstock Prices, by Country, By Type, 2023
5.3 Regulatory Impact, by Country, By Type 2023.
5.4 Environmental Metrics: Emissions Data, Waste Management Practices, and Sustainability Initiatives, by Region
5.5 Innovation and R&D, Type, 2023
6. Competitive Landscape
6.1 List of Major Companies, By Region
6.2 Market Share Analysis, By Region
6.3 Product Benchmarking
6.3.1 Product specifications and features
6.3.2 Pricing
6.4 Strategic Initiatives
6.4.1 Marketing and promotional activities
6.4.2 Distribution and Supply Chain Strategies
6.4.3 Expansion Plans and New Product Launches
6.4.4 Strategic partnerships and collaborations
6.5 Technological Advancements
6.6 Market Positioning and Branding
7. Chloromethanes Market Segmentation, By Product Type
7.1 Chapter Overview
7.2 Methylene Chloride
7.2.1 Methylene Chloride Trends Analysis (2020-2032)
7.2.2 Methylene Chloride Market Size Estimates and Forecasts to 2032 (USD Billion)
7.3 Methyl Chloride
7.3.1 Methyl Chloride Market Trends Analysis (2020-2032)
7.3.2 Methyl Chloride Market Size Estimates and Forecasts to 2032 (USD Billion)
7.4 Carbon Tetrachloride
7.4.1 Carbon Tetrachloride Trends Analysis (2020-2032)
7.4.2 Carbon Tetrachloride Market Size Estimates and Forecasts to 2032 (USD Billion)
7.5 Chloroform
7.5.1 Chloroform Market Trends Analysis (2020-2032)
7.5.2 Chloroform Market Size Estimates and Forecasts to 2032 (USD Billion)
7.6 Others
7.6.1 Others Market Trends Analysis (2020-2032)
7.6.2 Others Market Size Estimates and Forecasts to 2032 (USD Billion)
8. Chloromethanes Market Segmentation, by Application
8.1 Chapter Overview
8.2 Silicones Manufacturing
8.2.1 Silicones Manufacturing Market Trends Analysis (2020-2032)
8.2.2 Silicones Manufacturing Market Size Estimates and Forecasts to 2032 (USD Billion)
8.3 Pharmaceuticals
8.3.1 Pharmaceuticals Market Trends Analysis (2020-2032)
8.3.2 Pharmaceuticals Market Size Estimates and Forecasts to 2032 (USD Billion)
8.4 Foaming Agents
8.4.1 Foaming Agents Market Trends Analysis (2020-2032)
8.4.2 Foaming Agents Market Size Estimates and Forecasts to 2032 (USD Billion)
8.5 Agrochemicals
8.5.1 Agrochemicals Market Trends Analysis (2020-2032)
8.5.2 Agrochemicals Market Size Estimates and Forecasts to 2032 (USD Billion)
8.6 Chemical Intermediates
8.6.1 Chemical Intermediates Market Trends Analysis (2020-2032)
8.6.2 Chemical Intermediates Market Size Estimates and Forecasts to 2032 (USD Billion)
8.6 Others
8.6.1 Others Market Trends Analysis (2020-2032)
8.6.2 Others Market Size Estimates and Forecasts to 2032 (USD Billion)
9. Regional Analysis
9.1 Chapter Overview
9.2 North America
9.2.1 Trends Analysis
9.2.2 North America Chloromethanes Market Estimates and Forecasts, by Country (2020-2032) (USD Billion)
9.2.3 North America Chloromethanes Market Estimates and Forecasts, By Product Type (2020-2032) (USD Billion)
9.2.4 North America Chloromethanes Market Estimates and Forecasts, by Application (2020-2032) (USD Billion)
9.2.5 USA
9.2.5.1 USA Chloromethanes Market Estimates and Forecasts, By Product Type (2020-2032) (USD Billion)
9.2.5.2 USA Chloromethanes Market Estimates and Forecasts, by Application (2020-2032) (USD Billion)
9.2.6 Canada
9.2.6.1 Canada Chloromethanes Market Estimates and Forecasts, By Product Type (2020-2032) (USD Billion)
9.2.6.2 Canada Chloromethanes Market Estimates and Forecasts, by Application (2020-2032) (USD Billion)
9.2.7 Mexico
9.2.7.1 Mexico Chloromethanes Market Estimates and Forecasts, By Product Type (2020-2032) (USD Billion)
9.2.7.2 Mexico Chloromethanes Market Estimates and Forecasts, by Application (2020-2032) (USD Billion)
9.3 Europe
9.3.1 Eastern Europe
9.3.1.1 Trends Analysis
9.3.1.2 Eastern Europe Chloromethanes Market Estimates and Forecasts, by Country (2020-2032) (USD Billion)
9.3.1.3 Eastern Europe Chloromethanes Market Estimates and Forecasts, By Product Type (2020-2032) (USD Billion)
9.3.1.4 Eastern Europe Chloromethanes Market Estimates and Forecasts, by Application (2020-2032) (USD Billion)
9.3.1.5 Poland
9.3.1.5.1 Poland Chloromethanes Market Estimates and Forecasts, By Product Type (2020-2032) (USD Billion)
9.3.1.5.2 Poland Chloromethanes Market Estimates and Forecasts, by Application (2020-2032) (USD Billion)
9.3.1.6 Romania
9.3.1.6.1 Romania Chloromethanes Market Estimates and Forecasts, By Product Type (2020-2032) (USD Billion)
9.3.1.6.2 Romania Chloromethanes Market Estimates and Forecasts, by Application (2020-2032) (USD Billion)
9.3.1.7 Hungary
9.3.1.7.1 Hungary Chloromethanes Market Estimates and Forecasts, By Product Type (2020-2032) (USD Billion)
9.3.1.7.2 Hungary Chloromethanes Market Estimates and Forecasts, by Application (2020-2032) (USD Billion)
9.3.1.8 Turkey
9.3.1.8.1 Turkey Chloromethanes Market Estimates and Forecasts, By Product Type (2020-2032) (USD Billion)
9.3.1.8.2 Turkey Chloromethanes Market Estimates and Forecasts, by Application (2020-2032) (USD Billion)
9.3.1.9 Rest of Eastern Europe
9.3.1.9.1 Rest of Eastern Europe Chloromethanes Market Estimates and Forecasts, By Product Type (2020-2032) (USD Billion)
9.3.1.9.2 Rest of Eastern Europe Chloromethanes Market Estimates and Forecasts, by Application (2020-2032) (USD Billion)
9.3.2 Western Europe
9.3.2.1 Trends Analysis
9.3.2.2 Western Europe Chloromethanes Market Estimates and Forecasts, by Country (2020-2032) (USD Billion)
9.3.2.3 Western Europe Chloromethanes Market Estimates and Forecasts, By Product Type (2020-2032) (USD Billion)
9.3.2.4 Western Europe Chloromethanes Market Estimates and Forecasts, by Application (2020-2032) (USD Billion)
9.3.2.5 Germany
9.3.2.5.1 Germany Chloromethanes Market Estimates and Forecasts, By Product Type (2020-2032) (USD Billion)
9.3.2.5.2 Germany Chloromethanes Market Estimates and Forecasts, by Application (2020-2032) (USD Billion)
9.3.2.6 France
9.3.2.6.1 France Chloromethanes Market Estimates and Forecasts, By Product Type (2020-2032) (USD Billion)
9.3.2.6.2 France Chloromethanes Market Estimates and Forecasts, by Application (2020-2032) (USD Billion)
9.3.2.7 UK
9.3.2.7.1 UK Chloromethanes Market Estimates and Forecasts, By Product Type (2020-2032) (USD Billion)
9.3.2.7.2 UK Chloromethanes Market Estimates and Forecasts, by Application (2020-2032) (USD Billion)
9.3.2.8 Italy
9.3.2.8.1 Italy Chloromethanes Market Estimates and Forecasts, By Product Type (2020-2032) (USD Billion)
9.3.2.8.2 Italy Chloromethanes Market Estimates and Forecasts, by Application (2020-2032) (USD Billion)
9.3.2.9 Spain
9.3.2.9.1 Spain Chloromethanes Market Estimates and Forecasts, By Product Type (2020-2032) (USD Billion)
9.3.2.9.2 Spain Chloromethanes Market Estimates and Forecasts, by Application (2020-2032) (USD Billion)
9.3.2.10 Netherlands
9.3.2.10.1 Netherlands Chloromethanes Market Estimates and Forecasts, By Product Type (2020-2032) (USD Billion)
9.3.2.10.2 Netherlands Chloromethanes Market Estimates and Forecasts, by Application (2020-2032) (USD Billion)
9.3.2.11 Switzerland
9.3.2.11.1 Switzerland Chloromethanes Market Estimates and Forecasts, By Product Type (2020-2032) (USD Billion)
9.3.2.11.2 Switzerland Chloromethanes Market Estimates and Forecasts, by Application (2020-2032) (USD Billion)
9.3.2.12 Austria
9.3.2.12.1 Austria Chloromethanes Market Estimates and Forecasts, By Product Type (2020-2032) (USD Billion)
9.3.2.12.2 Austria Chloromethanes Market Estimates and Forecasts, by Application (2020-2032) (USD Billion)
9.3.2.13 Rest of Western Europe
9.3.2.13.1 Rest of Western Europe Chloromethanes Market Estimates and Forecasts, By Product Type (2020-2032) (USD Billion)
9.3.2.13.2 Rest of Western Europe Chloromethanes Market Estimates and Forecasts, by Application (2020-2032) (USD Billion)
9.4 Asia Pacific
9.4.1 Trends Analysis
9.4.2 Asia Pacific Chloromethanes Market Estimates and Forecasts, by Country (2020-2032) (USD Billion)
9.4.3 Asia Pacific Chloromethanes Market Estimates and Forecasts, By Product Type (2020-2032) (USD Billion)
9.4.4 Asia Pacific Chloromethanes Market Estimates and Forecasts, by Application (2020-2032) (USD Billion)
9.4.5 China
9.4.5.1 China Chloromethanes Market Estimates and Forecasts, By Product Type (2020-2032) (USD Billion)
9.4.5.2 China Chloromethanes Market Estimates and Forecasts, by Application (2020-2032) (USD Billion)
9.4.6 India
9.4.5.1 India Chloromethanes Market Estimates and Forecasts, By Product Type (2020-2032) (USD Billion)
9.4.5.2 India Chloromethanes Market Estimates and Forecasts, by Application (2020-2032) (USD Billion)
9.4.5 Japan
9.4.5.1 Japan Chloromethanes Market Estimates and Forecasts, By Product Type (2020-2032) (USD Billion)
9.4.5.2 Japan Chloromethanes Market Estimates and Forecasts, by Application (2020-2032) (USD Billion)
9.4.6 South Korea
9.4.6.1 South Korea Chloromethanes Market Estimates and Forecasts, By Product Type (2020-2032) (USD Billion)
9.4.6.2 South Korea Chloromethanes Market Estimates and Forecasts, by Application (2020-2032) (USD Billion)
9.4.7 Vietnam
9.4.7.1 Vietnam Chloromethanes Market Estimates and Forecasts, By Product Type (2020-2032) (USD Billion)
9.2.7.2 Vietnam Chloromethanes Market Estimates and Forecasts, by Application (2020-2032) (USD Billion)
9.4.8 Singapore
9.4.8.1 Singapore Chloromethanes Market Estimates and Forecasts, By Product Type (2020-2032) (USD Billion)
9.4.8.2 Singapore Chloromethanes Market Estimates and Forecasts, by Application (2020-2032) (USD Billion)
9.4.9 Australia
9.4.9.1 Australia Chloromethanes Market Estimates and Forecasts, By Product Type (2020-2032) (USD Billion)
9.4.9.2 Australia Chloromethanes Market Estimates and Forecasts, by Application (2020-2032) (USD Billion)
9.4.10 Rest of Asia Pacific
9.4.10.1 Rest of Asia Pacific Chloromethanes Market Estimates and Forecasts, By Product Type (2020-2032) (USD Billion)
9.4.10.2 Rest of Asia Pacific Chloromethanes Market Estimates and Forecasts, by Application (2020-2032) (USD Billion)
9.5 Middle East and Africa
9.5.1 Middle East
9.5.1.1 Trends Analysis
9.5.1.2 Middle East Chloromethanes Market Estimates and Forecasts, by Country (2020-2032) (USD Billion)
9.5.1.3 Middle East Chloromethanes Market Estimates and Forecasts, By Product Type (2020-2032) (USD Billion)
9.5.1.4 Middle East Chloromethanes Market Estimates and Forecasts, by Application (2020-2032) (USD Billion)
9.5.1.5 UAE
9.5.1.5.1 UAE Chloromethanes Market Estimates and Forecasts, By Product Type (2020-2032) (USD Billion)
9.5.1.5.2 UAE Chloromethanes Market Estimates and Forecasts, by Application (2020-2032) (USD Billion)
9.5.1.6 Egypt
9.5.1.6.1 Egypt Chloromethanes Market Estimates and Forecasts, By Product Type (2020-2032) (USD Billion)
9.5.1.6.2 Egypt Chloromethanes Market Estimates and Forecasts, by Application (2020-2032) (USD Billion)
9.5.1.7 Saudi Arabia
9.5.1.7.1 Saudi Arabia Chloromethanes Market Estimates and Forecasts, By Product Type (2020-2032) (USD Billion)
9.5.1.7.2 Saudi Arabia Chloromethanes Market Estimates and Forecasts, by Application (2020-2032) (USD Billion)
9.5.1.8 Qatar
9.5.1.8.1 Qatar Chloromethanes Market Estimates and Forecasts, By Product Type (2020-2032) (USD Billion)
9.5.1.8.2 Qatar Chloromethanes Market Estimates and Forecasts, by Application (2020-2032) (USD Billion)
9.5.1.9 Rest of Middle East
9.5.1.9.1 Rest of Middle East Chloromethanes Market Estimates and Forecasts, By Product Type (2020-2032) (USD Billion)
9.5.1.9.2 Rest of Middle East Chloromethanes Market Estimates and Forecasts, by Application (2020-2032) (USD Billion)
9.5.2 Africa
9.5.2.1 Trends Analysis
9.5.2.2 Africa Chloromethanes Market Estimates and Forecasts, by Country (2020-2032) (USD Billion)
9.5.2.3 Africa Chloromethanes Market Estimates and Forecasts, By Product Type (2020-2032) (USD Billion)
9.5.2.4 Africa Chloromethanes Market Estimates and Forecasts, by Application (2020-2032) (USD Billion)
9.5.2.5 South Africa
9.5.2.5.1 South Africa Chloromethanes Market Estimates and Forecasts, By Product Type (2020-2032) (USD Billion)
9.5.2.5.2 South Africa Chloromethanes Market Estimates and Forecasts, by Application (2020-2032) (USD Billion)
9.5.2.6 Nigeria
9.5.2.6.1 Nigeria Chloromethanes Market Estimates and Forecasts, By Product Type (2020-2032) (USD Billion)
9.5.2.6.2 Nigeria Chloromethanes Market Estimates and Forecasts, by Application (2020-2032) (USD Billion)
9.6 Latin America
9.6.1 Trends Analysis
9.6.2 Latin America Chloromethanes Market Estimates and Forecasts, by Country (2020-2032) (USD Billion)
9.6.3 Latin America Chloromethanes Market Estimates and Forecasts, By Product Type (2020-2032) (USD Billion)
9.6.4 Latin America Chloromethanes Market Estimates and Forecasts, by Application (2020-2032) (USD Billion)
9.6.5 Brazil
9.6.5.1 Brazil Chloromethanes Market Estimates and Forecasts, By Product Type (2020-2032) (USD Billion)
9.6.5.2 Brazil Chloromethanes Market Estimates and Forecasts, by Application (2020-2032) (USD Billion)
9.6.6 Argentina
9.6.6.1 Argentina Chloromethanes Market Estimates and Forecasts, By Product Type (2020-2032) (USD Billion)
9.6.6.2 Argentina Chloromethanes Market Estimates and Forecasts, by Application (2020-2032) (USD Billion)
9.6.7 Colombia
9.6.7.1 Colombia Chloromethanes Market Estimates and Forecasts, By Product Type (2020-2032) (USD Billion)
9.6.7.2 Colombia Chloromethanes Market Estimates and Forecasts, by Application (2020-2032) (USD Billion)
9.6.8 Rest of Latin America
9.6.8.1 Rest of Latin America Chloromethanes Market Estimates and Forecasts, By Product Type (2020-2032) (USD Billion)
9.6.8.2 Rest of Latin America Chloromethanes Market Estimates and Forecasts, by Application (2020-2032) (USD Billion)
10. Company Profiles
10.1 AGC Inc.
10.1.1 Company Overview
10.1.2 Financial
10.1.3 Product / Services Offered
10.1.4 SWOT Analysis
10.2 AkzoNobel N.V.
10.2.1 Company Overview
10.2.2 Financial
10.2.3 Product/ Services Offered
10.2.4 SWOT Analysis
10.3 Shin-Etsu Chemical Co., Ltd.
10.3.1 Company Overview
10.3.2 Financial
10.3.3 Product/ Services Offered
10.3.4 SWOT Analysis
10.4 Gujarat Alkalies and Chemical Limited
10.4.1 Company Overview
10.4.2 Financial
10.4.3 Product/ Services Offered
10.4.4 SWOT Analysis
10.5 Nouryon
10.5.1 Company Overview
10.5.2 Financial
10.5.3 Product/ Services Offered
10.5.4 SWOT Analysis
10.6 Occidental Petroleum Corporation
10.6.1 Company Overview
10.6.2 Financial
10.6.3 Product/ Services Offered
10.6.4 SWOT Analysis
10.7 Dow Chemical Company
10.7.1 Company Overview
10.7.2 Financial
10.7.3 Product/ Services Offered
10.7.4 SWOT Analysis
10.8 Tokuyama Corporation
10.8.1 Company Overview
10.8.2 Financial
10.8.3 Product/ Services Offered
10.8.4 SWOT Analysis
10.9 Juhua Chemical
10.9.1 Company Overview
10.9.2 Financial
10.9.3 Product/ Services Offered
10.9.4 SWOT Analysis
10.10 SRF Limited
10.10.1 Company Overview
10.10.2 Financial
10.10.3 Product/ Services Offered
10.10.4 SWOT Analysis
11. Use Cases and Best Practices
12. Conclusion
An accurate research report requires proper strategizing as well as implementation. There are multiple factors involved in the completion of good and accurate research report and selecting the best methodology to compete the research is the toughest part. Since the research reports we provide play a crucial role in any company’s decision-making process, therefore we at SNS Insider always believe that we should choose the best method which gives us results closer to reality. This allows us to reach at a stage wherein we can provide our clients best and accurate investment to output ratio.
Each report that we prepare takes a timeframe of 350-400 business hours for production. Starting from the selection of titles through a couple of in-depth brain storming session to the final QC process before uploading our titles on our website we dedicate around 350 working hours. The titles are selected based on their current market cap and the foreseen CAGR and growth.
The 5 steps process:
Step 1: Secondary Research:
Secondary Research or Desk Research is as the name suggests is a research process wherein, we collect data through the readily available information. In this process we use various paid and unpaid databases which our team has access to and gather data through the same. This includes examining of listed companies’ annual reports, Journals, SEC filling etc. Apart from this our team has access to various associations across the globe across different industries. Lastly, we have exchange relationships with various university as well as individual libraries.

Step 2: Primary Research
When we talk about primary research, it is a type of study in which the researchers collect relevant data samples directly, rather than relying on previously collected data. This type of research is focused on gaining content specific facts that can be sued to solve specific problems. Since the collected data is fresh and first hand therefore it makes the study more accurate and genuine.
We at SNS Insider have divided Primary Research into 2 parts.
Part 1 wherein we interview the KOLs of major players as well as the upcoming ones across various geographic regions. This allows us to have their view over the market scenario and acts as an important tool to come closer to the accurate market numbers. As many as 45 paid and unpaid primary interviews are taken from both the demand and supply side of the industry to make sure we land at an accurate judgement and analysis of the market.
This step involves the triangulation of data wherein our team analyses the interview transcripts, online survey responses and observation of on filed participants. The below mentioned chart should give a better understanding of the part 1 of the primary interview.

Part 2: In this part of primary research the data collected via secondary research and the part 1 of the primary research is validated with the interviews from individual consultants and subject matter experts.
Consultants are those set of people who have at least 12 years of experience and expertise within the industry whereas Subject Matter Experts are those with at least 15 years of experience behind their back within the same space. The data with the help of two main processes i.e., FGDs (Focused Group Discussions) and IDs (Individual Discussions). This gives us a 3rd party nonbiased primary view of the market scenario making it a more dependable one while collation of the data pointers.
Step 3: Data Bank Validation
Once all the information is collected via primary and secondary sources, we run that information for data validation. At our intelligence centre our research heads track a lot of information related to the market which includes the quarterly reports, the daily stock prices, and other relevant information. Our data bank server gets updated every fortnight and that is how the information which we collected using our primary and secondary information is revalidated in real time.

Step 4: QA/QC Process
After all the data collection and validation our team does a final level of quality check and quality assurance to get rid of any unwanted or undesired mistakes. This might include but not limited to getting rid of the any typos, duplication of numbers or missing of any important information. The people involved in this process include technical content writers, research heads and graphics people. Once this process is completed the title gets uploader on our platform for our clients to read it.
Step 5: Final QC/QA Process:
This is the last process and comes when the client has ordered the study. In this process a final QA/QC is done before the study is emailed to the client. Since we believe in giving our clients a good experience of our research studies, therefore, to make sure that we do not lack at our end in any way humanly possible we do a final round of quality check and then dispatch the study to the client.
Key Segments:
By Product Type
Methylene Chloride
Methyl Chloride
Carbon Tetrachloride
Chloroform
Others
By Application
Silicones Manufacturing
Pharmaceuticals
Foaming Agents
Agrochemicals
Chemical Intermediates
Others
Request for Segment Customization as per your Business Requirement: Segment Customization Request
Regional Coverage:
North America
US
Canada
Mexico
Europe
Eastern Europe
Poland
Romania
Hungary
Turkey
Rest of Eastern Europe
Western Europe
Germany
France
UK
Italy
Spain
Netherlands
Switzerland
Austria
Rest of Western Europe
Asia Pacific
China
India
Japan
South Korea
Vietnam
Singapore
Australia
Rest of Asia Pacific
Middle East & Africa
Middle East
UAE
Egypt
Saudi Arabia
Qatar
Rest of Middle East
Africa
Nigeria
South Africa
Rest of Africa
Latin America
Brazil
Argentina
Colombia
Rest of Latin America
Request for Country Level Research Report: Country Level Customization Request
Available Customization
With the given market data, SNS Insider offers customization as per the company’s specific needs. The following customization options are available for the report:
Detailed Volume Analysis
Criss-Cross segment analysis (e.g. Product X Application)
Competitive Product Benchmarking
Geographic Analysis
Additional countries in any of the regions
Customized Data Representation
Detailed analysis and profiling of additional market players
Fluoropolymers Market size was estimated at USD 9.66 billion in 2023 and is expected to reach USD 16.20 billion by 2032 at a CAGR of 5.91% from 2024-2032.
The Ceramic Matrix Composites Market Size was valued at USD 9.6 Billion in 2023. It is expected to grow to USD 23.8 Billion by 2032 and grow at a CAGR of 10.7% over the forecast period of 2024-2032.
Elastomers Market size was USD 97.80 billion in 2023 and is expected to reach USD 147.35 billion by 2032, growing at a CAGR of 4.23% from 2024 to 2032.
The BOPP Films Market size was USD 24.8 billion in 2023 and is expected to reach USD 41.1 billion by 2032 and grow at a CAGR of 5.8% over the forecast period of 2024-2032.
Optical Coating Market was valued at USD 15.63 Billion in 2023 and is expected to reach USD 26.90 Billion by 2032, growing at a CAGR of 6.22% from 2024-2032.
The Asphalt Market size was valued at USD 249.2 million in 2023. It is expected to grow to USD 389.9 million by 2032 and grow at a CAGR of 5.1% by 2024-2032.

Hi! Click one of our member below to chat on Phone
© 2025 All Rights Reserved by SNS Insider Pvt Ltd


