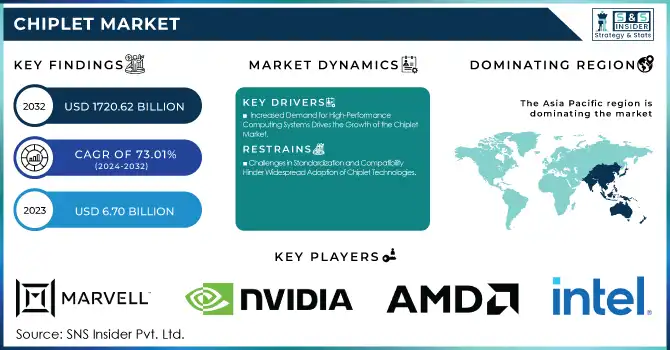
The Chiplet Market Size was valued at USD 6.70 Billion in 2023 and is expected to reach USD 1720.62 Billion by 2032 and grow at a CAGR of 73.01% over the forecast period 2024-2032.
To get more information on Chiplet Market - Request Free Sample Report
The Chiplet market is witnessing significant growth, fueled by the increasing complexity of semiconductor devices, the demand for more efficient and high-performance computing systems, and innovations in manufacturing technologies. Chiplets, which are small, modular chips that can be combined to form a complete semiconductor package, are revolutionizing the traditional approach to chip design and manufacturing. This modular approach allows manufacturers to mix and match various types of chiplets, such as processing cores, memory, or I/O interfaces, to create customized solutions that offer enhanced performance, reduced costs, and faster time-to-market.
The U.S. government has recognized the strategic importance of chiplet technology in bolstering the nation's semiconductor industry. In August 2023, US signed the CHIPS and Science Act into law, allocating USD 50 billion to enhance domestic semiconductor research, development, and manufacturing. This includes USD 39 billion in direct financial assistance for constructing and expanding semiconductor fabrication facilities, assembly, testing, advanced packaging, and R&D.
The act also designates USD 11 billion to establish 20 geographically distributed regional technology hubs, focusing on technology development, job creation, and expanding U.S. innovation capacity. Additionally, USD 10 billion is allocated to the National Institute of Standards and Technology (NIST) to support critical technological research and strengthen small manufacturers through the Hollings Manufacturing Extension Partnership (MEP).
Key Drivers:
Increased Demand for High-Performance Computing Systems Drives the Growth of the Chiplet Market
The growing need for high-performance computing (HPC) across various industries, such as artificial intelligence (AI), machine learning, and data analytics, is significantly driving the chiplet market. With the rise of data-heavy applications and advanced technologies, including cloud computing, gaming, and autonomous vehicles, the demand for faster, more efficient semiconductor solutions has surged. Traditional monolithic chip designs struggle to keep up with these requirements due to limitations in performance and scalability.
Chiplets offer an innovative solution by enabling the integration of different specialized modules (such as processing cores, memory, and I/O) into a single package. This modular approach allows manufacturers to create tailored solutions that provide optimized performance for specific applications, ensuring that the chips meet the needs of high-performance systems.
Additionally, chiplets facilitate better heat dissipation, lower power consumption, and improved bandwidth compared to traditional chips. As industries continue to embrace HPC for real-time data processing and complex calculations, the adoption of chiplet-based architectures is expected to increase, thus fostering further market growth.
Cost-Effectiveness and Time-to-Market Efficiency Fueling Chiplet Market Expansion
The increasing pressure on semiconductor companies to reduce development costs while speeding up product launches has made chiplet-based solutions highly attractive. Unlike traditional monolithic chips, which require significant R&D investment and time for development, chiplet-based designs offer a more flexible and cost-effective approach. Since chiplets are pre-designed modules, manufacturers can combine and recombine them in various configurations, eliminating the need to design new chips from scratch. This modular approach allows for faster prototyping, quicker integration into devices, and reduced development costs. Additionally, as the semiconductor industry faces increasing cost pressures, the ability to reuse pre-existing chiplets instead of designing bespoke monolithic chips from the ground up is seen as an economical solution. The scalability of chiplets also contributes to reducing time-to-market, as they allow manufacturers to launch new products quickly and efficiently, staying competitive in fast-paced markets such as consumer electronics, automotive, and telecommunications. This cost-effectiveness and time-to-market advantage is a key driver for the growing adoption of chiplets, further propelling market expansion.
Restrain:
Challenges in Standardization and Compatibility Hinder Widespread Adoption of Chiplet Technologies
The chiplet market is still in its early stages, and many companies are developing their own proprietary technologies, which can create difficulties when integrating different chiplets into a unified package. Without industry-wide standards for chiplet interfaces, interconnects, and packaging, interoperability becomes a significant concern, particularly in sectors that demand seamless integration, such as telecommunications, data centers, and consumer electronics.
This lack of standardization not only complicates the design process but also increases the risk of compatibility issues, raising costs for manufacturers and potentially delaying product development. Additionally, ensuring high-quality performance across multiple chiplets with different configurations can be challenging, leading to concerns about reliability and performance consistency. While there are ongoing efforts by industry leaders to create standardized frameworks for chiplet integration, until these standards are fully developed and adopted, the pace of chiplet market growth may be hindered.
By End-use Application
In 2023, the automotive segment holds the largest revenue share of 32.00% in the chiplet market, driven by the increasing integration of advanced semiconductor technologies in modern vehicles. As automotive companies move towards electric vehicles (EVs), autonomous driving systems, and enhanced connectivity, the demand for high-performance, reliable, and energy-efficient chips has skyrocketed. Chiplet are particularly valuable in the automotive sector due to their modularity, allowing automakers to integrate specialized chiplet for processing, memory, and I/O in a single package.
For instance, companies like Intel and AMD have been developing chipset-based solutions aimed at improving the performance of in-vehicle infotainment systems, autonomous navigation, and advanced driver-assistance systems (ADAS).
The enterprise electronics segment is experiencing the largest CAGR at 75.47% within the forecasted period, driven by the increasing demand for efficient and scalable computing solutions in data centers, cloud computing, and networking. As enterprise systems handle more data and complex workloads, there is an increasing need for high-performance chips that are both energy-efficient and cost-effective. Chiplets provide an ideal solution by allowing enterprise electronics manufacturers to use specialized chiplets optimized for specific tasks such as memory, processing, and interconnects.
By Processor
The Central Processing Unit (CPU) segment dominates the chiplet market with a significant 44.00% revenue share in 2023. CPUs are the heart of computing systems, and as demand for faster, more energy-efficient processors increase across various sectors, including enterprise electronics, automotive, and consumer electronics, chiplet-based designs have gained traction. Chiplets provide modularity and scalability, allowing manufacturers to integrate specialized processing units, memory, and I/O interfaces into a single CPU package.
For example, AMD's EPYC processors and Intel's Xeon chips use chiplet architectures, enabling more efficient multi-core processing and better system performance in data centers and enterprise applications.
The Graphics Processing Unit (GPU) segment is poised for the largest CAGR of 76.55% during the forecasted period, driven by the increasing demand for GPUs in applications such as gaming, artificial intelligence (AI), machine learning, and high-performance computing. GPUs are particularly well-suited for parallel processing tasks, and with the rising adoption of AI and deep learning models, the need for powerful and efficient GPUs is growing exponentially.
For example, NVIDIA's launch of the A100 Tensor Core GPUs incorporates chiplet technology to deliver enhanced AI processing capabilities, while AMD's RDNA 2 architecture is designed with chiplets to improve performance and efficiency in gaming and computing environments.
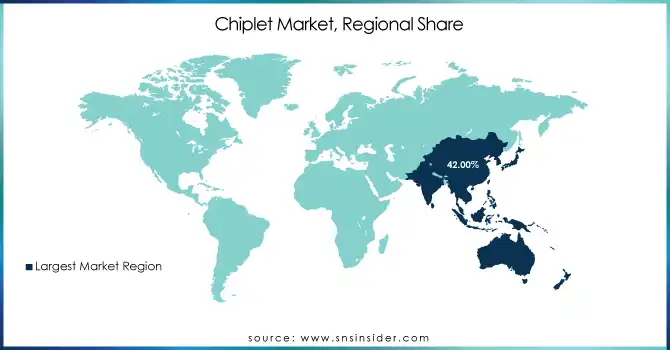
In 2023, the Asia Pacific region hold the largest share of the chiplet market, with an estimated market share of approximately 42.00%. This dominance is attributed to the region's established semiconductor manufacturing infrastructure, the presence of major chip manufacturers, and the rapid growth of industries such as consumer electronics, automotive, and telecommunications.
For example, TSMC is advancing chiplet-based designs through its advanced 3D packaging and heterogeneous integration technologies, which enable the efficient integration of different chiplets within a single device.
Furthermore, the growth of semiconductor-related R&D in the region, alongside government initiatives supporting the development of advanced semiconductor technologies, solidifies Asia Pacific's leading position in the chiplet market.
North America is the fastest-growing region in the chiplet market, with an estimated CAGR of around 74.95% in 2023. This growth is driven by the increasing adoption of chiplet-based solutions across various sectors, including data centers, high-performance computing, automotive, and consumer electronics. The U.S. government's initiatives, such as the CHIPS and Science Act, which allocates USD 50 billion to boost semiconductor manufacturing and R&D in the country, have played a crucial role in accelerating the adoption of chiplets.
For instance, Intel has been pioneering in integrating chiplets into its latest processor designs, such as the Intel Core and Xeon chips. NVIDIA's GPUs also utilize chiplet architectures to enhance AI and machine learning performance.
Get Customized Report as per Your Business Requirement - Enquiry Now
Key Players
Some of the major players in the Chiplet Market are:
Intel Corporation (Intel Core Processors, Intel Optane Memory)
Advanced Micro Devices, Inc. (AMD Ryzen Processors, AMD Radeon Graphics)
Apple Inc. (iPhone, MacBook Pro)
IBM (IBM Cloud, IBM Watson)
Marvell (Marvell ThunderX2, Marvell 8000 Series)
MediaTek Inc. (MediaTek Dimensity, MediaTek Helio)
NVIDIA Corporation (NVIDIA GeForce, NVIDIA Tesla)
Achronix Semiconductor Corporation (Speedster7t FPGAs, Speedster 22i FPGAs)
Ranovus (LightChip 2, Photonic Interconnect)
Netronome (Agilio CX, Agilio FLX)
Cadence Design Systems, Inc. (Virtuoso, Allegro)
SiFive, Inc. (SiFive Freedom, SiFive Performance)
ALPHAWAVE SEMI (Quantum, AlphaWaves Interconnect)
Eliyan (Eliyan Vision, Eliyan Cloud)
Ayar Labs, Inc. (TeraPHY, Optical Interconnects)
Tachyum (Prodigy Processor, Tachyum Cloud)
X-Celeprint (X-Celeprint Chip, X-Celeprint Platform)
Kandou Bus SA (Kandou Phy, Kandou Clock)
NHanced Semiconductors (NHanced XLR, NHanced DSP)
Tenstorrent (Tenstorrent Processor, Tenstorrent AI)
In March 2024, NVIDIA introduced the Blackwell platform, designed to power a new era of computing, particularly for real-time generative AI. With six transformative technologies, Blackwell enhances AI model scaling, reducing operating costs and energy consumption by up to 25x. Its new GPU architecture, including advanced features like the second-generation Transformer Engine and fifth-generation NVLink, supports AI workloads, quantum computing, and large-scale data processing.
In August 2023, Google Cloud and NVIDIA collaborated to enhance AI infrastructure, enabling the deployment of large generative AI models and accelerating data science tasks. Their partnership integrates NVIDIA-powered solutions for Google Cloud, optimizing PaxML and supporting scalability with H100 and A100 GPUs.
In June 2023, Intel partnered with Taiwan Semiconductor Manufacturing Company (TSMC) to manufacture chips for Intel's high-performance computing and graphics products, aiming to reduce Intel's dependence on external foundries.
| Report Attributes | Details |
|---|---|
| Market Size in 2023 | USD 6.70 Billion |
| Market Size by 2032 | USD 1720.62 Billion |
| CAGR | CAGR of 73.01 % From 2024 to 2032 |
| Base Year | 2023 |
| Forecast Period | 2024-2032 |
| Historical Data | 2020-2022 |
| Report Scope & Coverage | Market Size, Segments Analysis, Competitive Landscape, Regional Analysis, DROC & SWOT Analysis, Forecast Outlook |
| Key Segments | • By Processor (Field-Programmable Gate Array (FPGA), Graphics Processing Unit (GPU), Central Processing Unit (CPU), Application Processing Unit (APU), Artificial Intelligence Application-specific Integrated Circuit (AI ASIC) Coprocessor) • By Packaging Technology (System-in-Package (SiP), Flip Chip Chip Scale Package (FCCSP), Flip Chip Ball Grid Array (FCBGA), 2.5D/3D, Wafer-Level Chip Scale Package (WLCSP), Fan-Out (FO)) • By End-use Applications (Enterprise Electronics, Consumer Electronics, Automotive, Industrial Automation, Healthcare, Military & Aerospace, Others) |
| Regional Analysis/Coverage | North America (US, Canada, Mexico), Europe (Eastern Europe [Poland, Romania, Hungary, Turkey, Rest of Eastern Europe] Western Europe] Germany, France, UK, Italy, Spain, Netherlands, Switzerland, Austria, Rest of Western Europe]), Asia Pacific (China, India, Japan, South Korea, Vietnam, Singapore, Australia, Rest of Asia Pacific), Middle East & Africa (Middle East [UAE, Egypt, Saudi Arabia, Qatar, Rest of Middle East], Africa [Nigeria, South Africa, Rest of Africa], Latin America (Brazil, Argentina, Colombia, Rest of Latin America) |
| Company Profiles | Intel Corporation, Advanced Micro Devices, Inc., Apple Inc., IBM, Marvell, MediaTek Inc., NVIDIA Corporation, Achronix Semiconductor Corporation, Ranovus, Netronome, Cadence Design Systems, Inc., SiFive, Inc., ALPHAWAVE SEMI, Eliyan, Ayar Labs, Inc., Tachyum, X-Celeprint, Kandou Bus SA, NHanced Semiconductors, Tenstorrent. |
| Key Drivers | • Increased Demand for High-Performance Computing Systems Drives the Growth of the Chiplet Market. • Cost-Effectiveness and Time-to-Market Efficiency Fueling Chiplet Market Expansion. |
| Restraints | • Challenges in Standardization and Compatibility Hinder Widespread Adoption of Chiplet Technologies. |
Ans: The Chiplet Market is expected to grow at a CAGR of 73.01% during 2024-2032.
Ans: The Chiplet Market size was USD 6.70 billion in 2023 and is expected to Reach USD 1720.62 billion by 2032.
Ans: The major growth factor of the chiplet market is the increasing demand for high-performance, cost-effective, and customizable semiconductor solutions across various industries.
Ans: Automotive segment dominated the Chiplet Market.
Ans: Asia Pacific dominated the Chiplet Market in 2023.
Table of Contents
1. Introduction
1.1 Market Definition
1.2 Scope (Inclusion and Exclusions)
1.3 Research Assumptions
2. Executive Summary
2.1 Market Overview
2.2 Regional Synopsis
2.3 Competitive Summary
3. Research Methodology
3.1 Top-Down Approach
3.2 Bottom-up Approach
3.3. Data Validation
3.4 Primary Interviews
4. Market Dynamics Impact Analysis
4.1 Market Driving Factors Analysis
4.1.1 Drivers
4.1.2 Restraints
4.1.3 Opportunities
4.1.4 Challenges
4.2 PESTLE Analysis
4.3 Porter’s Five Forces Model
5. Statistical Insights and Trends Reporting
5.1 Patent Filings by Region
5.2 Adoption Rate by Region
5.3 Supply Chain and Production Volume.
5.4 Cost Efficiency by Region
5.5 R&D Investment
6. Competitive Landscape
6.1 List of Major Companies, By Region
6.2 Market Share Analysis, By Region
6.3 Product Benchmarking
6.3.1 Product specifications and features
6.3.2 Pricing
6.4 Strategic Initiatives
6.4.1 Marketing and promotional activities
6.4.2 Distribution and supply chain strategies
6.4.3 Expansion plans and new product launches
6.4.4 Strategic partnerships and collaborations
6.5 Technological Advancements
6.6 Market Positioning and Branding
7. Chiplet Market Segmentation, By Processor
7.1 Chapter Overview
7.2 Field-Programmable Gate Array (FPGA)
7.2.1 Field-Programmable Gate Array (FPGA) Market Trends Analysis (2020-2032)
7.2.2 Field-Programmable Gate Array (FPGA) Market Size Estimates and Forecasts to 2032 (USD Billion)
7.3 Graphics Processing Unit (GPU)
7.3.1 Graphics Processing Unit (GPU) Market Trends Analysis (2020-2032)
7.3.2 Graphics Processing Unit (GPU) Market Size Estimates and Forecasts to 2032 (USD Billion)
7.4 Central Processing Unit (CPU)
7.4.1 Central Processing Unit (CPU) Market Trends Analysis (2020-2032)
7.4.2 Central Processing Unit (CPU) Market Size Estimates and Forecasts to 2032 (USD Billion)
7.5 Application Processing Unit (APU)
7.5.1 Application Processing Unit (APU) Market Trends Analysis (2020-2032)
7.5.2 Application Processing Unit (APU) Market Size Estimates and Forecasts to 2032 (USD Billion)
7.6 Artificial Intelligence Application-specific Integrated Circuit (AI ASIC) Coprocessor
7.6.1 Artificial Intelligence Application-specific Integrated Circuit (AI ASIC) Coprocessor Market Trends Analysis (2020-2032)
7.6.2 Artificial Intelligence Application-specific Integrated Circuit (AI ASIC) Coprocessor Market Size Estimates and Forecasts to 2032 (USD Billion)
8. Chiplet Market Segmentation, By Packaging Technology
8.1 Chapter Overview
8.2 System-in-Package (SiP)
8.2.1 System-in-Package (SiP) Market Trends Analysis (2020-2032)
8.2.2 System-in-Package (SiP) Market Size Estimates and Forecasts to 2032 (USD Billion)
8.3 Flip Chip Chip Scale Package (FCCSP)
8.3.1 Flip Chip Chip Scale Package (FCCSP) Market Trends Analysis (2020-2032)
8.3.2 Flip Chip Chip Scale Package (FCCSP) Market Size Estimates and Forecasts to 2032 (USD Billion)
8.4 Flip Chip Ball Grid Array (FCBGA)
8.4.1 Flip Chip Ball Grid Array (FCBGA) Market Trends Analysis (2020-2032)
8.4.2 Flip Chip Ball Grid Array (FCBGA) Market Size Estimates and Forecasts to 2032 (USD Billion)
8.5 2.5D/3D
8.5.1 2.5D/3D Market Trends Analysis (2020-2032)
8.5.2 2.5D/3D Market Size Estimates and Forecasts to 2032 (USD Billion)
8.6 Wafer-Level Chip Scale Package (WLCSP)
8.6.1 Wafer-Level Chip Scale Package (WLCSP) Market Trends Analysis (2020-2032)
8.6.2 Wafer-Level Chip Scale Package (WLCSP) Market Size Estimates and Forecasts to 2032 (USD Billion)
8.7 Fan-Out (FO)
8.7.1 Fan-Out (FO) Market Trends Analysis (2020-2032)
8.7.2 Fan-Out (FO) Market Size Estimates and Forecasts to 2032 (USD Billion)
9. Chiplet Market Segmentation, By End-use Application
9.1 Chapter Overview
9.2 Enterprise Electronics
9.2.1 Enterprise Electronics Market Trends Analysis (2020-2032)
9.2.2 Enterprise Electronics Market Size Estimates and Forecasts to 2032 (USD Billion)
9.3 Consumer Electronics
9.3.1 Consumer Electronics Market Trends Analysis (2020-2032)
9.3.2 Consumer Electronics Market Size Estimates and Forecasts to 2032 (USD Billion)
9.4 Industrial Automation
9.4.1 Industrial Automation Market Trends Analysis (2020-2032)
9.4.2 Industrial Automation Market Size Estimates and Forecasts to 2032 (USD Billion)
9.5 Healthcare
9.5.1 Healthcare Market Trends Analysis (2020-2032)
9.5.2 Healthcare Market Size Estimates and Forecasts to 2032 (USD Billion)
9.5 Military & Aerospace
9.5.1 Military & Aerospace Market Trends Analysis (2020-2032)
9.5.2 Military & Aerospace Market Size Estimates and Forecasts to 2032 (USD Billion)
9.5 Automotive
9.5.1 Automotive Market Trends Analysis (2020-2032)
9.5.2 Automotive Market Size Estimates and Forecasts to 2032 (USD Billion)
9.5 Others
9.5.1 Others Market Trends Analysis (2020-2032)
9.5.2 Others Market Size Estimates and Forecasts to 2032 (USD Billion)
10. Regional Analysis
10.1 Chapter Overview
10.2 North America
10.2.1 Trends Analysis
10.2.2 North America Chiplet Market Estimates and Forecasts, by Country (2020-2032) (USD Billion)
10.2.3 North America Chiplet Market Estimates and Forecasts, By Processor (2020-2032) (USD Billion)
10.2.4 North America Chiplet Market Estimates and Forecasts, By Packaging Technology (2020-2032) (USD Billion)
10.2.5 North America Chiplet Market Estimates and Forecasts, By End-use Application (2020-2032) (USD Billion)
10.2.6 USA
10.2.6.1 USA Chiplet Market Estimates and Forecasts, By Processor (2020-2032) (USD Billion)
10.2.6.2 USA Chiplet Market Estimates and Forecasts, By Packaging Technology (2020-2032) (USD Billion)
10.2.6.3 USA Chiplet Market Estimates and Forecasts, By End-use Application (2020-2032) (USD Billion)
10.2.7 Canada
10.2.7.1 Canada Chiplet Market Estimates and Forecasts, By Processor (2020-2032) (USD Billion)
10.2.7.2 Canada Chiplet Market Estimates and Forecasts, By Packaging Technology (2020-2032) (USD Billion)
10.2.7.3 Canada Chiplet Market Estimates and Forecasts, By End-use Application (2020-2032) (USD Billion)
10.2.8 Mexico
10.2.8.1 Mexico Chiplet Market Estimates and Forecasts, By Processor (2020-2032) (USD Billion)
10.2.8.2 Mexico Chiplet Market Estimates and Forecasts, By Packaging Technology (2020-2032) (USD Billion)
10.2.8.3 Mexico Chiplet Market Estimates and Forecasts, By End-use Application (2020-2032) (USD Billion)
10.3 Europe
10.3.1 Eastern Europe
10.3.1.1 Trends Analysis
10.3.1.2 Eastern Europe Chiplet Market Estimates and Forecasts, by Country (2020-2032) (USD Billion)
10.3.1.3 Eastern Europe Chiplet Market Estimates and Forecasts, By Processor (2020-2032) (USD Billion)
10.3.1.4 Eastern Europe Chiplet Market Estimates and Forecasts, By Packaging Technology (2020-2032) (USD Billion)
10.3.1.5 Eastern Europe Chiplet Market Estimates and Forecasts, By End-use Application (2020-2032) (USD Billion)
10.3.1.6 Poland
10.3.1.6.1 Poland Chiplet Market Estimates and Forecasts, By Processor (2020-2032) (USD Billion)
10.3.1.6.2 Poland Chiplet Market Estimates and Forecasts, By Packaging Technology (2020-2032) (USD Billion)
10.3.1.6.3 Poland Chiplet Market Estimates and Forecasts, By End-use Application (2020-2032) (USD Billion)
10.3.1.7 Romania
10.3.1.7.1 Romania Chiplet Market Estimates and Forecasts, By Processor (2020-2032) (USD Billion)
10.3.1.7.2 Romania Chiplet Market Estimates and Forecasts, By Packaging Technology (2020-2032) (USD Billion)
10.3.1.7.3 Romania Chiplet Market Estimates and Forecasts, By End-use Application (2020-2032) (USD Billion)
10.3.1.8 Hungary
10.3.1.8.1 Hungary Chiplet Market Estimates and Forecasts, By Processor (2020-2032) (USD Billion)
10.3.1.8.2 Hungary Chiplet Market Estimates and Forecasts, By Packaging Technology (2020-2032) (USD Billion)
10.3.1.8.3 Hungary Chiplet Market Estimates and Forecasts, By End-use Application (2020-2032) (USD Billion)
10.3.1.9 Turkey
10.3.1.9.1 Turkey Chiplet Market Estimates and Forecasts, By Processor (2020-2032) (USD Billion)
10.3.1.9.2 Turkey Chiplet Market Estimates and Forecasts, By Packaging Technology (2020-2032) (USD Billion)
10.3.1.9.3 Turkey Chiplet Market Estimates and Forecasts, By End-use Application (2020-2032) (USD Billion)
10.3.1.10 Rest of Eastern Europe
10.3.1.10.1 Rest of Eastern Europe Chiplet Market Estimates and Forecasts, By Processor (2020-2032) (USD Billion)
10.3.1.10.2 Rest of Eastern Europe Chiplet Market Estimates and Forecasts, By Packaging Technology (2020-2032) (USD Billion)
10.3.1.10.3 Rest of Eastern Europe Chiplet Market Estimates and Forecasts, By End-use Application (2020-2032) (USD Billion)
10.3.2 Western Europe
10.3.2.1 Trends Analysis
10.3.2.2 Western Europe Chiplet Market Estimates and Forecasts, by Country (2020-2032) (USD Billion)
10.3.2.3 Western Europe Chiplet Market Estimates and Forecasts, By Processor (2020-2032) (USD Billion)
10.3.2.4 Western Europe Chiplet Market Estimates and Forecasts, By Packaging Technology (2020-2032) (USD Billion)
10.3.2.5 Western Europe Chiplet Market Estimates and Forecasts, By End-use Application (2020-2032) (USD Billion)
10.3.2.6 Germany
10.3.2.6.1 Germany Chiplet Market Estimates and Forecasts, By Processor (2020-2032) (USD Billion)
10.3.2.6.2 Germany Chiplet Market Estimates and Forecasts, By Packaging Technology (2020-2032) (USD Billion)
10.3.2.6.3 Germany Chiplet Market Estimates and Forecasts, By End-use Application (2020-2032) (USD Billion)
10.3.2.7 France
10.3.2.7.1 France Chiplet Market Estimates and Forecasts, By Processor (2020-2032) (USD Billion)
10.3.2.7.2 France Chiplet Market Estimates and Forecasts, By Packaging Technology (2020-2032) (USD Billion)
10.3.2.7.3 France Chiplet Market Estimates and Forecasts, By End-use Application (2020-2032) (USD Billion)
10.3.2.8 UK
10.3.2.8.1 UK Chiplet Market Estimates and Forecasts, By Processor (2020-2032) (USD Billion)
10.3.2.8.2 UK Chiplet Market Estimates and Forecasts, By Packaging Technology (2020-2032) (USD Billion)
10.3.2.8.3 UK Chiplet Market Estimates and Forecasts, By End-use Application (2020-2032) (USD Billion)
10.3.2.9 Italy
10.3.2.9.1 Italy Chiplet Market Estimates and Forecasts, By Processor (2020-2032) (USD Billion)
10.3.2.9.2 Italy Chiplet Market Estimates and Forecasts, By Packaging Technology (2020-2032) (USD Billion)
10.3.2.9.3 Italy Chiplet Market Estimates and Forecasts, By End-use Application (2020-2032) (USD Billion)
10.3.2.10 Spain
10.3.2.10.1 Spain Chiplet Market Estimates and Forecasts, By Processor (2020-2032) (USD Billion)
10.3.2.10.2 Spain Chiplet Market Estimates and Forecasts, By Packaging Technology (2020-2032) (USD Billion)
10.3.2.10.3 Spain Chiplet Market Estimates and Forecasts, By End-use Application (2020-2032) (USD Billion)
10.3.2.11 Netherlands
10.3.2.11.1 Netherlands Chiplet Market Estimates and Forecasts, By Processor (2020-2032) (USD Billion)
10.3.2.11.2 Netherlands Chiplet Market Estimates and Forecasts, By Packaging Technology (2020-2032) (USD Billion)
10.3.2.11.3 Netherlands Chiplet Market Estimates and Forecasts, By End-use Application (2020-2032) (USD Billion)
10.3.2.12 Switzerland
10.3.2.12.1 Switzerland Chiplet Market Estimates and Forecasts, By Processor (2020-2032) (USD Billion)
10.3.2.12.2 Switzerland Chiplet Market Estimates and Forecasts, By Packaging Technology (2020-2032) (USD Billion)
10.3.2.12.3 Switzerland Chiplet Market Estimates and Forecasts, By End-use Application (2020-2032) (USD Billion)
10.3.2.13 Austria
10.3.2.13.1 Austria Chiplet Market Estimates and Forecasts, By Processor (2020-2032) (USD Billion)
10.3.2.13.2 Austria Chiplet Market Estimates and Forecasts, By Packaging Technology (2020-2032) (USD Billion)
10.3.2.13.3 Austria Chiplet Market Estimates and Forecasts, By End-use Application (2020-2032) (USD Billion)
10.3.2.14 Rest of Western Europe
10.3.2.14.1 Rest of Western Europe Chiplet Market Estimates and Forecasts, By Processor (2020-2032) (USD Billion)
10.3.2.14.2 Rest of Western Europe Chiplet Market Estimates and Forecasts, By Packaging Technology (2020-2032) (USD Billion)
10.3.2.14.3 Rest of Western Europe Chiplet Market Estimates and Forecasts, By End-use Application (2020-2032) (USD Billion)
10.4 Asia Pacific
10.4.1 Trends Analysis
10.4.2 Asia Pacific Chiplet Market Estimates and Forecasts, by Country (2020-2032) (USD Billion)
10.4.3 Asia Pacific Chiplet Market Estimates and Forecasts, By Processor (2020-2032) (USD Billion)
10.4.4 Asia Pacific Chiplet Market Estimates and Forecasts, By Packaging Technology (2020-2032) (USD Billion)
10.4.5 Asia Pacific Chiplet Market Estimates and Forecasts, By End-use Application (2020-2032) (USD Billion)
10.4.6 China
10.4.6.1 China Chiplet Market Estimates and Forecasts, By Processor (2020-2032) (USD Billion)
10.4.6.2 China Chiplet Market Estimates and Forecasts, By Packaging Technology (2020-2032) (USD Billion)
10.4.6.3 China Chiplet Market Estimates and Forecasts, By End-use Application (2020-2032) (USD Billion)
10.4.7 India
10.4.7.1 India Chiplet Market Estimates and Forecasts, By Processor (2020-2032) (USD Billion)
10.4.7.2 India Chiplet Market Estimates and Forecasts, By Packaging Technology (2020-2032) (USD Billion)
10.4.7.3 India Chiplet Market Estimates and Forecasts, By End-use Application (2020-2032) (USD Billion)
10.4.8 Japan
10.4.8.1 Japan Chiplet Market Estimates and Forecasts, By Processor (2020-2032) (USD Billion)
10.4.8.2 Japan Chiplet Market Estimates and Forecasts, By Packaging Technology (2020-2032) (USD Billion)
10.4.8.3 Japan Chiplet Market Estimates and Forecasts, By End-use Application (2020-2032) (USD Billion)
10.4.9 South Korea
10.4.9.1 South Korea Chiplet Market Estimates and Forecasts, By Processor (2020-2032) (USD Billion)
10.4.9.2 South Korea Chiplet Market Estimates and Forecasts, By Packaging Technology (2020-2032) (USD Billion)
10.4.9.3 South Korea Chiplet Market Estimates and Forecasts, By End-use Application (2020-2032) (USD Billion)
10.4.10 Vietnam
10.4.10.1 Vietnam Chiplet Market Estimates and Forecasts, By Processor (2020-2032) (USD Billion)
10.4.10.2 Vietnam Chiplet Market Estimates and Forecasts, By Packaging Technology (2020-2032) (USD Billion)
10.4.10.3 Vietnam Chiplet Market Estimates and Forecasts, By End-use Application (2020-2032) (USD Billion)
10.4.11 Singapore
10.4.11.1 Singapore Chiplet Market Estimates and Forecasts, By Processor (2020-2032) (USD Billion)
10.4.11.2 Singapore Chiplet Market Estimates and Forecasts, By Packaging Technology (2020-2032) (USD Billion)
10.4.11.3 Singapore Chiplet Market Estimates and Forecasts, By End-use Application (2020-2032) (USD Billion)
10.4.12 Australia
10.4.12.1 Australia Chiplet Market Estimates and Forecasts, By Processor (2020-2032) (USD Billion)
10.4.12.2 Australia Chiplet Market Estimates and Forecasts, By Packaging Technology (2020-2032) (USD Billion)
10.4.12.3 Australia Chiplet Market Estimates and Forecasts, By End-use Application (2020-2032) (USD Billion)
10.4.13 Rest of Asia Pacific
10.4.13.1 Rest of Asia Pacific Chiplet Market Estimates and Forecasts, By Processor (2020-2032) (USD Billion)
10.4.13.2 Rest of Asia Pacific Chiplet Market Estimates and Forecasts, By Packaging Technology (2020-2032) (USD Billion)
10.4.13.3 Rest of Asia Pacific Chiplet Market Estimates and Forecasts, By End-use Application (2020-2032) (USD Billion)
10.5 Middle East and Africa
10.5.1 Middle East
10.5.1.1 Trends Analysis
10.5.1.2 Middle East Chiplet Market Estimates and Forecasts, by Country (2020-2032) (USD Billion)
10.5.1.3 Middle East Chiplet Market Estimates and Forecasts, By Processor (2020-2032) (USD Billion)
10.5.1.4 Middle East Chiplet Market Estimates and Forecasts, By Packaging Technology (2020-2032) (USD Billion)
10.5.1.5 Middle East Chiplet Market Estimates and Forecasts, By End-use Application (2020-2032) (USD Billion)
10.5.1.6 UAE
10.5.1.6.1 UAE Chiplet Market Estimates and Forecasts, By Processor (2020-2032) (USD Billion)
10.5.1.6.2 UAE Chiplet Market Estimates and Forecasts, By Packaging Technology (2020-2032) (USD Billion)
10.5.1.6.3 UAE Chiplet Market Estimates and Forecasts, By End-use Application (2020-2032) (USD Billion)
10.5.1.7 Egypt
10.5.1.7.1 Egypt Chiplet Market Estimates and Forecasts, By Processor (2020-2032) (USD Billion)
10.5.1.7.2 Egypt Chiplet Market Estimates and Forecasts, By Packaging Technology (2020-2032) (USD Billion)
10.5.1.7.3 Egypt Chiplet Market Estimates and Forecasts, By End-use Application (2020-2032) (USD Billion)
10.5.1.8 Saudi Arabia
10.5.1.8.1 Saudi Arabia Chiplet Market Estimates and Forecasts, By Processor (2020-2032) (USD Billion)
10.5.1.8.2 Saudi Arabia Chiplet Market Estimates and Forecasts, By Packaging Technology (2020-2032) (USD Billion)
10.5.1.8.3 Saudi Arabia Chiplet Market Estimates and Forecasts, By End-use Application (2020-2032) (USD Billion)
10.5.1.9 Qatar
10.5.1.9.1 Qatar Chiplet Market Estimates and Forecasts, By Processor (2020-2032) (USD Billion)
10.5.1.9.2 Qatar Chiplet Market Estimates and Forecasts, By Packaging Technology (2020-2032) (USD Billion)
10.5.1.9.3 Qatar Chiplet Market Estimates and Forecasts, By End-use Application (2020-2032) (USD Billion)
10.5.1.10 Rest of Middle East
10.5.1.10.1 Rest of Middle East Chiplet Market Estimates and Forecasts, By Processor (2020-2032) (USD Billion)
10.5.1.10.2 Rest of Middle East Chiplet Market Estimates and Forecasts, By Packaging Technology (2020-2032) (USD Billion)
10.5.1.10.3 Rest of Middle East Chiplet Market Estimates and Forecasts, By End-use Application (2020-2032) (USD Billion)
10.5.2 Africa
10.5.2.1 Trends Analysis
10.5.2.2 Africa Chiplet Market Estimates and Forecasts, by Country (2020-2032) (USD Billion)
10.5.2.3 Africa Chiplet Market Estimates and Forecasts, By Processor (2020-2032) (USD Billion)
10.5.2.4 Africa Chiplet Market Estimates and Forecasts, By Packaging Technology (2020-2032) (USD Billion)
10.5.2.5 Africa Chiplet Market Estimates and Forecasts, By End-use Application (2020-2032) (USD Billion)
10.5.2.6 South Africa
10.5.2.6.1 South Africa Chiplet Market Estimates and Forecasts, By Processor (2020-2032) (USD Billion)
10.5.2.6.2 South Africa Chiplet Market Estimates and Forecasts, By Packaging Technology (2020-2032) (USD Billion)
10.5.2.6.3 South Africa Chiplet Market Estimates and Forecasts, By End-use Application (2020-2032) (USD Billion)
10.5.2.7 Nigeria
10.5.2.7.1 Nigeria Chiplet Market Estimates and Forecasts, By Processor (2020-2032) (USD Billion)
10.5.2.7.2 Nigeria Chiplet Market Estimates and Forecasts, By Packaging Technology (2020-2032) (USD Billion)
10.5.2.7.3 Nigeria Chiplet Market Estimates and Forecasts, By End-use Application (2020-2032) (USD Billion)
10.5.2.8 Rest of Africa
10.5.2.8.1 Rest of Africa Chiplet Market Estimates and Forecasts, By Processor (2020-2032) (USD Billion)
10.5.2.8.2 Rest of Africa Chiplet Market Estimates and Forecasts, By Packaging Technology (2020-2032) (USD Billion)
10.5.2.8.3 Rest of Africa Chiplet Market Estimates and Forecasts, By End-use Application (2020-2032) (USD Billion)
10.6 Latin America
10.6.1 Trends Analysis
10.6.2 Latin America Chiplet Market Estimates and Forecasts, by Country (2020-2032) (USD Billion)
10.6.3 Latin America Chiplet Market Estimates and Forecasts, By Processor (2020-2032) (USD Billion)
10.6.4 Latin America Chiplet Market Estimates and Forecasts, By Packaging Technology (2020-2032) (USD Billion)
10.6.5 Latin America Chiplet Market Estimates and Forecasts, By End-use Application (2020-2032) (USD Billion)
10.6.6 Brazil
10.6.6.1 Brazil Chiplet Market Estimates and Forecasts, By Processor (2020-2032) (USD Billion)
10.6.6.2 Brazil Chiplet Market Estimates and Forecasts, By Packaging Technology (2020-2032) (USD Billion)
10.6.6.3 Brazil Chiplet Market Estimates and Forecasts, By End-use Application (2020-2032) (USD Billion)
10.6.7 Argentina
10.6.7.1 Argentina Chiplet Market Estimates and Forecasts, By Processor (2020-2032) (USD Billion)
10.6.7.2 Argentina Chiplet Market Estimates and Forecasts, By Packaging Technology (2020-2032) (USD Billion)
10.6.7.3 Argentina Chiplet Market Estimates and Forecasts, By End-use Application (2020-2032) (USD Billion)
10.6.8 Colombia
10.6.8.1 Colombia Chiplet Market Estimates and Forecasts, By Processor (2020-2032) (USD Billion)
10.6.8.2 Colombia Chiplet Market Estimates and Forecasts, By Packaging Technology (2020-2032) (USD Billion)
10.6.8.3 Colombia Chiplet Market Estimates and Forecasts, By End-use Application (2020-2032) (USD Billion)
10.6.9 Rest of Latin America
10.6.9.1 Rest of Latin America Chiplet Market Estimates and Forecasts, By Processor (2020-2032) (USD Billion)
10.6.9.2 Rest of Latin America Chiplet Market Estimates and Forecasts, By Packaging Technology (2020-2032) (USD Billion)
10.6.9.3 Rest of Latin America Chiplet Market Estimates and Forecasts, By End-use Application (2020-2032) (USD Billion)
11. Company Profiles
11.1 Intel Corporation
11.1.1 Company Overview
11.1.2 Financial
11.1.3 Products/ Services Offered
11.1.4 SWOT Analysis
11.2 Advanced Micro Devices, Inc.
11.2.1 Company Overview
11.2.2 Financial
11.2.3 Products/ Services Offered
11.2.4 SWOT Analysis
11.3 Apple Inc.
11.3.1 Company Overview
11.3.2 Financial
11.3.3 Products/ Services Offered
11.3.4 SWOT Analysis
11.4 IBM
11.4.1 Company Overview
11.4.2 Financial
11.4.3 Products/ Services Offered
11.4.4 SWOT Analysis
11.5 Marvell
11.5.1 Company Overview
11.5.2 Financial
11.5.3 Products/ Services Offered
11.5.4 SWOT Analysis
11.6 MediaTek Inc.
11.6.1 Company Overview
11.6.2 Financial
11.6.3 Products/ Services Offered
11.6.4 SWOT Analysis
11.7 NVIDIA Corporation
11.7.1 Company Overview
11.7.2 Financial
11.7.3 Products/ Services Offered
11.7.4 SWOT Analysis
11.8 Achronix Semiconductor Corporation
11.8.1 Company Overview
11.8.2 Financial
11.8.3 Products/ Services Offered
11.8.4 SWOT Analysis
11.9 Ranovus
11.9.1 Company Overview
11.9.2 Financial
11.9.3 Products/ Services Offered
11.9.4 SWOT Analysis
11.10 Netronome
11.10.1 Company Overview
11.10.2 Financial
11.10.3 Products/ Services Offered
11.10.4 SWOT Analysis
12. Use Cases and Best Practices
13. Conclusion
An accurate research report requires proper strategizing as well as implementation. There are multiple factors involved in the completion of good and accurate research report and selecting the best methodology to compete the research is the toughest part. Since the research reports we provide play a crucial role in any company’s decision-making process, therefore we at SNS Insider always believe that we should choose the best method which gives us results closer to reality. This allows us to reach at a stage wherein we can provide our clients best and accurate investment to output ratio.
Each report that we prepare takes a timeframe of 350-400 business hours for production. Starting from the selection of titles through a couple of in-depth brain storming session to the final QC process before uploading our titles on our website we dedicate around 350 working hours. The titles are selected based on their current market cap and the foreseen CAGR and growth.
The 5 steps process:
Step 1: Secondary Research:
Secondary Research or Desk Research is as the name suggests is a research process wherein, we collect data through the readily available information. In this process we use various paid and unpaid databases which our team has access to and gather data through the same. This includes examining of listed companies’ annual reports, Journals, SEC filling etc. Apart from this our team has access to various associations across the globe across different industries. Lastly, we have exchange relationships with various university as well as individual libraries.

Step 2: Primary Research
When we talk about primary research, it is a type of study in which the researchers collect relevant data samples directly, rather than relying on previously collected data. This type of research is focused on gaining content specific facts that can be sued to solve specific problems. Since the collected data is fresh and first hand therefore it makes the study more accurate and genuine.
We at SNS Insider have divided Primary Research into 2 parts.
Part 1 wherein we interview the KOLs of major players as well as the upcoming ones across various geographic regions. This allows us to have their view over the market scenario and acts as an important tool to come closer to the accurate market numbers. As many as 45 paid and unpaid primary interviews are taken from both the demand and supply side of the industry to make sure we land at an accurate judgement and analysis of the market.
This step involves the triangulation of data wherein our team analyses the interview transcripts, online survey responses and observation of on filed participants. The below mentioned chart should give a better understanding of the part 1 of the primary interview.

Part 2: In this part of primary research the data collected via secondary research and the part 1 of the primary research is validated with the interviews from individual consultants and subject matter experts.
Consultants are those set of people who have at least 12 years of experience and expertise within the industry whereas Subject Matter Experts are those with at least 15 years of experience behind their back within the same space. The data with the help of two main processes i.e., FGDs (Focused Group Discussions) and IDs (Individual Discussions). This gives us a 3rd party nonbiased primary view of the market scenario making it a more dependable one while collation of the data pointers.
Step 3: Data Bank Validation
Once all the information is collected via primary and secondary sources, we run that information for data validation. At our intelligence centre our research heads track a lot of information related to the market which includes the quarterly reports, the daily stock prices, and other relevant information. Our data bank server gets updated every fortnight and that is how the information which we collected using our primary and secondary information is revalidated in real time.

Step 4: QA/QC Process
After all the data collection and validation our team does a final level of quality check and quality assurance to get rid of any unwanted or undesired mistakes. This might include but not limited to getting rid of the any typos, duplication of numbers or missing of any important information. The people involved in this process include technical content writers, research heads and graphics people. Once this process is completed the title gets uploader on our platform for our clients to read it.
Step 5: Final QC/QA Process:
This is the last process and comes when the client has ordered the study. In this process a final QA/QC is done before the study is emailed to the client. Since we believe in giving our clients a good experience of our research studies, therefore, to make sure that we do not lack at our end in any way humanly possible we do a final round of quality check and then dispatch the study to the client.
By Processor
Field-Programmable Gate Array (FPGA)
Graphics Processing Unit (GPU)
Central Processing Unit (CPU)
Application Processing Unit (APU)
Artificial Intelligence Application-specific Integrated Circuit (AI ASIC) Coprocessor
By Packaging Technology
System-in-Package (SiP)
Flip Chip Chip Scale Package (FCCSP)
Flip Chip Ball Grid Array (FCBGA)
2.5D/3D
Wafer-Level Chip Scale Package (WLCSP)
Fan-Out (FO)
By End-use Application
Enterprise Electronics
Consumer Electronics
Automotive
Industrial Automation
Healthcare
Military & Aerospace
Others
Request for Segment Customization as per your Business Requirement: Segment Customization Request
REGIONAL COVERAGE:
North America
US
Canada
Mexico
Europe
Eastern Europe
Poland
Romania
Hungary
Turkey
Rest of Eastern Europe
Western Europe
Germany
France
UK
Italy
Spain
Netherlands
Switzerland
Austria
Rest of Western Europe
Asia Pacific
China
India
Japan
South Korea
Vietnam
Singapore
Australia
Rest of Asia Pacific
Middle East & Africa
Middle East
UAE
Egypt
Saudi Arabia
Qatar
Rest of the Middle East
Africa
Nigeria
South Africa
Rest of Africa
Latin America
Brazil
Argentina
Colombia
Rest Of Latin America
Request for Country Level Research Report: Country Level Customization Request
Available Customization
With the given market data, SNS Insider offers customization as per the company’s specific needs. The following customization options are available for the report:
Product Analysis
Criss-Cross segment analysis (e.g. Product X Application)
Product Matrix which gives a detailed comparison of product portfolio of each company
Geographic Analysis
Additional countries in any of the regions
Company Information
Detailed analysis and profiling of additional market players (Up to five)
The Industrial IoT Display Market Size was valued at USD 1.0 Billion in 2023 and is expected to grow at a CAGR Of 12.47% to reach USD 2.88 Billion by 2032.
The 3D Metrology Market Size was valued at USD 10.88 Billion in 2023 and is expected to grow at a CAGR of 7.97% to reach USD 21.69 Billion by 2032.
The Autonomous Multifunctional Agriculture Robot Market was valued at USD 0.45 billion in 2023 and is expected to reach USD 1.81 billion by 2032, growing at a CAGR of 16.75% over the forecast period 2024-2032.
The Smart Lock Market Size was valued at USD 2.38 Billion in 2023 and is expected to reach USD 8.71 Billion by 2032, at a CAGR of 15.58% during 2024-2032
The Integrated Microwave Assembly Market was valued at USD 1.95 billion in 2023 and is expected to reach USD 3.49 billion by 2032, growing at a CAGR of 6.71% over the forecast period 2024-2032.
The Switchgear Market size was valued at USD 97.76 Billion in 2023. It is estimated to reach USD 165.01 Billion by 2032, growing at a CAGR of 6.00% during 2024-2032.

Hi! Click one of our member below to chat on Phone
© 2025 All Rights Reserved by SNS Insider Pvt Ltd


