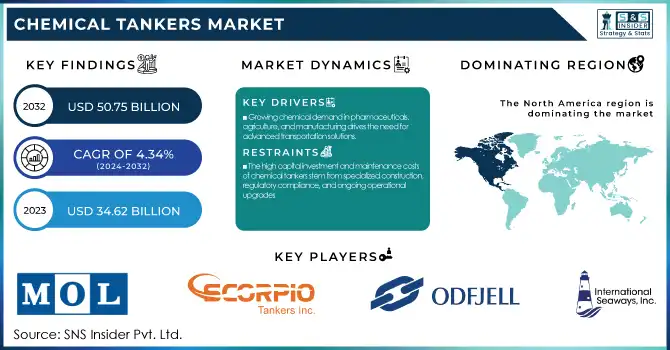
The Chemical Tankers Market Size was estimated at USD 34.62 billion in 2023 and is expected to arrive at USD 50.75 billion by 2032 with a growing CAGR of 4.34% over the forecast period 2024-2032. The Chemical Tankers Market is experiencing a shift with fleet size expansion driven by rising demand for specialized chemical transportation. Utilization rates have remained high in key regions, reflecting strong trade flows. Technological advancements, including eco-friendly coatings and digital monitoring, are being widely adopted across major operators. Export/import volumes of chemicals continue to grow, with the Middle East emerging as a dominant exporter. Tanker charter rates for stainless steel tankers saw fluctuations, peaking before stabilizing, indicating dynamic market conditions.
To Get more information on Chemical Tankers Market - Request Free Sample Report
Drivers
The rising demand for chemicals across pharmaceuticals, agriculture, and manufacturing is driving the need for efficient and advanced chemical transportation solutions.
The growing chemical industry is a key driver of the chemical tankers market, as the demand for chemicals continues to rise across sectors like pharmaceuticals, agriculture, and manufacturing. The global population is growing exponentially and industrialization in developing nations is also rapidly increasing the need for specialty and bulk chemicals that must be transported in the most efficient and safe manner possible. In chemical production, particularly in dynamic countries of the Asia-pacific, rising production capabilities, exports and imports of liquid chemicals are noted. With this expansion, comes further investment into new chemical tankers including innovative and covered systems, seamless inspection, corrosion-resistant materials, and automatic handling systems that improve safety and efficiency. On top of that, sustainability trends are shifting adoption to bio-based chemicals, which in addition also creates more transportation requirements. The market is furthermore also seeing a move towards LNG-powered and IMO 2020-compliant vessels to cut emissions. The growth of the market for chemical tankers is expected to continues for the future years with rising global trade, technological advancements and the increasing need for safety regulations from authorities.
Restraint
The high capital investment and maintenance costs of chemical tankers stem from specialized construction, regulatory compliance, and ongoing operational upgrades.
The chemical tankers market requires significant capital investment. Due to the nature of the transport, these tankers need to be made from high quality materials with special coatings and corrosion-resistant cargo tanks to transport oil without contaminating or polluting it. Also, to comply with the increasingly strict international regulations like the IMO, more advanced safety systems for fire and gas detection and remediation, emission control, and ballast water treatment technologies drive up the costs. Continued expenditures such as inspections, cleaning, repairs, etc. are necessary to avoid functional failures and ensure durability. The use of advanced technologies, like automated cargo handling systems and real-time tracking, represents an additional expense. In addition to this, the unpredictable nature of fuel prices and the rising standards of environmental regulations, both of which make upgrades a necessity, lead to recurring expenditures for the container shipping firms. As a result, chemical tankers are a capital-intensive investment, which continues to affect profits and return on investment for market participants.
Opportunities
The growing demand for specialty chemicals is driving the need for advanced chemical tankers with specialized materials, ensuring safety, compliance, and new revenue opportunities.
The rising demand for specialty chemicals, including high-purity solvents, agrochemicals, and pharmaceuticals, is driving the need for specialized chemical tankers. In contrast to bulk chemicals, these materials need to be transported in specialized solutions that are compatible with their unique properties to avoid contamination and degradation. Most modern chemical tankers have stainless steel tanks, modern coatings and segregated compartments that allow them to carry many chemicals at once. On top of this, strict environmental laws and safety rules require novel tanker constructions that use rust resistant material or automated monitoring systems. The increasing demand translates into opportunities for tanker operators to invest in high specification vessels which enables them to provide more services and hence earn more revenue. Rapid industrialization in emerging markets, especially in Asia-Pacific and Latin America, is also supporting the growth of these vessels. More chemical formulation innovation continues to emerge from various industries, making the need for improved chemical tankers a vital component of the provision of global supply chains.
Challenges
Environmental and safety concerns in chemical tankers necessitate strict regulations, advanced tanker designs, and specialized training to prevent spills, pollution, and accidents.
Environmental and safety concerns in the chemical tankers market are critical due to the hazardous nature of transported substances. Chemical spills, marine pollution, onboard accidents threaten ecosystems, marine life, and the health of human beings. Regulatory frameworks like the International Maritime Organization (IMO)'s MARPOL regulations impose demanding safety, spill-prevention, and waste-disposal requirements. These regulations necessitate investments in new tanker designs, double-hulled vessels and on-board monitoring systems to reduce risks. Moreover, crew members have to train specifically for carrying toxic or flammable cargo safely. Even so, there will likely be occasional spills and leaks, which can result in costly fines, legal liabilities, and reputational damages to the shipping company. With the growing global concern for environmental sustainability, stakeholders are investing in sustainable alternatives like LNG-fueled tankers and chemical recycling projects to reduce environmental hazards and improve the safety of chemicals transportation.
By Fleet Type
The IMO 2 segment dominated with a market share of over 52% in 2023, due to its versatility, safety, and rising global demand. They are designed to carry moderately dangerous chemicals and are utilized in the pharmaceutical, agrochemical, and food processing industries to name a few. Their versatility makes them always in demand throughout different sectors. Moreover, IMO 2 tankers have the built-in safety mechanisms in the design of the vessel, making them a safe mode of transportation of chemical cargo with efficiency and reliability. Also, the demand for these vessels has been accelerated with the increasing industrialization, particularly in emerging markets. With industries developing and chemical commerce growing, it is anticipated that the market for IMO 2 tankers will maintain its robust growth, on account of which the management of chemical tankers will appear more robust.
By Product
The Deep-sea chemical tankers (10,000-50,000 DWT) segment dominated with the market share of over 48% in 2023, Highly specialized ships equipped for long-range travels to transport bulk liquid chemicals, whether they be specialty or commodity, are capable of transporting them safely, cost effectively, and reliably. Their high capacity allows economies of scale, hence being a preferred solution by global chemical manufacturer and traders. Moreover, innovations in tanker design along with basic regulations for the safe delivery of chemicals augment their market share.
By Application
The vegetable oils and fats segment dominated with a market share of over 34% in 2023, due to rising global demand across multiple industries. Vegetable oils are an important product used in cooking, the food and food processing sector, moreover, the oil finds use in skincare and personal care products as cosmetics and personal care products. Moreover, due to environmental regulations, usage of biofuels has increased, which in turn has enhanced the need for vegetable oils as a major feedstock. As agricultural production has expanded and the consumption in emerging markets has increased, the transport of these oils with chemical tankers has grown. Moreover, the demand for niche tankers for clean and contamination-free shipping is another factor contributing to the market growth. This segment is projected to continue to lead in the global market as the demand accelerates.
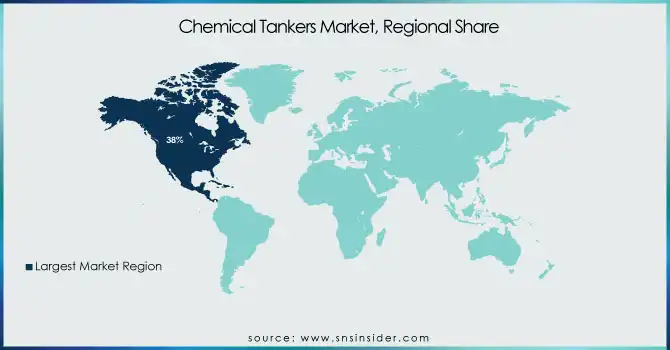
North America region dominated with a market share of over 38% in 2023, due to its strong chemical production capacity, well-established maritime trade routes, and the presence of major industry players. Significant presence of chemical manufacturers (especially in the United States and Canada) in the region further increases demand for chemical tankers in North America. Furthermore, North America has a highly developed port infrastructure and is well-connected to facilitate easy import and export of chemicals, which is strengthening its dominance in the market. In the U.S., the Gulf Coast operates as an essential hub for the production and shipping of petrochemicals, guaranteeing tanker demand. In addition, laws concerning the safe transportation of chemicals are becoming more rigid, resulting in higher investments towards modern, environmentally friendly chemical tankers. North America boasts prominent shipping companies, a network of trade agreements, and balance in demand and supply that continue to give it a stronghold on chemical tankers as the continued short-to-long market-growth phasing will keep supply and demand in balance.
Asia-Pacific is the fastest-growing region in the chemical tankers market, driven by rapid industrialization, increasing chemical exports, and expanding refinery capacities. In countries such as China and India, where the production and consumption of chemicals is growing considerably, this means rapid growth in demand for efficient transport. Key regional drivers include the booming manufacturing sector, as well as increasing investments in the petrochemical and specialty chemical industries which are further accelerating revenue growth, states the report. Furthermore, there are government initiatives for aiding trade and infrastructure development, such as expansion of ports and enhancement of logistics networks, etc., which are driving the transportation of chemicals within the country. Tankers are also benefitting from greater demand for chemicals in pharmaceuticals, agriculture and consumer goods.
Get Customized Report as per Your Business Requirement - Enquiry Now
Some of the major key players in the Chemical Tankers Market
Mitsui O.S.K. Lines, Ltd. (Chemical parcel tankers, IMO II & III tankers)
Scorpio Tankers Inc. (Medium-range (MR) chemical tankers)
Nordic American Tankers Ltd. (Suezmax tankers for chemical transport)
Odfjell SE (Stainless steel chemical tankers, parcel tankers)
Capital Product Partners L.P. (Product and chemical tankers)
International Seaways, Inc. (Handysize & MR chemical tankers)
Hafnia Limited (LR1 & MR chemical tankers)
Team Tankers International Ltd. (IMO II & III chemical tankers)
Bahri (The National Shipping Company of Saudi Arabia) (Petrochemical & bulk liquid transport)
Euronav NV (Chemical and crude oil tankers)
Maersk Tankers (Stainless steel & coated chemical tankers)
Navig8 Chemical Tankers (Specialized IMO chemical tankers)
Tsakos Energy Navigation Ltd. (MR and LR chemical tankers)
Frontline Ltd. (Aframax & Suezmax chemical tankers)
Stolt-Nielsen Limited (Parcel tankers, chemical logistics)
DHT Holdings, Inc. (VLCC tankers for chemicals & crude oil)
Top Ships Inc. (MR & Handysize chemical tankers)
Ardmore Shipping Corporation (Eco-design chemical tankers)
MISC Berhad (Specialized chemical & gas tankers)
TORM plc (Coated tankers for petroleum & chemicals)
Suppliers for (Largest operator of stainless-steel chemical tankers and ISO tank containers) on Chemical Tankers Market
Odfjell SE
Stolt-Nielsen Limited
Sovcomflot
Teekay Corporation
BW Group
Eitzen Chemical
Hafnia
Maersk Tankers
Navig8 Chemical Tankers
Peninsula
In March 2024: Mitsui Chemical Tankers, a subsidiary of Mitsui OSK Lines, acquired Fairfield Chemical Carriers for approximately 400 billion USD. This strategic move reinforces MOL’s presence in the chemical tanker market while expanding its fleet capacity, granting a competitive edge.
In February 2024: Chemship, a Rotterdam-based chemical tanker operator, introduced its first vessel featuring wind-assisted propulsion. The MT Chemical Challenger is claimed to be the world’s first chemical tanker equipped with sustainable wind technology. The ship will operate on Chemship’s Transatlantic route, connecting the U.S. East Coast with the Mediterranean.
| Report Attributes | Details |
|---|---|
| Market Size in 2023 | USD 34.62 Billion |
| Market Size by 2032 | USD 50.75 Billion |
| CAGR | CAGR of 4.34% From 2024 to 2032 |
| Base Year | 2023 |
| Forecast Period | 2024-2032 |
| Historical Data | 2020-2022 |
| Report Scope & Coverage | Market Size, Segments Analysis, Competitive Landscape, Regional Analysis, DROC & SWOT Analysis, Forecast Outlook |
| Key Segments | • By Fleet Type (IMO 1, IMO 2, IMO 3) • By Product (Inland Chemical Tankers (1,000-4,999 DWT), Coastal Chemical Tankers (5,000-9,999 DWT), Deep-Sea Chemical Tankers (10,000-50,000 DWT)) • By Application (Organic Chemicals, Inorganic Chemicals, Vegetable Oils & Fats, Liquified Gases, Others) |
| Regional Analysis/Coverage | North America (US, Canada, Mexico), Europe (Eastern Europe [Poland, Romania, Hungary, Turkey, Rest of Eastern Europe] Western Europe] Germany, France, UK, Italy, Spain, Netherlands, Switzerland, Austria, Rest of Western Europe]), Asia Pacific (China, India, Japan, South Korea, Vietnam, Singapore, Australia, Rest of Asia Pacific), Middle East & Africa (Middle East [UAE, Egypt, Saudi Arabia, Qatar, Rest of Middle East], Africa [Nigeria, South Africa, Rest of Africa], Latin America (Brazil, Argentina, Colombia, Rest of Latin America) |
| Company Profiles | Mitsui O.S.K. Lines, Ltd., Scorpio Tankers Inc., Nordic American Tankers Ltd., Odfjell SE, Capital Product Partners L.P., International Seaways, Inc., Hafnia Limited, Team Tankers International Ltd., Bahri, Euronav NV, Maersk Tankers, Navig8 Chemical Tankers, Tsakos Energy Navigation Ltd., Frontline Ltd., Stolt-Nielsen Limited, DHT Holdings, Inc., Top Ships Inc., Ardmore Shipping Corporation, MISC Berhad, TORM plc. |
Ans: The Chemical Tankers Market is expected to grow at a CAGR of 4.34% during 2024-2032.
Ans: The Chemical Tankers Market was USD 34.62 billion in 2023 and is expected to reach USD 50.75 billion by 2032.
Ans: The rising demand for chemicals across pharmaceuticals, agriculture, and manufacturing is driving the need for efficient and advanced chemical transportation solutions.
Ans: The “IMO 2” segment dominated the Chemical Tankers Market.
Ans: North America dominated the Chemical Tankers Market in 2023.
Table of Contents:
1. Introduction
1.1 Market Definition
1.2 Scope (Inclusion and Exclusions)
1.3 Research Assumptions
2. Executive Summary
2.1 Market Overview
2.2 Regional Synopsis
2.3 Competitive Summary
3. Research Methodology
3.1 Top-Down Approach
3.2 Bottom-up Approach
3.3. Data Validation
3.4 Primary Interviews
4. Market Dynamics
4.1 Market Analysis
4.1.1 Drivers
4.1.2 Restraints
4.1.3 Opportunities
4.1.4 Challenges
4.2 PESTLE Analysis
4.3 Porter’s Five Forces Model
5. Statistical Insights and Trend Reporting
5.1 Fleet Size & Capacity, by Region (2020-2023)
5.2 Utilization Rates, by Region (2020-2023)
5.3 Vessel Downtime & Maintenance Metrics
5.4 Technological Advancements & Adoption Rates, by Region
5.5 Export/Import Volume of Chemicals, by Region (2023)
5.6 Tanker Charter Rates, by Type (2020-2023)
6. Competitive Landscape
6.1 List of Major Companies, By Region
6.2 Market Share Analysis, By Region
6.3 Product Benchmarking
6.3.1 Product specifications and features
6.3.2 Pricing
6.4 Strategic Initiatives
6.4.1 Marketing and promotional activities
6.4.2 Distribution and Supply Chain Strategies
6.4.3 Expansion plans and new product launches
6.4.4 Strategic partnerships and collaborations
6.5 Technological Advancements
6.6 Market Positioning and Branding
7. Chemical Tankers Market Segmentation, By Fleet Type
7.1 Chapter Overview
7.2 IMO 1
7.2.1 IMO 1 Market Trends Analysis (2020-2032)
7.2.2 IMO 1 Market Size Estimates and Forecasts to 2032 (USD Billion)
7.3 IMO 2
7.3.1 IMO 2 Market Trends Analysis (2020-2032)
7.3.2 IMO 2 Market Size Estimates and Forecasts to 2032 (USD Billion)
7.4 IMO 3
7.4.1 IMO 3 Market Trends Analysis (2020-2032)
7.4.2 IMO 3 Market Size Estimates and Forecasts to 2032 (USD Billion)
8. Chemical Tankers Market Segmentation, By Product
8.1 Chapter Overview
8.2 Inland Chemical Tankers (1,000-4,999 DWT)
8.2.1 Inland Chemical Tankers (1,000-4,999 DWT) Market Trends Analysis (2020-2032)
8.2.2 Inland Chemical Tankers (1,000-4,999 DWT) Market Size Estimates and Forecasts to 2032 (USD Billion)
8.3 Coastal Chemical Tankers (5,000-9,999 DWT)
8.3.1 Coastal Chemical Tankers (5,000-9,999 DWT) Market Trends Analysis (2020-2032)
8.3.2 Coastal Chemical Tankers (5,000-9,999 DWT) Market Size Estimates and Forecasts to 2032 (USD Billion)
8.4 Deep-Sea Chemical Tankers (10,000-50,000 DWT)
8.4.1 Deep-Sea Chemical Tankers (10,000-50,000 DWT) Market Trends Analysis (2020-2032)
8.4.2 Deep-Sea Chemical Tankers (10,000-50,000 DWT) Market Size Estimates and Forecasts to 2032 (USD Billion)
9. Chemical Tankers Market Segmentation, By Application
9.1 Chapter Overview
9.2 Organic Chemicals
9.2.1 Organic Chemicals Market Trends Analysis (2020-2032)
9.2.2 Organic Chemicals Market Size Estimates and Forecasts to 2032 (USD Billion)
9.3 Inorganic Chemicals
9.3.1 Inorganic Chemicals Market Trends Analysis (2020-2032)
9.3.2 Inorganic Chemicals Market Size Estimates and Forecasts to 2032 (USD Billion)
9.4 Vegetable Oils & Fats
9.3.1 Vegetable Oils & Fats Market Trends Analysis (2020-2032)
9.3.2 Vegetable Oils & Fats Market Size Estimates and Forecasts to 2032 (USD Billion)
9.5 Liquified Gases
9.3.1 Liquified Gases Market Trends Analysis (2020-2032)
9.3.2 Liquified Gases Market Size Estimates and Forecasts to 2032 (USD Billion)
9.6 Others
9.3.1 Others Market Trends Analysis (2020-2032)
9.3.2 Others Market Size Estimates and Forecasts to 2032 (USD Billion)
10. Regional Analysis
10.1 Chapter Overview
10.2 North America
10.2.1 Trends Analysis
10.2.2 North America Chemical Tankers Market Estimates and Forecasts, by Country (2020-2032) (USD Billion)
10.2.3 North America Chemical Tankers Market Estimates and Forecasts, By Fleet Type (2020-2032) (USD Billion)
10.2.4 North America Chemical Tankers Market Estimates and Forecasts, By Product (2020-2032) (USD Billion)
10.2.5 North America Chemical Tankers Market Estimates and Forecasts, By Application (2020-2032) (USD Billion)
10.2.6 USA
10.2.6.1 USA Chemical Tankers Market Estimates and Forecasts, By Fleet Type (2020-2032) (USD Billion)
10.2.6.2 USA Chemical Tankers Market Estimates and Forecasts, By Product (2020-2032) (USD Billion)
10.2.6.3 USA Chemical Tankers Market Estimates and Forecasts, By Application (2020-2032) (USD Billion)
10.2.7 Canada
10.2.7.1 Canada Chemical Tankers Market Estimates and Forecasts, By Fleet Type (2020-2032) (USD Billion)
10.2.7.2 Canada Chemical Tankers Market Estimates and Forecasts, By Product (2020-2032) (USD Billion)
10.2.7.3 Canada Chemical Tankers Market Estimates and Forecasts, By Application (2020-2032) (USD Billion)
10.2.8 Mexico
10.2.8.1 Mexico Chemical Tankers Market Estimates and Forecasts, By Fleet Type (2020-2032) (USD Billion)
10.2.8.2 Mexico Chemical Tankers Market Estimates and Forecasts, By Product (2020-2032) (USD Billion)
10.2.8.3 Mexico Chemical Tankers Market Estimates and Forecasts, By Application (2020-2032) (USD Billion)
10.3 Europe
10.3.1 Eastern Europe
10.3.1.1 Trends Analysis
10.3.1.2 Eastern Europe Chemical Tankers Market Estimates and Forecasts, by Country (2020-2032) (USD Billion)
10.3.1.3 Eastern Europe Chemical Tankers Market Estimates and Forecasts, By Fleet Type (2020-2032) (USD Billion)
10.3.1.4 Eastern Europe Chemical Tankers Market Estimates and Forecasts, By Product (2020-2032) (USD Billion)
10.3.1.5 Eastern Europe Chemical Tankers Market Estimates and Forecasts, By Application (2020-2032) (USD Billion)
10.3.1.6 Poland
10.3.1.6.1 Poland Chemical Tankers Market Estimates and Forecasts, By Fleet Type (2020-2032) (USD Billion)
10.3.1.6.2 Poland Chemical Tankers Market Estimates and Forecasts, By Product (2020-2032) (USD Billion)
10.3.1.6.3 Poland Chemical Tankers Market Estimates and Forecasts, By Application (2020-2032) (USD Billion)
10.3.1.7 Romania
10.3.1.7.1 Romania Chemical Tankers Market Estimates and Forecasts, By Fleet Type (2020-2032) (USD Billion)
10.3.1.7.2 Romania Chemical Tankers Market Estimates and Forecasts, By Product (2020-2032) (USD Billion)
10.3.1.7.3 Romania Chemical Tankers Market Estimates and Forecasts, By Application (2020-2032) (USD Billion)
10.3.1.8 Hungary
10.3.1.8.1 Hungary Chemical Tankers Market Estimates and Forecasts, By Fleet Type (2020-2032) (USD Billion)
10.3.1.8.2 Hungary Chemical Tankers Market Estimates and Forecasts, By Product (2020-2032) (USD Billion)
10.3.1.8.3 Hungary Chemical Tankers Market Estimates and Forecasts, By Application (2020-2032) (USD Billion)
10.3.1.9 Turkey
10.3.1.9.1 Turkey Chemical Tankers Market Estimates and Forecasts, By Fleet Type (2020-2032) (USD Billion)
10.3.1.9.2 Turkey Chemical Tankers Market Estimates and Forecasts, By Product (2020-2032) (USD Billion)
10.3.1.9.3 Turkey Chemical Tankers Market Estimates and Forecasts, By Application (2020-2032) (USD Billion)
10.3.1.10 Rest of Eastern Europe
10.3.1.10.1 Rest of Eastern Europe Chemical Tankers Market Estimates and Forecasts, By Fleet Type (2020-2032) (USD Billion)
10.3.1.10.2 Rest of Eastern Europe Chemical Tankers Market Estimates and Forecasts, By Product (2020-2032) (USD Billion)
10.3.1.10.3 Rest of Eastern Europe Chemical Tankers Market Estimates and Forecasts, By Application (2020-2032) (USD Billion)
10.3.2 Western Europe
10.3.2.1 Trends Analysis
10.3.2.2 Western Europe Chemical Tankers Market Estimates and Forecasts, by Country (2020-2032) (USD Billion)
10.3.2.3 Western Europe Chemical Tankers Market Estimates and Forecasts, By Fleet Type (2020-2032) (USD Billion)
10.3.2.4 Western Europe Chemical Tankers Market Estimates and Forecasts, By Product (2020-2032) (USD Billion)
10.3.2.5 Western Europe Chemical Tankers Market Estimates and Forecasts, By Application (2020-2032) (USD Billion)
10.3.2.6 Germany
10.3.2.6.1 Germany Chemical Tankers Market Estimates and Forecasts, By Fleet Type (2020-2032) (USD Billion)
10.3.2.6.2 Germany Chemical Tankers Market Estimates and Forecasts, By Product (2020-2032) (USD Billion)
10.3.2.6.3 Germany Chemical Tankers Market Estimates and Forecasts, By Application (2020-2032) (USD Billion)
10.3.2.7 France
10.3.2.7.1 France Chemical Tankers Market Estimates and Forecasts, By Fleet Type (2020-2032) (USD Billion)
10.3.2.7.2 France Chemical Tankers Market Estimates and Forecasts, By Product (2020-2032) (USD Billion)
10.3.2.7.3 France Chemical Tankers Market Estimates and Forecasts, By Application (2020-2032) (USD Billion)
10.3.2.8 UK
10.3.2.8.1 UK Chemical Tankers Market Estimates and Forecasts, By Fleet Type (2020-2032) (USD Billion)
10.3.2.8.2 UK Chemical Tankers Market Estimates and Forecasts, By Product (2020-2032) (USD Billion)
10.3.2.8.3 UK Chemical Tankers Market Estimates and Forecasts, By Application (2020-2032) (USD Billion)
10.3.2.9 Italy
10.3.2.9.1 Italy Chemical Tankers Market Estimates and Forecasts, By Fleet Type (2020-2032) (USD Billion)
10.3.2.9.2 Italy Chemical Tankers Market Estimates and Forecasts, By Product (2020-2032) (USD Billion)
10.3.2.9.3 Italy Chemical Tankers Market Estimates and Forecasts, By Application (2020-2032) (USD Billion)
10.3.2.10 Spain
10.3.2.10.1 Spain Chemical Tankers Market Estimates and Forecasts, By Fleet Type (2020-2032) (USD Billion)
10.3.2.10.2 Spain Chemical Tankers Market Estimates and Forecasts, By Product (2020-2032) (USD Billion)
10.3.2.10.3 Spain Chemical Tankers Market Estimates and Forecasts, By Application (2020-2032) (USD Billion)
10.3.2.11 Netherlands
10.3.2.11.1 Netherlands Chemical Tankers Market Estimates and Forecasts, By Fleet Type (2020-2032) (USD Billion)
10.3.2.11.2 Netherlands Chemical Tankers Market Estimates and Forecasts, By Product (2020-2032) (USD Billion)
10.3.2.11.3 Netherlands Chemical Tankers Market Estimates and Forecasts, By Application (2020-2032) (USD Billion)
10.3.2.12 Switzerland
10.3.2.12.1 Switzerland Chemical Tankers Market Estimates and Forecasts, By Fleet Type (2020-2032) (USD Billion)
10.3.2.12.2 Switzerland Chemical Tankers Market Estimates and Forecasts, By Product (2020-2032) (USD Billion)
10.3.2.12.3 Switzerland Chemical Tankers Market Estimates and Forecasts, By Application (2020-2032) (USD Billion)
10.3.2.13 Austria
10.3.2.13.1 Austria Chemical Tankers Market Estimates and Forecasts, By Fleet Type (2020-2032) (USD Billion)
10.3.2.13.2 Austria Chemical Tankers Market Estimates and Forecasts, By Product (2020-2032) (USD Billion)
10.3.2.13.3 Austria Chemical Tankers Market Estimates and Forecasts, By Application (2020-2032) (USD Billion)
10.3.2.14 Rest of Western Europe
10.3.2.14.1 Rest of Western Europe Chemical Tankers Market Estimates and Forecasts, By Fleet Type (2020-2032) (USD Billion)
10.3.2.14.2 Rest of Western Europe Chemical Tankers Market Estimates and Forecasts, By Product (2020-2032) (USD Billion)
10.3.2.14.3 Rest of Western Europe Chemical Tankers Market Estimates and Forecasts, By Application (2020-2032) (USD Billion)
10.4 Asia-Pacific
10.4.1 Trends Analysis
10.4.2 Asia-Pacific Chemical Tankers Market Estimates and Forecasts, by Country (2020-2032) (USD Billion)
10.4.3 Asia-Pacific Chemical Tankers Market Estimates and Forecasts, By Fleet Type (2020-2032) (USD Billion)
10.4.4 Asia-Pacific Chemical Tankers Market Estimates and Forecasts, By Product (2020-2032) (USD Billion)
10.4.5 Asia-Pacific Chemical Tankers Market Estimates and Forecasts, By Application (2020-2032) (USD Billion)
10.4.6 China
10.4.6.1 China Chemical Tankers Market Estimates and Forecasts, By Fleet Type (2020-2032) (USD Billion)
10.4.6.2 China Chemical Tankers Market Estimates and Forecasts, By Product (2020-2032) (USD Billion)
10.4.6.3 China Chemical Tankers Market Estimates and Forecasts, By Application (2020-2032) (USD Billion)
10.4.7 India
10.4.7.1 India Chemical Tankers Market Estimates and Forecasts, By Fleet Type (2020-2032) (USD Billion)
10.4.7.2 India Chemical Tankers Market Estimates and Forecasts, By Product (2020-2032) (USD Billion)
10.4.7.3 India Chemical Tankers Market Estimates and Forecasts, By Application (2020-2032) (USD Billion)
10.4.8 Japan
10.4.8.1 Japan Chemical Tankers Market Estimates and Forecasts, By Fleet Type (2020-2032) (USD Billion)
10.4.8.2 Japan Chemical Tankers Market Estimates and Forecasts, By Product (2020-2032) (USD Billion)
10.4.8.3 Japan Chemical Tankers Market Estimates and Forecasts, By Application (2020-2032) (USD Billion)
10.4.9 South Korea
10.4.9.1 South Korea Chemical Tankers Market Estimates and Forecasts, By Fleet Type (2020-2032) (USD Billion)
10.4.9.2 South Korea Chemical Tankers Market Estimates and Forecasts, By Product (2020-2032) (USD Billion)
10.4.9.3 South Korea Chemical Tankers Market Estimates and Forecasts, By Application (2020-2032) (USD Billion)
10.4.10 Vietnam
10.4.10.1 Vietnam Chemical Tankers Market Estimates and Forecasts, By Fleet Type (2020-2032) (USD Billion)
10.4.10.2 Vietnam Chemical Tankers Market Estimates and Forecasts, By Product (2020-2032) (USD Billion)
10.4.10.3 Vietnam Chemical Tankers Market Estimates and Forecasts, By Application (2020-2032) (USD Billion)
10.4.11 Singapore
10.4.11.1 Singapore Chemical Tankers Market Estimates and Forecasts, By Fleet Type (2020-2032) (USD Billion)
10.4.11.2 Singapore Chemical Tankers Market Estimates and Forecasts, By Product (2020-2032) (USD Billion)
10.4.11.3 Singapore Chemical Tankers Market Estimates and Forecasts, By Application (2020-2032) (USD Billion)
10.4.12 Australia
10.4.12.1 Australia Chemical Tankers Market Estimates and Forecasts, By Fleet Type (2020-2032) (USD Billion)
10.4.12.2 Australia Chemical Tankers Market Estimates and Forecasts, By Product (2020-2032) (USD Billion)
10.4.12.3 Australia Chemical Tankers Market Estimates and Forecasts, By Application (2020-2032) (USD Billion)
10.4.13 Rest of Asia-Pacific
10.4.13.1 Rest of Asia-Pacific Chemical Tankers Market Estimates and Forecasts, By Fleet Type (2020-2032) (USD Billion)
10.4.13.2 Rest of Asia-Pacific Chemical Tankers Market Estimates and Forecasts, By Product (2020-2032) (USD Billion)
10.4.13.3 Rest of Asia-Pacific Chemical Tankers Market Estimates and Forecasts, By Application (2020-2032) (USD Billion)
10.5 Middle East and Africa
10.5.1 Middle East
10.5.1.1 Trends Analysis
10.5.1.2 Middle East Chemical Tankers Market Estimates and Forecasts, by Country (2020-2032) (USD Billion)
10.5.1.3 Middle East Chemical Tankers Market Estimates and Forecasts, By Fleet Type (2020-2032) (USD Billion)
10.5.1.4 Middle East Chemical Tankers Market Estimates and Forecasts, By Product (2020-2032) (USD Billion)
10.5.1.5 Middle East Chemical Tankers Market Estimates and Forecasts, By Application (2020-2032) (USD Billion)
10.5.1.6 UAE
10.5.1.6.1 UAE Chemical Tankers Market Estimates and Forecasts, By Fleet Type (2020-2032) (USD Billion)
10.5.1.6.2 UAE Chemical Tankers Market Estimates and Forecasts, By Product (2020-2032) (USD Billion)
10.5.1.6.3 UAE Chemical Tankers Market Estimates and Forecasts, By Application (2020-2032) (USD Billion)
10.5.1.7 Egypt
10.5.1.7.1 Egypt Chemical Tankers Market Estimates and Forecasts, By Fleet Type (2020-2032) (USD Billion)
10.5.1.7.2 Egypt Chemical Tankers Market Estimates and Forecasts, By Product (2020-2032) (USD Billion)
10.5.1.7.3 Egypt Chemical Tankers Market Estimates and Forecasts, By Application (2020-2032) (USD Billion)
10.5.1.8 Saudi Arabia
10.5.1.8.1 Saudi Arabia Chemical Tankers Market Estimates and Forecasts, By Fleet Type (2020-2032) (USD Billion)
10.5.1.8.2 Saudi Arabia Chemical Tankers Market Estimates and Forecasts, By Product (2020-2032) (USD Billion)
10.5.1.8.3 Saudi Arabia Chemical Tankers Market Estimates and Forecasts, By Application (2020-2032) (USD Billion)
10.5.1.9 Qatar
10.5.1.9.1 Qatar Chemical Tankers Market Estimates and Forecasts, By Fleet Type (2020-2032) (USD Billion)
10.5.1.9.2 Qatar Chemical Tankers Market Estimates and Forecasts, By Product (2020-2032) (USD Billion)
10.5.1.9.3 Qatar Chemical Tankers Market Estimates and Forecasts, By Application (2020-2032) (USD Billion)
10.5.1.10 Rest of Middle East
10.5.1.10.1 Rest of Middle East Chemical Tankers Market Estimates and Forecasts, By Fleet Type (2020-2032) (USD Billion)
10.5.1.10.2 Rest of Middle East Chemical Tankers Market Estimates and Forecasts, By Product (2020-2032) (USD Billion)
10.5.1.10.3 Rest of Middle East Chemical Tankers Market Estimates and Forecasts, By Application (2020-2032) (USD Billion)
10.5.2 Africa
10.5.2.1 Trends Analysis
10.5.2.2 Africa Chemical Tankers Market Estimates and Forecasts, by Country (2020-2032) (USD Billion)
10.5.2.3 Africa Chemical Tankers Market Estimates and Forecasts, By Fleet Type (2020-2032) (USD Billion)
10.5.2.4 Africa Chemical Tankers Market Estimates and Forecasts, By Product (2020-2032) (USD Billion)
10.5.2.5 Africa Chemical Tankers Market Estimates and Forecasts, By Application (2020-2032) (USD Billion)
10.5.2.6 South Africa
10.5.2.6.1 South Africa Chemical Tankers Market Estimates and Forecasts, By Fleet Type (2020-2032) (USD Billion)
10.5.2.6.2 South Africa Chemical Tankers Market Estimates and Forecasts, By Product (2020-2032) (USD Billion)
10.5.2.6.3 South Africa Chemical Tankers Market Estimates and Forecasts, By Application (2020-2032) (USD Billion)
10.5.2.7 Nigeria
10.5.2.7.1 Nigeria Chemical Tankers Market Estimates and Forecasts, By Fleet Type (2020-2032) (USD Billion)
10.5.2.7.2 Nigeria Chemical Tankers Market Estimates and Forecasts, By Product (2020-2032) (USD Billion)
10.5.2.7.3 Nigeria Chemical Tankers Market Estimates and Forecasts, By Application (2020-2032) (USD Billion)
10.5.2.8 Rest of Africa
10.5.2.8.1 Rest of Africa Chemical Tankers Market Estimates and Forecasts, By Fleet Type (2020-2032) (USD Billion)
10.5.2.8.2 Rest of Africa Chemical Tankers Market Estimates and Forecasts, By Product (2020-2032) (USD Billion)
10.5.2.8.3 Rest of Africa Chemical Tankers Market Estimates and Forecasts, By Application (2020-2032) (USD Billion)
10.6 Latin America
10.6.1 Trends Analysis
10.6.2 Latin America Chemical Tankers Market Estimates and Forecasts, by Country (2020-2032) (USD Billion)
10.6.3 Latin America Chemical Tankers Market Estimates and Forecasts, By Fleet Type (2020-2032) (USD Billion)
10.6.4 Latin America Chemical Tankers Market Estimates and Forecasts, By Product (2020-2032) (USD Billion)
10.6.5 Latin America Chemical Tankers Market Estimates and Forecasts, By Application (2020-2032) (USD Billion)
10.6.6 Brazil
10.6.6.1 Brazil Chemical Tankers Market Estimates and Forecasts, By Fleet Type (2020-2032) (USD Billion)
10.6.6.2 Brazil Chemical Tankers Market Estimates and Forecasts, By Product (2020-2032) (USD Billion)
10.6.6.3 Brazil Chemical Tankers Market Estimates and Forecasts, By Application (2020-2032) (USD Billion)
10.6.7 Argentina
10.6.7.1 Argentina Chemical Tankers Market Estimates and Forecasts, By Fleet Type (2020-2032) (USD Billion)
10.6.7.2 Argentina Chemical Tankers Market Estimates and Forecasts, By Product (2020-2032) (USD Billion)
10.6.7.3 Argentina Chemical Tankers Market Estimates and Forecasts, By Application (2020-2032) (USD Billion)
10.6.8 Colombia
10.6.8.1 Colombia Chemical Tankers Market Estimates and Forecasts, By Fleet Type (2020-2032) (USD Billion)
10.6.8.2 Colombia Chemical Tankers Market Estimates and Forecasts, By Product (2020-2032) (USD Billion)
10.6.8.3 Colombia Chemical Tankers Market Estimates and Forecasts, By Application (2020-2032) (USD Billion)
10.6.9 Rest of Latin America
10.6.9.1 Rest of Latin America Chemical Tankers Market Estimates and Forecasts, By Fleet Type (2020-2032) (USD Billion)
10.6.9.2 Rest of Latin America Chemical Tankers Market Estimates and Forecasts, By Product (2020-2032) (USD Billion)
10.6.9.3 Rest of Latin America Chemical Tankers Market Estimates and Forecasts, By Application (2020-2032) (USD Billion)
11. Company Profiles
11.1 Mitsui O.S.K. Lines, Ltd.
11.1.1 Company Overview
11.1.2 Financial
11.1.3 Products/ Services Offered
11.1.4 SWOT Analysis
11.2 Scorpio Tankers Inc.
11.2.1 Company Overview
11.2.2 Financial
11.2.3 Products/ Services Offered
11.2.4 SWOT Analysis
11.3 Nordic American Tankers Ltd.
11.3.1 Company Overview
11.3.2 Financial
11.3.3 Products/ Services Offered
11.3.4 SWOT Analysis
11.4 Odfjell SE
11.4.1 Company Overview
11.4.2 Financial
11.4.3 Products/ Services Offered
11.4.4 SWOT Analysis
11.5 Capital Product Partners L.P.
11.5.1 Company Overview
11.5.2 Financial
11.5.3 Products/ Services Offered
11.5.4 SWOT Analysis
11.6 International Seaways, Inc.
11.6.1 Company Overview
11.6.2 Financial
11.6.3 Products/ Services Offered
11.6.4 SWOT Analysis
11.7 Hafnia Limited
11.7.1 Company Overview
11.7.2 Financial
11.7.3 Products/ Services Offered
11.7.4 SWOT Analysis
11.8 Team Tankers International Ltd.
11.8.1 Company Overview
11.8.2 Financial
11.8.3 Products/ Services Offered
11.8.4 SWOT Analysis
11.9 Bahri (The National Shipping Company of Saudi Arabia)
11.9.1 Company Overview
11.9.2 Financial
11.9.3 Products/ Services Offered
11.9.4 SWOT Analysis
11.10 Euronav NV
11.10.1 Company Overview
11.10.2 Financial
11.10.3 Products/ Services Offered
11.10.4 SWOT Analysis
12. Use Cases and Best Practices
13. Conclusion
An accurate research report requires proper strategizing as well as implementation. There are multiple factors involved in the completion of good and accurate research report and selecting the best methodology to compete the research is the toughest part. Since the research reports we provide play a crucial role in any company’s decision-making process, therefore we at SNS Insider always believe that we should choose the best method which gives us results closer to reality. This allows us to reach at a stage wherein we can provide our clients best and accurate investment to output ratio.
Each report that we prepare takes a timeframe of 350-400 business hours for production. Starting from the selection of titles through a couple of in-depth brain storming session to the final QC process before uploading our titles on our website we dedicate around 350 working hours. The titles are selected based on their current market cap and the foreseen CAGR and growth.
The 5 steps process:
Step 1: Secondary Research:
Secondary Research or Desk Research is as the name suggests is a research process wherein, we collect data through the readily available information. In this process we use various paid and unpaid databases which our team has access to and gather data through the same. This includes examining of listed companies’ annual reports, Journals, SEC filling etc. Apart from this our team has access to various associations across the globe across different industries. Lastly, we have exchange relationships with various university as well as individual libraries.

Step 2: Primary Research
When we talk about primary research, it is a type of study in which the researchers collect relevant data samples directly, rather than relying on previously collected data. This type of research is focused on gaining content specific facts that can be sued to solve specific problems. Since the collected data is fresh and first hand therefore it makes the study more accurate and genuine.
We at SNS Insider have divided Primary Research into 2 parts.
Part 1 wherein we interview the KOLs of major players as well as the upcoming ones across various geographic regions. This allows us to have their view over the market scenario and acts as an important tool to come closer to the accurate market numbers. As many as 45 paid and unpaid primary interviews are taken from both the demand and supply side of the industry to make sure we land at an accurate judgement and analysis of the market.
This step involves the triangulation of data wherein our team analyses the interview transcripts, online survey responses and observation of on filed participants. The below mentioned chart should give a better understanding of the part 1 of the primary interview.

Part 2: In this part of primary research the data collected via secondary research and the part 1 of the primary research is validated with the interviews from individual consultants and subject matter experts.
Consultants are those set of people who have at least 12 years of experience and expertise within the industry whereas Subject Matter Experts are those with at least 15 years of experience behind their back within the same space. The data with the help of two main processes i.e., FGDs (Focused Group Discussions) and IDs (Individual Discussions). This gives us a 3rd party nonbiased primary view of the market scenario making it a more dependable one while collation of the data pointers.
Step 3: Data Bank Validation
Once all the information is collected via primary and secondary sources, we run that information for data validation. At our intelligence centre our research heads track a lot of information related to the market which includes the quarterly reports, the daily stock prices, and other relevant information. Our data bank server gets updated every fortnight and that is how the information which we collected using our primary and secondary information is revalidated in real time.

Step 4: QA/QC Process
After all the data collection and validation our team does a final level of quality check and quality assurance to get rid of any unwanted or undesired mistakes. This might include but not limited to getting rid of the any typos, duplication of numbers or missing of any important information. The people involved in this process include technical content writers, research heads and graphics people. Once this process is completed the title gets uploader on our platform for our clients to read it.
Step 5: Final QC/QA Process:
This is the last process and comes when the client has ordered the study. In this process a final QA/QC is done before the study is emailed to the client. Since we believe in giving our clients a good experience of our research studies, therefore, to make sure that we do not lack at our end in any way humanly possible we do a final round of quality check and then dispatch the study to the client.
Key Segments:
By Fleet Type
IMO 1
IMO 2
IMO 3
By Product
Inland Chemical Tankers (1,000-4,999 DWT)
Coastal Chemical Tankers (5,000-9,999 DWT)
Deep-Sea Chemical Tankers (10,000-50,000 DWT)
By Application
Organic Chemicals
Inorganic Chemicals
Vegetable Oils & Fats
Liquified Gases
Others
Request for Segment Customization as per your Business Requirement: Segment Customization Request
Regional Coverage:
North America
US
Canada
Mexico
Europe
Eastern Europe
Poland
Romania
Hungary
Turkey
Rest of Eastern Europe
Western Europe
Germany
France
UK
Italy
Spain
Netherlands
Switzerland
Austria
Rest of Western Europe
Asia Pacific
China
India
Japan
South Korea
Vietnam
Singapore
Australia
Rest of Asia Pacific
Middle East & Africa
Middle East
UAE
Egypt
Saudi Arabia
Qatar
Rest of Middle East
Africa
Nigeria
South Africa
Rest of Africa
Latin America
Brazil
Argentina
Colombia
Rest of Latin America
Request for Country Level Research Report: Country Level Customization Request
Available Customization
With the given market data, SNS Insider offers customization as per the company’s specific needs. The following customization options are available for the report:
Detailed Volume Analysis
Criss-Cross segment analysis (e.g. Product X Application)
Competitive Product Benchmarking
Geographic Analysis
Additional countries in any of the regions
Customized Data Representation
Detailed analysis and profiling of additional market players
Synthetic Paper Market was valued at USD 909.12 million in 2023 and is expected to reach USD 2023.96 million by 2032, growing at a CAGR of 9.50% from 2024-2032.
The Lubricant Additives Market size was valued at USD 17.58 Billion in 2023 & will grow to USD 25.01 Billion by 2032 and grow at a CAGR of 4% by 2024-2032.
Flat Steel Market was USD 548.17 billion in 2023 and is expected to reach USD 903.23 billion by 2032, growing at a CAGR of 5.71% from 2024 to 2032.
The Adipic Acid Market size was valued at USD 5.20 billion in 2023. It is estimated to hit USD 7.46 billion by 2032 and grow at a CAGR of 4.09% over the forecast period of 2024-2032.
The Adhesive Tapes Market Size was valued at USD 81.5 billion in 2023 and is expected to reach USD 134.6 billion by 2032 and grow at a CAGR of 5.8% over the forecast period 2024-2032.
The UV Curable Resins & Formulated Products Market Size was USD 5.5 billion in 2023 & will reach to $12.8 Bn by 2032 & grow at a CAGR of 9.9% by 2024-2032.

Hi! Click one of our member below to chat on Phone
© 2025 All Rights Reserved by SNS Insider Pvt Ltd


