image

Chemical Injection Skids Market Report Scope & Overview:
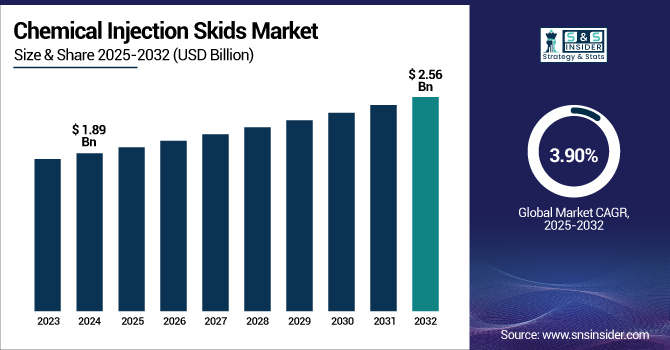
The chemical injection skids market size was valued at USD 1.89 billion in 2024 and is expected to reach USD 2.56 billion by 2032, with a growing CAGR of 3.90% over the forecast period of 2025-2032.

Chemical injection skids play an important role in applications such as oil and gas production, petrochemicals, and water treatment, which, in turn, is a driver for the growth of the global market. These systems enable accurate dosages of chemicals that lead to ingredients running more efficiently and safely. Moreover, a much stronger demand is seen, especially in the regions with high rates of energy exploration and production, such as the Middle East, North America, and Africa. Progress in automation and integration of smart control and analytics is accelerating the uptake of these solutions.

The Indian market for industrial water treatment is shooting up fast, owing to the rising demand for effective treatment processes. Accelerating trends of urbanization and population have resulted in significant investments in water infrastructure, and chemical injection skids represent a crucial aspect of these investments. To ensure the safety of public health and meet standards for environmental compliance, cities, such as Delhi are implementing these systems for better chemical dosing in water treatment plants.

For instance, government programs, such as the Jal Jeevan Mission and AMRUT, are making substantial investments in water infrastructure, boosting the demand for advanced treatment technologies, including chemical injection skids.

Market Dynamics:

Drivers:

  • Technological Advancements and Global Oilfield Challenges Drive the Chemical Injection Skids Market Growth

Chemical injection skids in the oil and gas sector contribute significantly toward the growth of the market by optimizing production and enhancing oil recovery. Chemical injection skids are the equipment used to inject precise amounts of chemicals into the wells so that corrosion, scaling, and hydrate formation are avoided, as they can significantly impact efficiency and safety. The surge in labor required from aging oil fields and the need for enhanced oil recovery (EOR) methods has created a growing demand for more sophisticated chemical injection systems. Inflation and expansion of oil and gas operations globally have further fueled the need for skids that can accommodate the challenges of deepwater and remote operations. The growth of the market is driven by technological developments, such as automation and integration of IoT, which facilitate monitoring and maintenance. The continued adoption of chemical injection skids is likely to grow as companies look for more sustainable and cost-effective production practices.

For instance, in June 2024, Zhejiang Ailipu Technology Co., Ltd. began mass production of advanced chemical injection skids for a Middle Eastern oilfield. These skids prevent hydrate formation by injecting chemicals, such as methanol and ethylene glycol, featuring high-precision components and meeting API 675 standards with ±0.5% accuracy.

  • Water Scarcity and Quality Concerns Boost Demand for Precise Chemical Injection Skids Globally

The rise in global awareness of water scarcity and the need to efficiently manage water quality is also responsible for increasing the adoption of chemical injection skids in the water & wastewater treatment sectors. With increasing populations and a growing threat of environmental pressures, it is critical to harness water resources efficiently. To ensure that water treatment meets high-quality requirements, chemical injection skids are needed to dose the coagulants, disinfectants, and pH adjusters precisely. By providing accurate chemical feed rates, these systems help to minimize chemical waste and to optimize treatment and efficiency. Moreover, the increasing focus on sustainable and eco-friendly treatment of water propels the demand for advanced dosing systems. Chemical injection skids have also become an integral part of any municipality, industry, and utility company's efforts to provide clean and safe water and protect our environment.

Restraints:

  • High Need of Specialized Expertise for Chemical Injection Skids Can Hinder Market Expansion

Operational complexity can be a major restraining factor as even simple chemical injection skids have complex systems that integrate within large systems, and are complicated to set up and operate day to day. Some of these skids can be complex in nature and require specialized skills and expertise for ensuring proper calibration, functioning, and installation. It normally consists of advanced components, including pumps, control systems, and piping, among others that must work together seamlessly to deliver accurate chemical doses. This leads to requiring sophisticated operators trained in chemical processes, control, and mechanics to run the systems.

Besides, as downtime cannot be afforded, it still must have regular maintenance and undergo preventive troubleshooting to keep the system for life. Such complexity can be challenging for small companies with little technical staff or resources available to adopt or maintain these systems, which is a major barrier. In certain scenarios, the requirement for specialized training and expertise results in elevated operational costs, making the chemical injection skids non-attractive to smaller organizations.

  • Stringent Regulations and High Costs Can Impede Market Growth

​Demand compliance with strict regulations can stimulate growth in chemical injection skids market. Stringent regulation compliance is one of the key drivers for increasing costs and innovation in the chemical injection skids market. Manufacturers need to comply with changing safety and environmental standards, such as REACH regulation of the EU and the Hazardous Waste Management Rules in India. Such regulations require constant investment in R&D, process optimization, and compliance management. Massive firms, such as BASF spend enormous sums dealing with documentation and compliance processes.

Further, the gradual reduction of free carbon emissions allowances and enforcement of expanded banned chemicals lists in places including the EU also ramp up operating costs. As a result, chemical injection skid manufacturers are forced to innovate and make their systems both effective and compliant with strict environmental regulations.

For instance, in April 2025, the European Chemical Industry Council (CEFIC) reported that the European Union's increased environmental regulations are imposing an annual cost of over USD 20 billion on global chemical companies.

For instance, in August 2023, the Enforcement Directorate (ED) of India attached ₹90 lakh in fixed deposits of Sree Venkateshwara Industries for illegal disposal of hazardous waste, violating anti-pollution laws. The action followed a complaint from the Telangana State Pollution Control Board, revealing proceeds of crime linked to improper waste management.

Segmentation Analysis:

By Function

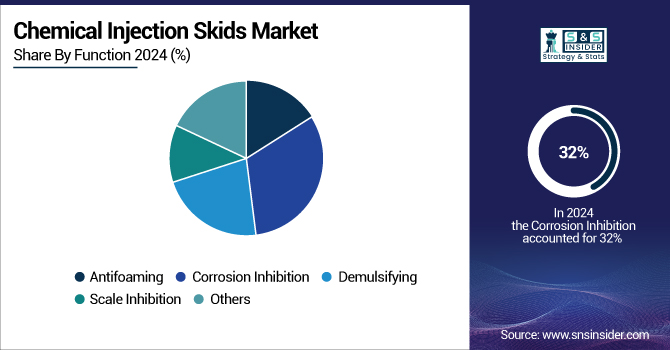
The corrosion inhibition segment dominated with over 32% chemical injection skids market share in 2024 due to its critical role in preventing damage to equipment and infrastructure. In industries, such as oil and gas, chemical processing, and water treatment, the assets must endure corrosive environments caused by harsh chemicals, extreme temperatures, and high-pressure conditions. If corrosion is not prevented, it can cause debilitating damage, making machinery less effective or operational, leading to leaks, and risking safety. To prevent these risks, chemical injection skids are used to inject corrosion inhibitors that create barriers on the metal surfaces that prevent corrosion. It plays an essential role in the prevention of operational disruptions, maintenance costs, and safety and lifespan of industrial equipment operating in corrosive environments.

The demulsifying function in the chemical injection skids market is experiencing rapid growth. The segment’s expansion is driven by the presence of water-oil emulsions in crude oil extraction, refining,  and transportation, which is a global problem, and these emulsions adversely affect the efficiency of operation due to the high viscosity and cause corrosion of the instruments. Demulsifying agents are employed to cleave such emulsions, thereby separating water from oil and reducing processing time, and enhancing production quality. With a sharper global oil appetite and tighter regulatory controls on water contamination, the development of suitable and effective demulsifying agents is a fast-emerging function and, thus, heralds the fastest-growing function in the chemical injection skids market.

By End-Use

The oil & gas segment held the largest market share of over 32% in 2023 owing to its extensive application across various oil and gas operations. Chemical injection skids play an important role in increasing oil recovery, maximizing production processes, and optimizing chemical handling during drilling, production, and refining to be safe and more effectively directed. These are the skids that allow for precise chemical dosing, which is crucial to prevent problems, such as corrosion, scaling, and hydrate blockage in pipelines and equipment. This sector witnesses an increase in the adoption of chemical infusion skids, owing to an increase in demand for oil and gas coupled with the need for optimized production and better recovery techniques. Thus, the Oil & Gas sector still holds the biggest market share.

The chemical & petrochemical segment is the fastest growing in the market due to the increasing demand for efficient and precise chemical dosing in industrial processes. With the expansion of these industries, the necessity to automate refining, production, and the quality and safety of the manufacturing process, has become an increasing need globally. The skids are used to control intra-process chemicals, such as polymerization control, reaction control, corrosion inhibition, and other scenarios requiring process continuity and product quality. Also, increasing emphasis on environment-related regulations and sustainability, which drives the need to minimize waste and optimize the usage of chemicals, further propelling the product demand.

Regional Analysis:

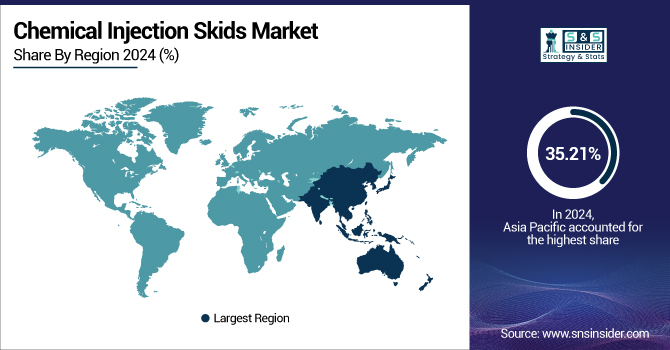
In 2024, Asia Pacific held the dominant position in the global chemical injection skids market with a share of 35.21% and is also the fastest-growing region. Fast industrialization, particularly in China, India, and Southeast Asia, is primarily driving this dominance, along with the demand for efficient fluid handling and chemical dosing systems. Market growth is also supported by the increasing oil & gas sector in the region, integrated with high investments in infrastructure development for water treatment and power generation.

In 2024, North America accounts for 29.67% of the chemical injection skids market and is the second-largest regional market, primarily supported by the presence of advanced industrial infrastructure and a mature oil & gas sector in the U.S. and Canada. The area is characterized by extensive energy infrastructure development, strict environmental regulations, and a greater emphasis on operational efficiency and process automation in chemical processing and wastewater treatment.

In 2024, the U.S. market was valued at USD 0.43 billion, and it is projected to reach USD 0.57 billion by 2032, growing at a CAGR of 3.80%. Backed by rising investments in oil & gas infrastructure, growing demand for process automation, and the emergence of stringent environmental regulations about precision dosing systems, the steady growth is expected to continue.

Canada’s market is poised for significant growth with a CAGR of 4.85% till 2032. The growth is driven by modernization in the energy sector, coupled with the increasing utilization of automated injection systems, particularly in offshore and remote operations, that drives this momentum.

Mexico’s market is steadily expanding with a CAGR of 3.80% owing to the ongoing rejuvenation of its energy sector and the government activities for strategic infrastructure reforms in the country. As this market is relatively small now, it is relatively stable, driven by industrial growth and becoming more prominent within the refining and petrochemical sectors, where the need for proper chemical management is rising rapidly.

Europe holds a significant share in the market driven by a strong industrial base and stringent regulatory standards for environmental safety and chemical handling. High Process Control and Automation is giving high market share to countries, such as Germany, the U.K., and France. Based on region, the increasing emphasis on environmentally friendly and energy-efficient industrial solutions drives the adoption of accurate chemical injection systems in oil & gas, water treatment, and food processing applications.

Key players:

The leading players in the chemical injection skids market are IDEX Corporation, Petronash, AES Arabia Ltd., SPX FLOW Inc., Milton Roy Company, INTECH, Lewa GmbH, Integrated Flow Solutions LLC, Petroserve International, and Carotek Inc.

Recent Developments:

  • In October 2023: Milton Roy, a brand of Ingersoll Rand, secured a multi-million USD contract with NALCO (National Aluminum Company) to supply 24 agitators for the expansion of NALCO's alumina refinery in Damanjodi, Odisha, India. These agitators are crucial for the chemical processes involved in alumina production. 

  • In April 2024: IDEX Corporation reported its Q1 2024 financial results, highlighting a 6% increase in operating cash flow (USD 157 million) compared to the previous year. The company also projected full-year organic sales growth between 0% to 2%, indicating steady performance in its fluid and metering technologies segment. ​

Chemical Injection Skids Market Report Scope

Report Attributes Details
Market Size in 2024 USD 1.89 Billion
Market Size by 2032 USD 2.56 Billion
CAGR CAGR of 3.89% From 2025 to 2032
Base Year 2024
Forecast Period 2025-2032
Historical Data 2021-2023
Report Scope & Coverage Market Size, Segments Analysis, Competitive  Landscape, Regional Analysis, DROC & SWOT Analysis, Forecast Outlook
Key Segments • By Function (Antifoaming, Corrosion Inhibition, Demulsifying, Scale Inhibition, Others)
• By End Use (Oil & Gas, Energy & Power, Fertilizer, Chemical & Petrochemical, Water Supply and Water Treatment, Pharmaceutical, Others)
Regional Analysis/Coverage North America (US, Canada, Mexico), Europe (Germany, France, UK, Italy, Spain, Poland, Turkey, Rest of Europe), Asia Pacific (China, India, Japan, South Korea, Singapore, Australia, Rest of Asia Pacific), Middle East & Africa (UAE, Saudi Arabia, Qatar, South Africa, Rest of Middle East & Africa), Latin America (Brazil, Argentina, Rest of Latin America)
Company Profiles IDEX Corporation, Petronash, AES Arabia Ltd., SPX FLOW Inc., Milton Roy Company, INTECH, Lewa GmbH, Integrated Flow Solutions LLC, Petroserve International, Carotek Inc.

Frequently Asked Questions

Ans:  The Chemical Injection Skids Market is expected to grow at a CAGR of 3.90% from 2025-2032.

Ans: The Chemical Injection Skids Market was USD 1.89 billion in 2024 and is expected to reach USD 2.56 billion by 2032.

Ans: Chemical injection skids optimize production, enhance oil recovery, and prevent corrosion and scaling in the oil and gas sector.

Ans: The “Corrosion Inhibition” segment dominated the Chemical Injection Skids Market.

Ans: The Asia-Pacific region dominated the Chemical Injection Skids Market in 2024.


Table of Contents

1. Introduction

1.1 Market Definition

1.2 Scope (Inclusion and Exclusions)

1.3 Research Assumptions

2. Executive Summary

2.1 Market Overview

2.2 Regional Synopsis

2.3 Competitive Summary

3. Research Methodology

3.1 Top-Down Approach

3.2 Bottom-up Approach

3.3. Data Validation

3.4 Primary Interviews

4. Market Dynamics Impact Analysis

4.1 Market Driving Factors Analysis

4.1.2 Drivers

4.1.2 Restraints

4.1.3 Opportunities

4.1.4 Challenges

    1. PESTLE Analysis

4.3 Porter’s Five Forces Model

5. Statistical Insights and Trends Reporting

5.1 Capacity Utilization Rates, by Region (2020-2023)

5.2 Operational Downtime and Efficiency Metrics

5.3 Technological Adoption and Innovation Rates, by Region

5.4 Export/Import Trends, by Region (2023)

5.5 Regulatory and Compliance Trends, by Region

6. Competitive Landscape

6.1 List of Major Companies, By Region

6.2 Market Share Analysis, By Region

6.3 Product Benchmarking

6.3.1 Product specifications and features

6.3.2 Pricing

6.4 Strategic Initiatives

6.4.1 Marketing and promotional activities

6.4.2 Distribution and supply chain strategies

6.4.3 Expansion plans and new product launches

6.4.4 Strategic partnerships and collaborations

6.5 Technological Advancements

6.6 Market Positioning and Branding

7. Chemical Injection Skids Market Segmentation, by Function

7.1 Chapter Overview

7.2 Antifoaming

7.2.1 Antifoaming Market Trends Analysis (2020-2032)

7.2.2 Antifoaming Market Size Estimates and Forecasts to 2032 (USD Billion)

7.2 Corrosion Inhibition

7.2.1 Corrosion Inhibition Market Trends Analysis (2020-2032)

7.2.2 Corrosion Inhibition Market Size Estimates and Forecasts to 2032 (USD Billion)

7.3 Demulsifying

7.3.1 Demulsifying Market Trends Analysis (2020-2032)

7.3.2 Demulsifying Market Size Estimates and Forecasts to 2032 (USD Billion)

7.4 Scale Inhibition

7.4.1 Scale Inhibition Market Trends Analysis (2020-2032)

7.4.2 Scale Inhibition Market Size Estimates and Forecasts to 2032 (USD Billion)

7.5 Others

7.5.1 Others Market Trends Analysis (2020-2032)

7.5.2 Others Market Size Estimates and Forecasts to 2032 (USD Billion)

8. Chemical Injection Skids Market Segmentation, by End Use

8.1 Chapter Overview

8.2 Oil & Gas

8.2.1 Oil & Gas Market Trends Analysis (2020-2032)

8.2.2 Oil & Gas Market Size Estimates and Forecasts to 2032 (USD Billion)

 8.3 Energy & power

8.3.1 Energy & Power Market Trends Analysis (2020-2032)

8.3.2 Energy & Power Market Size Estimates and Forecasts to 2032 (USD Billion)

8.4 Fertilizer

8.4.1 Fertilizer Market Trends Analysis (2020-2032)

8.4.2 Fertilizer Market Size Estimates and Forecasts to 2032 (USD Billion)

8.5 Chemical & petrochemical

8.5.1 Chemical & petrochemical Market Trends Analysis (2020-2032)

8.5.2 Chemical & petrochemical Market Size Estimates and Forecasts to 2032 (USD Billion)

8.6 Water supply and water treatment

8.6.1 Water supply and water treatment Market Trends Analysis (2020-2032)

8.6.2 Water supply and water treatment Market Size Estimates and Forecasts to 2032 (USD Billion)

8.7 Pharmaceutical

8.7.1 Pharmaceutical Market Trends Analysis (2020-2032)

8.7.2 Pharmaceutical Market Size Estimates and Forecasts to 2032 (USD Billion)

8.8 Others

8.7.1 Other Market Trends Analysis (2020-2032)

8.7.2 Other Market Size Estimates and Forecasts to 2032 (USD Billion)

9. Regional Analysis

     9.1 Chapter Overview

     9.2 North America

9.2.1 Trends Analysis

9.2.2 North America Chemical Injection Skids Market Estimates and Forecasts, by Country (2021-2032) (USD Billion)

9.2.3 North America Chemical Injection Skids Market Estimates and Forecasts, By Function (2021-2032) (USD Billion) 

9.2.4 North America Chemical Injection Skids Market Estimates and Forecasts, By End Use (2021-2032) (USD Billion)

9.2.5 USA

9.2.5.1 USA Chemical Injection Skids Market Estimates and Forecasts, By Function (2021-2032) (USD Billion)

9.2.5.2 USA Chemical Injection Skids Market Estimates and Forecasts, By End Use (2021-2032) (USD Billion)

9.2.6 Canada

9.2.6.1 Canada Chemical Injection Skids Market Estimates and Forecasts, By Function (2021-2032) (USD Billion)

9.2.6.2 Canada Chemical Injection Skids Market Estimates and Forecasts, By End Use (2021-2032) (USD Billion)

9.2.7 Mexico

9.2.7.1 Mexico Chemical Injection Skids Market Estimates and Forecasts, By Function (2021-2032) (USD Billion)

9.2.7.2 Mexico Chemical Injection Skids Market Estimates and Forecasts, By End Use (2021-2032) (USD Billion)

9.3 Europe

9.3.1 Trends Analysis

9.3.2 Europe Chemical Injection Skids Market Estimates and Forecasts, by Country (2021-2032) (USD Billion)

9.3.3 Europe Chemical Injection Skids Market Estimates and Forecasts, By Function (2021-2032) (USD Billion) 

9.3.4 Europe Chemical Injection Skids Market Estimates and Forecasts, By End Use (2021-2032) (USD Billion)

9.3.5 Germany

9.3.5.1 Germany Chemical Injection Skids Market Estimates and Forecasts, By Function (2021-2032) (USD Billion)

9.3.5.2 Germany Chemical Injection Skids Market Estimates and Forecasts, By End Use (2021-2032) (USD Billion)

9.3.6 France

9.3.6.1 France Chemical Injection Skids Market Estimates and Forecasts, By Function (2021-2032) (USD Billion)

9.3.6.2 France Chemical Injection Skids Market Estimates and Forecasts, By End Use (2021-2032) (USD Billion)

9.3.7 UK

9.3.7.1 UK Chemical Injection Skids Market Estimates and Forecasts, By Function (2021-2032) (USD Billion)

9.3.7.2 UK Chemical Injection Skids Market Estimates and Forecasts, By End Use (2021-2032) (USD Billion)

9.3.8 Italy

9.3.8.1 Italy Chemical Injection Skids Market Estimates and Forecasts, By Function (2021-2032) (USD Billion)

9.3.8.2 Italy Chemical Injection Skids Market Estimates and Forecasts, By End Use (2021-2032) (USD Billion)

9.3.9 Spain

9.3.9.1 Spain Chemical Injection Skids Market Estimates and Forecasts, By Function (2021-2032) (USD Billion)

9.3.9.2 Spain Chemical Injection Skids Market Estimates and Forecasts, By End Use (2021-2032) (USD Billion)

9.3.10 Poland

9.3.10.1 Poland Chemical Injection Skids Market Estimates and Forecasts, By Function (2021-2032) (USD Billion)

9.3.10.2 Poland Chemical Injection Skids Market Estimates and Forecasts, By End Use (2021-2032) (USD Billion)

9.3.11 Turkey

9.3.11.1 Turkey Chemical Injection Skids Market Estimates and Forecasts, By Function (2021-2032) (USD Billion)

9.3.11.2 Turkey Chemical Injection Skids Market Estimates and Forecasts, By End Use (2021-2032) (USD Billion)

9.3.12 Rest of Europe

9.3.12.1 Rest of Europe Chemical Injection Skids Market Estimates and Forecasts, By Function (2021-2032) (USD Billion)

9.3.12.2 Rest of Europe Chemical Injection Skids Market Estimates and Forecasts, By End Use (2021-2032) (USD Billion)

9.4 Asia Pacific

9.4.1 Trends Analysis

9.4.2 Asia Pacific Chemical Injection Skids Market Estimates and Forecasts, by Country (2021-2032) (USD Billion)

9.4.3 Asia Pacific Chemical Injection Skids Market Estimates and Forecasts, By Function (2021-2032) (USD Billion) 

9.4.4 Asia Pacific Chemical Injection Skids Market Estimates and Forecasts, By End Use (2021-2032) (USD Billion)

9.4.5 China

9.4.5.1 China Chemical Injection Skids Market Estimates and Forecasts, By Function (2021-2032) (USD Billion)

9.4.5.2 China Chemical Injection Skids Market Estimates and Forecasts, By End Use (2021-2032) (USD Billion)

9.4.6 India

9.4.5.1 India Chemical Injection Skids Market Estimates and Forecasts, By Function (2021-2032) (USD Billion)

9.4.5.2 India Chemical Injection Skids Market Estimates and Forecasts, By End Use (2021-2032) (USD Billion)

9.4.5 Japan

9.4.5.1 Japan Chemical Injection Skids Market Estimates and Forecasts, By Function (2021-2032) (USD Billion)

9.4.5.2 Japan Chemical Injection Skids Market Estimates and Forecasts, By End Use (2021-2032) (USD Billion)

9.4.6 South Korea

9.4.6.1 South Korea Chemical Injection Skids Market Estimates and Forecasts, By Function (2021-2032) (USD Billion)

9.4.6.2 South Korea Chemical Injection Skids Market Estimates and Forecasts, By End Use (2021-2032) (USD Billion)

9.4.7 Singapore

9.4.7.1 Singapore Chemical Injection Skids Market Estimates and Forecasts, By Function (2021-2032) (USD Billion)

9.4.7.2 Singapore Chemical Injection Skids Market Estimates and Forecasts, By End Use (2021-2032) (USD Billion)

8.4.8 Australia

8.4.8.1 Australia Chemical Injection Skids Market Estimates and Forecasts, By Function (2021-2032) (USD Billion)

8.4.8.2 Australia Chemical Injection Skids Market Estimates and Forecasts, By End Use (2021-2032) (USD Billion)

9.4.9 Rest of Asia Pacific

9.4.9.1 Rest of Asia Pacific Chemical Injection Skids Market Estimates and Forecasts, By Function (2021-2032) (USD Billion)

9.4.9.2 Rest of Asia Pacific Chemical Injection Skids Market Estimates and Forecasts, By End Use (2021-2032) (USD Billion)

9.5 Middle East & Africa

9.5.1 Trends Analysis

9.5.2 Middle East & Africa Chemical Injection Skids Market Estimates and Forecasts, by Country (2021-2032) (USD Billion)

9.5.3 Middle East & Africa Chemical Injection Skids Market Estimates and Forecasts, By Function (2021-2032) (USD Billion) 

9.5.4 Middle East & Africa Chemical Injection Skids Market Estimates and Forecasts, By End Use (2021-2032) (USD Billion)

9.5.5 UAE

9.5.5.1 UAE Chemical Injection Skids Market Estimates and Forecasts, By Function (2021-2032) (USD Billion)

9.5.5.2 UAE Chemical Injection Skids Market Estimates and Forecasts, By End Use (2021-2032) (USD Billion)

9.5.6 Saudi Arabia

9.5.6.1 Saudi Arabia Chemical Injection Skids Market Estimates and Forecasts, By Function (2021-2032) (USD Billion)

9.5.6.2 Saudi Arabia Chemical Injection Skids Market Estimates and Forecasts, By End Use (2021-2032) (USD Billion)

9.5.7 Qatar

9.5.7.1 Qatar Chemical Injection Skids Market Estimates and Forecasts, By Function (2021-2032) (USD Billion)

9.5.7.2 Qatar Chemical Injection Skids Market Estimates and Forecasts, By End Use (2021-2032) (USD Billion)

9.5.8 South Africa

9.5.8.1 South Africa Chemical Injection Skids Market Estimates and Forecasts, By Function (2021-2032) (USD Billion)

9.5.8.2 South Africa Chemical Injection Skids Market Estimates and Forecasts, By End Use (2021-2032) (USD Billion)

9.5.9 Middle East & Africa

9.5.9.1 Middle East & Africa Chemical Injection Skids Market Estimates and Forecasts, By Function (2021-2032) (USD Billion)

9.5.9.2 Middle East & Africa Chemical Injection Skids Market Estimates and Forecasts, By End Use (2021-2032) (USD Billion)

9.6 Latin America

9.6.1 Trends Analysis

9.6.2 Latin America Chemical Injection Skids Market Estimates and Forecasts, by Country (2021-2032) (USD Billion)

9.6.3 Latin America Chemical Injection Skids Market Estimates and Forecasts, By Function (2021-2032) (USD Billion) 

9.6.4 Latin America Chemical Injection Skids Market Estimates and Forecasts, By End Use (2021-2032) (USD Billion)

9.6.5 Brazil

9.6.5.1 Brazil Chemical Injection Skids Market Estimates and Forecasts, By Function (2021-2032) (USD Billion)

9.6.5.2 Brazil Chemical Injection Skids Market Estimates and Forecasts, By End Use (2021-2032) (USD Billion)

9.6.6 Argentina

9.6.6.1 Argentina Chemical Injection Skids Market Estimates and Forecasts, By Function (2021-2032) (USD Billion)

9.6.6.2 Argentina Chemical Injection Skids Market Estimates and Forecasts, By End Use (2021-2032) (USD Billion)

9.6.7 Rest of Latin America

9.6.7.1 Rest of Latin America Chemical Injection Skids Market Estimates and Forecasts, By Function (2021-2032) (USD Billion)

9.6.7.2 Rest of Latin America Chemical Injection Skids Market Estimates and Forecasts, By End Use (2021-2032) (USD Billion)

10. Company Profiles

10.1 INTECH

10.1.1 Company Overview

10.1.2 Financial

10.1.3 Products/ Services Offered

110.1.4 SWOT Analysis

10.2 IDEX Corporation

10.2.1 Company Overview

10.2.2 Financial

10.2.3 Products/ Services Offered

10.2.4 SWOT Analysis

10.3 Lewa GmbH

              10.3.1 Company Overview

10.3.2 Financial

10.3.3 Products/ Services Offered

10.3.4 SWOT Analysis

10.4 Carotek Inc.

 10.4.1 Company Overview

10.4.2 Financial

10.4.3 Products/ Services Offered

10.4.4 SWOT Analysis

10.5 SPX FLOW Inc.

              10.5.1 Company Overview

10.5.2 Financial

10.5.3 Products/ Services Offered

10.5.4 SWOT Analysis

10.6 Integrated Flow Solutions LLC

10.6.1 Company Overview

10.6.2 Financial

10.6.3 Products/ Services Offered

10.6.4 SWOT Analysis

10.7 AES Arabia Ltd.

              10.7.1 Company Overview

10.7.2 Financial

10.7.3 Products/ Services Offered

10.7.4 SWOT Analysis

10.8 Petroserve International

              10.8.1 Company Overview

10.8.2 Financial

10.8.3 Products/ Services Offered

10.8.4 SWOT Analysis

10.9 Milton Roy Company

10.9.1 Company Overview

10.9.2 Financial

10.9.3 Products/ Services Offered

10.9.4 SWOT Analysis

10.10 Petronash

             10.9.1 Company Overview

10.9.2 Financial

10.9.3 Products/ Services Offered

10.9.4 SWOT Analysis

11. Use Cases and Best Practices

12. Conclusion

An accurate research report requires proper strategizing as well as implementation. There are multiple factors involved in the completion of good and accurate research report and selecting the best methodology to compete the research is the toughest part. Since the research reports we provide play a crucial role in any company’s decision-making process, therefore we at SNS Insider always believe that we should choose the best method which gives us results closer to reality. This allows us to reach at a stage wherein we can provide our clients best and accurate investment to output ratio.

Each report that we prepare takes a timeframe of 350-400 business hours for production. Starting from the selection of titles through a couple of in-depth brain storming session to the final QC process before uploading our titles on our website we dedicate around 350 working hours. The titles are selected based on their current market cap and the foreseen CAGR and growth.


The 5 steps process:

Step 1: Secondary Research:

Secondary Research or Desk Research is as the name suggests is a research process wherein, we collect data through the readily available information. In this process we use various paid and unpaid databases which our team has access to and gather data through the same. This includes examining of listed companies’ annual reports, Journals, SEC filling etc. Apart from this our team has access to various associations across the globe across different industries. Lastly, we have exchange relationships with various university as well as individual libraries.

Secondary Research

Step 2: Primary Research

When we talk about primary research, it is a type of study in which the researchers collect relevant data samples directly, rather than relying on previously collected data.  This type of research is focused on gaining content specific facts that can be sued to solve specific problems. Since the collected data is fresh and first hand therefore it makes the study more accurate and genuine.

We at SNS Insider have divided Primary Research into 2 parts.

Part 1 wherein we interview the KOLs of major players as well as the upcoming ones across various geographic regions. This allows us to have their view over the market scenario and acts as an important tool to come closer to the accurate market numbers. As many as 45 paid and unpaid primary interviews are taken from both the demand and supply side of the industry to make sure we land at an accurate judgement and analysis of the market.

This step involves the triangulation of data wherein our team analyses the interview transcripts, online survey responses and observation of on filed participants. The below mentioned chart should give a better understanding of the part 1 of the primary interview.

Primary Research

Part 2: In this part of primary research the data collected via secondary research and the part 1 of the primary research is validated with the interviews from individual consultants and subject matter experts.

Consultants are those set of people who have at least 12 years of experience and expertise within the industry whereas Subject Matter Experts are those with at least 15 years of experience behind their back within the same space. The data with the help of two main processes i.e., FGDs (Focused Group Discussions) and IDs (Individual Discussions). This gives us a 3rd party nonbiased primary view of the market scenario making it a more dependable one while collation of the data pointers.

Step 3: Data Bank Validation

Once all the information is collected via primary and secondary sources, we run that information for data validation. At our intelligence centre our research heads track a lot of information related to the market which includes the quarterly reports, the daily stock prices, and other relevant information. Our data bank server gets updated every fortnight and that is how the information which we collected using our primary and secondary information is revalidated in real time.

Data Bank Validation

Step 4: QA/QC Process

After all the data collection and validation our team does a final level of quality check and quality assurance to get rid of any unwanted or undesired mistakes. This might include but not limited to getting rid of the any typos, duplication of numbers or missing of any important information. The people involved in this process include technical content writers, research heads and graphics people. Once this process is completed the title gets uploader on our platform for our clients to read it.

Step 5: Final QC/QA Process:

This is the last process and comes when the client has ordered the study. In this process a final QA/QC is done before the study is emailed to the client. Since we believe in giving our clients a good experience of our research studies, therefore, to make sure that we do not lack at our end in any way humanly possible we do a final round of quality check and then dispatch the study to the client.

Key Segments:

By Function

  • Antifoaming

  • Corrosion Inhibition

  • Demulsifying

  • Scale Inhibition

  • Others

By End Use

  • Oil & Gas

  • Energy & power

  • Fertilizer

  • Chemical & petrochemical

  • Water supply and water treatment

  • Pharmaceutical

  • Others

Request for Segment Customization as per your Business Requirement: Segment Customization Request

Regional Coverage: 

North America

  • US

  • Canada

  • Mexico

Europe

  • Germany

  • France

  • UK

  • Italy

  • Spain

  • Poland

  • Turkey

  • Rest of Europe

Asia Pacific

  • China

  • India

  • Japan

  • South Korea

  • Singapore

  • Australia

  • Rest of Asia Pacific

Middle East & Africa

  • UAE

  • Saudi Arabia

  • Qatar

  • South Africa

  • Rest of Middle East & Africa

Latin America

  • Brazil

  • Argentina

  • Rest of Latin America

Request for Country Level Research Report: Country Level Customization Request

Available Customization 

With the given market data, SNS Insider offers customization as per the company’s specific needs. The following customization options are available for the report: 

  • Detailed Volume Analysis 

  • Criss-Cross segment analysis (e.g. Product X Application) 

  • Competitive Product Benchmarking 

  • Geographic Analysis 

  • Additional countries in any of the regions 

  • Customized Data Representation 

  • Detailed analysis and profiling of additional market players


  •            5000 (33% Discount)


  •            8950 (40% Discount)


  •            3050 (23% Discount)

Start a Conversation

Hi! Click one of our member below to chat on Phone