Get More Information on Chemical as a Service Market - Request Sample Report
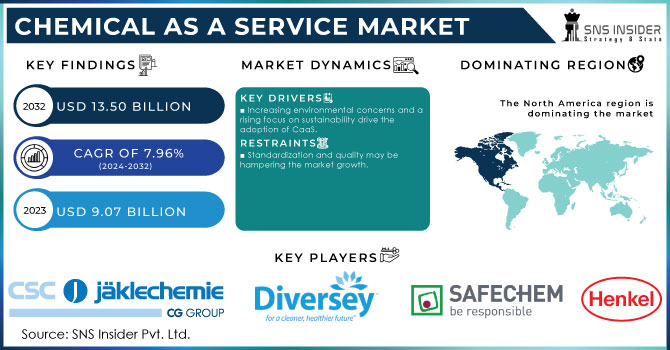
The Chemical as a Service Market Size was valued at USD 9.07 billion in 2023 and is expected to reach USD 13.50 billion by 2032 and grow at a CAGR of 7.96% over the forecast period 2024-2032.
Environmental responsibility is a major driving force, as chemical as a service models promote efficient chemical usage, minimizing waste and environmental impact. Furthermore, it offers compelling economic advantages. By leasing chemicals instead of purchasing them outright, companies can reduce upfront costs and simplify management. This can translate to substantial cost savings in the long run
Chemical service providers handle the complexities of storage, disposal, and liability, allowing users to concentrate on their core operations. Finally, chemical as a service provider often boasts expert knowledge on chemical selection, application, and best practices. This expertise can be invaluable for users, helping them optimize their chemical usage and achieve greater efficiency.
According to the Department of Chemicals and Petrochemicals, in India the government agencies' utilization of installed capacity for chemicals reduced from 79% in 2020 to 72 percent in 2021, and for petrochemicals, it reduced from around 90% to 84 percent. A decrease in chemical consumption is expected to raise the chemicals as a service market growth.
The chemical as a service market is an emerging concept in the industry, and still establishing. The number of companies offering these services on a global scale remains limited. The United Nations Industrial Development Organization (UNIDO) estimates only around 100 companies worldwide have embraced chemical leasing as part of their business model. While most chemical as a service provider currently operates at a local or regional level, a select few, like the US-based Diversey Holdings LTD., are successfully expanding their reach internationally. This limited global presence indicates a vast, unexplored market brimming with opportunity.
Developed markets, like the U.S., present a particularly fertile ground for chemicals as a service to grow. These regions boast established industries that are heavily reliant on chemicals automotive, fertilizer, and general chemical production. These industries stand to gain significant benefits from the cost-saving and efficiency-enhancing advantages of chemicals as a service. Therefore, these benefits may increase the chemical as a service market growth.
Drivers
Increasing environmental concerns and a rising focus on sustainability drive the adoption of CaaS.
The flow is turning towards environmental responsibility, and the chemical as a service model is rising as a sustainability space. Chemical as a service plays a role in efficient chemical usage, a critical factor in curbing waste. Chemical service providers act as custodians of these resources, meticulously optimizing the amount of chemicals used throughout each step of the process. This meticulous minimization of waste translates directly to a reduced environmental impact for industries that are heavily reliant on chemicals.
As sustainability is at the top of the agenda across various sectors, chemical as a service positions itself as a powerful ally, aligning with the global movement towards an eco-friendly future. The escalating tide of environmental concerns and the ever-sharpening focus on sustainability are interim as a powerful thing that drives the adoption of chemical as a service model.
Chemical service providers act as reliable custodians, meticulously analyzing and optimizing the amount of chemicals used throughout each step of a process. This focus on minimizing waste translates directly to a reduced environmental footprint for industries that rely heavily on chemicals. As the imperative for sustainability takes center stage across numerous sectors, chemical as a service seamlessly aligns with this global movement towards an eco-friendly future. By offering a practical and potent solution, chemical as a service empowers companies to lessen their environmental impact.
Restrain
Standardization and quality may be hampering the market growth.
Ensuring consistent quality control in chemical as a service presents a unique hurdle. The outsourcing nature of the model can lead to inconsistencies if different service providers have varying quality control procedures. Additionally, users might have limited control over the process, raising concerns about meeting specific needs and achieving consistent quality.
By Application
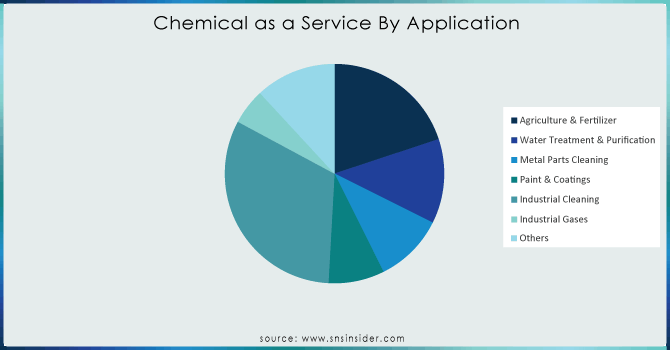
Industrial cleaning segment held the largest market share of the chemical as a service around 31.96% share in 2023, and is expected to keep growing in the upcoming years. The chemical as a service model is demonstrating its value beyond its initial venture into cleaning vessels, pipes, reactors, and metal parts. Industrial operators are increasingly recognizing the economic advantages and convenience offered by chemical as a service. Instead of the traditional model of purchasing chemicals and managing separate labor costs for cleaning, chemical as a service allows them to subscribe to a service that streamlines the process and has the potential to reduce overall expenses.
However, the agricultural and fertilizer segment is to become the fastest-growing sector within chemical as a service, this surge is propelled by the global expansion of the agricultural industry. As precision farming techniques and innovative technologies gain momentum, agriculturists are turning to new business models like chemical as a service. These services allow farmers to leverage a range of chemicals, including fertilizers, without the need for upfront purchases. By subscribing to chemical as a service, farmers not only benefit from expert application but also free up valuable time and resources previously dedicated to fertilizer application.
In essence, chemical as a service is evolving from a cleaning-centric solution into a versatile model that adapts to the changing needs of various industries such as, chemical services for water treatment. This win-win proposition is proving valuable for both industrial and agricultural sectors.
Need any customization research on chemical-as-a-service-market - Enquiry Now
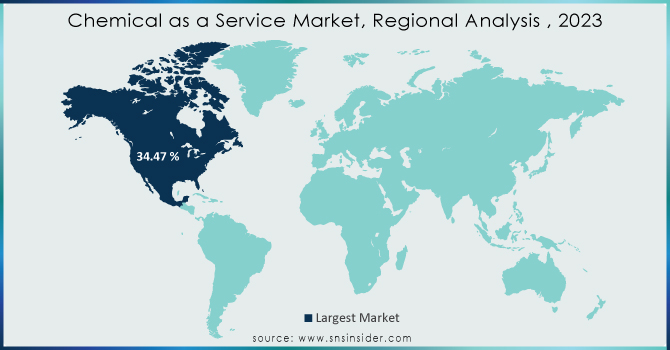
North America accounted for a major market share of approx. 34.47% in chemical as a service market in 2023. The United States presents a fertile landscape for the burgeoning chemical as a service market, driven by a powerful combination of chemical services factors. A basis of this growth is the presence of a well-established chemical industry within the U.S. This industry acts as a powerhouse, providing chemical as a service provider with a readily available pool of expertise and resources.
Furthermore, the U.S. boasts a thriving ecosystem of major players across diverse industries, such as automotive, aerospace, and healthcare. These industries are perfectly positioned to capitalize on the advantages of chemical as a service for applications like cleaning, washing, and degreasing metal parts in the coming years. The convenience, cost-effectiveness, and potential environmental benefits of chemical as a service make it an attractive proposition for U.S. industries seeking to streamline their operations and achieve greater efficiency.
Henkel AG & Co. KGaA, CSC JÄKLECHEMIE GmbH & Co. KG., Safechem Europe Gmbh, Diversey Holdings Ltd., Ecolab Inc., Polikem, BASF SE, Hydrotechnik, Haas TCM, PPG Industries, Quaker Chemical, Spheres, and Others.
In May 2023, Dow Chemical partnered with CAS to launched CAS ScifFinder-n, it optimizes searching for chemical molecules over 200 million compounds.
In May 2022, Sphera done a strategic partnership with BASF. This partnership focused to offer a comprehensive and automated solution to manufacturing and chemical companies and increase its product portfolio with accuracy, speed, and efficiency.
In May 2022, - ReliefWeb, a US-based humanitarian information source on international crises and disasters, estimates that every year, 380 billion cubic meters of municipal wastewater are produced worldwide. It is anticipated that wastewater production will rise by 24% by 2030 and 51% by 2050. Thus, the market for chemicals as services is growing as a result of the growing environmental issue.
| Report Attributes | Details |
| Market Size in 2023 | US$ 9.07 billion |
| Market Size by 2032 | US$ 13.50 Billion |
| CAGR | CAGR of 7.96 % From 2024 to 2032 |
| Base Year | 2023 |
| Forecast Period | 2024-2032 |
| Historical Data | 2020-2022 |
| Report Scope & Coverage | Market Size, Segments Analysis, Competitive Landscape, Regional Analysis, DROC & SWOT Analysis, Forecast Outlook |
| Key Segments | •By Application (Agriculture & Fertilizer, Paint & Coatings, Industrial Cleaning, Industrial Gases, Water Treatment & Purification, Metal Parts Cleaning, and Others) |
| Regional Analysis/Coverage | North America (US, Canada, Mexico), Europe (Eastern Europe [Poland, Romania, Hungary, Turkey, Rest of Eastern Europe] Western Europe] Germany, France, UK, Italy, Spain, Netherlands, Switzerland, Austria, Rest of Western Europe]), Asia Pacific (China, India, Japan, South Korea, Vietnam, Singapore, Australia, Rest of Asia Pacific), Middle East & Africa (Middle East [UAE, Egypt, Saudi Arabia, Qatar, Rest of Middle East], Africa [Nigeria, South Africa, Rest of Africa], Latin America (Brazil, Argentina, Colombia, Rest of Latin America) |
| Company Profiles | Henkel AG & Co. KGaA, CSC JÄKLECHEMIE GmbH & Co. KG., Safechem Europe Gmbh, Diversey Holdings Ltd., Ecolab Inc., Polikem, BASF SE, Hidrotecnik, Haas TCM, PPG Industries, Quaker Chemical, Spheres, and Others. |
| Key Drivers | • Increasing environmental concerns and a rising focus on sustainability drive the adoption of CaaS |
| RESTRAINTS | • Standardization and quality may be hampering the market growth. |
Ans: The Chemical as a Service Market was valued at USD 9.09 billion in 2023.
Ans: The expected CAGR of the global Chemical as a Service Market during the forecast period is 7.96%.
Ans: The Industry Cleaning will grow rapidly in the Chemical as a Service Market from 2024-2032.
Ans: Factors such as digital transformation in the chemical industry will be the growth of the Chemical as a Service Market.
Ans: The U.S. led the Chemical as a Service Market in North America region with highest revenue share in 2023.
TABLE OF CONTENTS
1. Introduction
1.1 Market Definition
1.2 Scope
1.3 Research Assumptions
2. Industry Flowchart
3. Research Methodology
4. Market Dynamics
4.1 Drivers
4.2 Restraints
4.3 Opportunities
4.4 Challenges
5. Porter’s 5 Forces Model
6. Pest Analysis
7. Chemical as a Service Market Segmentation, By Application
7.1 Introduction
7.2 Agriculture & Fertilizer
7.3 Water Treatment & Purification
7.4 Metal Parts Cleaning
7.5 Paint & Coatings
7.6 Industrial Cleaning
7.7 Industrial Gases
7.8 Others
8. Regional Analysis
8.1 Introduction
8.2 North America
8.2.1 Trend Analysis
8.2.2 North America Chemical as a Service Market By Country
8.2.3 North America Chemical as a Service Market Segmentation, By Application
8.2.4 USA
8.2.4.1 USA Chemical as a Service Market Segmentation, By Application
8.2.5 Canada
8.2.5.1 Canada Chemical as a Service Market Segmentation, By Application
8.2.6 Mexico
8.2.6.1 Mexico Chemical as a Service Market Segmentation, By Application
8.3 Europe
8.3.1 Trend Analysis
8.3.2 Eastern Europe
8.3.2.1 Eastern Europe Chemical as a Service Marke, By Country
8.3.2.2 Eastern Europe Chemical as a Service Market Segmentation, By Application
8.3.2.3 Poland
8.3.2.3.1 Poland Chemical as a Service Market Segmentation, By Application
8.3.2.4 Romania
8.3.2.4.1 Romania Chemical as a Service Market Segmentation, By Application
8.3.2.5 Hungary
8.3.2.5.1 Hungary Chemical as a Service Market Segmentation, By Application
8.3.2.6 Turkey
8.3.2.6.1 Turkey Chemical as a Service Market Segmentation, By Application
8.3.2.7 Rest of Eastern Europe
8.3.2.7.1 Rest of Eastern Europe Chemical as a Service Market Segmentation, By Application
8.3.3 Western Europe
8.3.3.1 Western Europe Chemical as a Service Market, By Country
8.3.3.2 Western Europe Chemical as a Service Market Segmentation, By Application
8.3.3.3 Germany
8.3.3.3.1 Germany Chemical as a Service Market Segmentation, By Application
8.3.3.4 France
8.3.3.4.1 France Chemical as a Service Market Segmentation, By Application
8.3.3.5 UK
8.3.3.5.1 UK Chemical as a Service Market Segmentation, By Application
8.3.3.6 Italy
8.3.3.6.1 Italy Chemical as a Service Market Segmentation, By Application
8.3.3.7 Spain
8.3.3.7.1 Spain Chemical as a Service Market Segmentation, By Application
8.3.3.8 Netherlands
8.3.3.8.1 Netherlands Chemical as a Service Market Segmentation, By Application
8.3.3.9 Switzerland
8.3.3.9.1 Switzerland Chemical as a Service Market Segmentation, By Application
8.3.3.10 Austria
8.3.3.10.1 Austria Chemical as a Service Market Segmentation, By Application
8.3.3.11 Rest of Western Europe
8.3.3.11.1 Rest of Western Europe Chemical as a Service Market Segmentation, By Application
8.4 Asia-Pacific
8.4.1 Trend Analysis
8.4.2 Asia-Pacific Chemical as a Service Market, By Country
8.4.3 Asia-Pacific Chemical as a Service Market Segmentation, By Application
8.4.4 China
8.4.4.1 China Chemical as a Service Market Segmentation, By Application
8.4.5 India
8.4.5.1 India Chemical as a Service Market Segmentation, By Application
8.4.6 Japan
8.4.6.1 Japan Chemical as a Service Market Segmentation, By Application
8.4.7 South Korea
8.4.7.1 South Korea Chemical as a Service Market Segmentation, By Application
8.4.8 Vietnam
8.4.8.1 Vietnam Chemical as a Service Market Segmentation, By Application
8.4.9 Singapore
8.4.9.1 Singapore Chemical as a Service Market Segmentation, By Application
8.4.10 Australia
8.4.10.1 Australia Chemical as a Service Market Segmentation, By Application
8.4.11 Rest of Asia-Pacific
8.4.11.1 Rest of Asia-Pacific Chemical as a Service Market Segmentation, By Application
8.5 Middle East & Africa
8.5.1 Trend Analysis
8.5.2 Middle East
8.5.2.1 Middle East Chemical as a Service Market, By Country
8.5.2.2 Middle East Chemical as a Service Market Segmentation, By Application
8.5.2.3 UAE
8.5.2.3.1 UAE Chemical as a Service Market Segmentation, By Application
8.5.2.4 Egypt
8.5.2.4.1 Egypt Chemical as a Service Market Segmentation, By Application
8.5.2.5 Saudi Arabia
8.5.2.5.1 Saudi Arabia Chemical as a Service Market Segmentation, By Application
8.5.2.6 Qatar
8.5.2.6.1 Qatar Chemical as a Service Market Segmentation, By Application
8.5.2.7 Rest of Middle East
8.5.2.7.1 Rest of Middle East Chemical as a Service Market Segmentation, By Application
8.5.3 Africa
8.5.3.1 Africa Chemical as a Service Market , By Country
8.5.3.2 Africa Chemical as a Service Market Segmentation, By Application
8.5.3.3 Nigeria
8.5.3.3.1 Nigeria Chemical as a Service Market Segmentation, By Application
8.5.3.4 South Africa
8.5.3.4.1 South Africa Chemical as a Service Market Segmentation, By Application
8.5.3.5 Rest of Africa
8.5.3.5.1 Rest of Africa Chemical as a Service Market Segmentation, By Application
8.6 Latin America
8.6.1 Trend Analysis
8.6.2 Latin America Chemical as a Service Market, By Country
8.6.3 Latin America Chemical as a Service Market Segmentation, By Application
8.6.4 Brazil
8.6.4.1 Brazil Chemical as a Service Market Segmentation, By Application
8.6.5 Argentina
8.6.5.1 Argentina Chemical as a Service Market Segmentation, By Application
8.6.6 Colombia
8.6.6.1 Colombia Chemical as a Service Market Segmentation, By Application
8.6.7 Rest of Latin America
8.6.7.1 Rest of Latin America Chemical as a Service Market Segmentation, By Application
BASF SE, Hidrotecnik, Haas TCM, PPG Industries, Quaker Chemical, Spheres, and Others.
9. Company Profiles
9.1 Henkel AG & Co. KGaA
9.1.1 Company Overview
9.1.2 Financial
9.1.3 Products/ Services Offered
9.1.4 The SNS View
9.2 CSC JÄKLECHEMIE GmbH & Co. KG
9.2.1 Company Overview
9.2.2 Financial
9.2.3 Products/ Services Offered
9.2.4 The SNS View
9.3 Safechem Europe Gmbh
9.3.1 Company Overview
9.3.2 Financial
9.3.3 Products/ Services Offered
9.3.4 The SNS View
9.4 Diversey Holdings Ltd
9.4.1 Company Overview
9.4.2 Financial
9.4.3 Products/ Services Offered
9.4.4 The SNS View
9.5 Ecolab Inc.
9.5.1 Company Overview
9.5.2 Financial
9.5.3 Products/ Services Offered
9.5.4 The SNS View
9.6 Polikem
9.6.1 Company Overview
9.6.2 Financial
9.6.3 Products/ Services Offered
9.6.4 The SNS View
13.7 BASF SE
9.7.1 Company Overview
9.7.2 Financial
9.7.3 Products/ Services Offered
9.7.4 The SNS View
9.8 Hidrotecnik
9.8.1 Company Overview
9.8.2 Financial
9.8.3 Products/ Services Offered
9.8.4 The SNS View
9.9 Haas TCM
9.9.1 Company Overview
9.9.2 Financial
9.9.3 Products/ Services Offered
9.9.4 The SNS View
9.10 Quaker Chemical
9.10.1 Company Overview
9.10.2 Financial
9.10.3 Products/ Services Offered
9.10.4 The SNS View
10. Competitive Landscape
10.1 Competitive Benchmarking
10.2 Market Share Analysis
10.3 Recent Developments
10.3.1 Industry News
10.3.2 Company News
10.3.3 Mergers & Acquisitions
11. Use Case and Best Practices
12. Conclusion
An accurate research report requires proper strategizing as well as implementation. There are multiple factors involved in the completion of good and accurate research report and selecting the best methodology to compete the research is the toughest part. Since the research reports we provide play a crucial role in any company’s decision-making process, therefore we at SNS Insider always believe that we should choose the best method which gives us results closer to reality. This allows us to reach at a stage wherein we can provide our clients best and accurate investment to output ratio.
Each report that we prepare takes a timeframe of 350-400 business hours for production. Starting from the selection of titles through a couple of in-depth brain storming session to the final QC process before uploading our titles on our website we dedicate around 350 working hours. The titles are selected based on their current market cap and the foreseen CAGR and growth.
The 5 steps process:
Step 1: Secondary Research:
Secondary Research or Desk Research is as the name suggests is a research process wherein, we collect data through the readily available information. In this process we use various paid and unpaid databases which our team has access to and gather data through the same. This includes examining of listed companies’ annual reports, Journals, SEC filling etc. Apart from this our team has access to various associations across the globe across different industries. Lastly, we have exchange relationships with various university as well as individual libraries.

Step 2: Primary Research
When we talk about primary research, it is a type of study in which the researchers collect relevant data samples directly, rather than relying on previously collected data. This type of research is focused on gaining content specific facts that can be sued to solve specific problems. Since the collected data is fresh and first hand therefore it makes the study more accurate and genuine.
We at SNS Insider have divided Primary Research into 2 parts.
Part 1 wherein we interview the KOLs of major players as well as the upcoming ones across various geographic regions. This allows us to have their view over the market scenario and acts as an important tool to come closer to the accurate market numbers. As many as 45 paid and unpaid primary interviews are taken from both the demand and supply side of the industry to make sure we land at an accurate judgement and analysis of the market.
This step involves the triangulation of data wherein our team analyses the interview transcripts, online survey responses and observation of on filed participants. The below mentioned chart should give a better understanding of the part 1 of the primary interview.

Part 2: In this part of primary research the data collected via secondary research and the part 1 of the primary research is validated with the interviews from individual consultants and subject matter experts.
Consultants are those set of people who have at least 12 years of experience and expertise within the industry whereas Subject Matter Experts are those with at least 15 years of experience behind their back within the same space. The data with the help of two main processes i.e., FGDs (Focused Group Discussions) and IDs (Individual Discussions). This gives us a 3rd party nonbiased primary view of the market scenario making it a more dependable one while collation of the data pointers.
Step 3: Data Bank Validation
Once all the information is collected via primary and secondary sources, we run that information for data validation. At our intelligence centre our research heads track a lot of information related to the market which includes the quarterly reports, the daily stock prices, and other relevant information. Our data bank server gets updated every fortnight and that is how the information which we collected using our primary and secondary information is revalidated in real time.

Step 4: QA/QC Process
After all the data collection and validation our team does a final level of quality check and quality assurance to get rid of any unwanted or undesired mistakes. This might include but not limited to getting rid of the any typos, duplication of numbers or missing of any important information. The people involved in this process include technical content writers, research heads and graphics people. Once this process is completed the title gets uploader on our platform for our clients to read it.
Step 5: Final QC/QA Process:
This is the last process and comes when the client has ordered the study. In this process a final QA/QC is done before the study is emailed to the client. Since we believe in giving our clients a good experience of our research studies, therefore, to make sure that we do not lack at our end in any way humanly possible we do a final round of quality check and then dispatch the study to the client.
Key Segments:
By Application
Request for Segment Customization as per your Business Requirement: Segment Customization Request
Regional Coverage:
Regional Coverage
North America
US
Canada
Mexico
Europe
Eastern Europe
Poland
Romania
Hungary
Turkey
Rest of Eastern Europe
Western Europe
Germany
France
UK
Italy
Spain
Netherlands
Switzerland
Austria
Rest of Western Europe
Asia Pacific
China
India
Japan
South Korea
Vietnam
Singapore
Australia
Rest of Asia Pacific
Middle East & Africa
Middle East
UAE
Egypt
Saudi Arabia
Qatar
Rest of Middle East
Africa
Nigeria
South Africa
Rest of Africa
Latin America
Brazil
Argentina
Colombia
Rest of Latin America
Request for Country Level Research Report: Country Level Customization Request
Available Customization
With the given market data, SNS Insider offers customization as per the company’s specific needs. The following customization options are available for the report:
Product Analysis
Criss-Cross segment analysis (e.g. Product X Application)
Product Matrix which gives a detailed comparison of product portfolio of each company
Geographic Analysis
Additional countries in any of the regions
Company Information
Detailed analysis and profiling of additional market players (Up to five)
The Glass Manufacturing Market Size was USD 118.9 billion in 2023 and is expected to reach USD 210.1 billion by 2032 and grow at a CAGR of 6.5% by 2024-2032.
Ammonia Market size was USD 79.1 billion in 2023 and is expected to reach USD 121.5 billion by 2032 and grow at a CAGR of 4.9% from 2024 to 2032.
Biodegradable Films Market size was USD 1.3 billion in 2023 and is expected to reach USD 2.3 billion by 2032, growing at a CAGR of 6.7% from 2024 to 2032.
The Green Steel Market Size was valued at USD 2.53 billion in 2023, and is expected to reach USD 141.67 billion by 2032, and grow at a CAGR of 56.48% over the forecast period 2024-2032.
The Butyl Rubber Market size was valued at USD 3.9 Billion in 2023. It is expected to grow to USD 6.9 Bn by 2032 and grow at a CAGR of 6.3% by 2024-2032.
The Advanced Insulation Materials Market was valued at USD 8.20 Bn in 2023 and is expected to reach USD 14.68 Bn by 2032, at a CAGR of 6.70% from 2024-2032.

Hi! Click one of our member below to chat on Phone
© 2025 All Rights Reserved by SNS Insider Pvt Ltd


