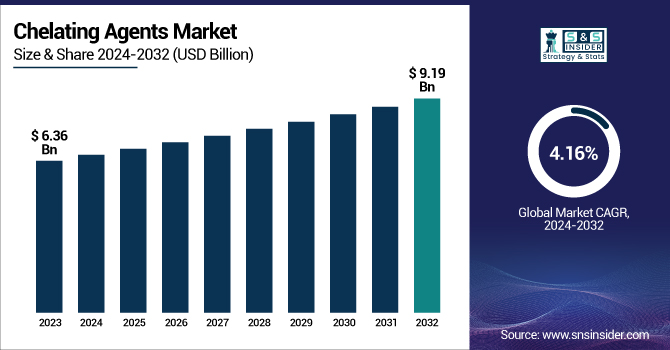
The Chelating Agents Market size was USD 6.36 billion in 2023 and is expected to reach USD 9.19 billion by 2032 and grow at a CAGR of 4.16% over the forecast period of 2024-2032. This report provides a comprehensive analysis of the chelating agents market, focusing on key industry trends and statistical insights. It examines production capacity and utilization rates across regions, along with raw material price fluctuations affecting manufacturing costs. The study also explores the regulatory impact, highlighting environmental and safety policies influencing market dynamics. Additionally, it assesses sustainability metrics, emphasizing the shift toward biodegradable and eco-friendly chelating agents. Innovation and R&D trends are analyzed, showcasing technological advancements and new product developments. Furthermore, the report evaluates market adoption trends across key industries such as pulp & paper, water treatment, and pharmaceuticals, identifying high-growth segments. These insights help stakeholders understand market shifts and strategic opportunities in the evolving chelating agents landscape.
The United States held the largest market share in the chelating agents’ market, valued at USD 1.319 billion, accounting for 74% of the global market. This dominance is driven by the country’s well-established industries, including household and industrial cleaning, water treatment, pulp & paper, and agrochemicals, all of which rely heavily on chelating agents for enhanced efficiency and performance. Additionally, stringent environmental regulations by the EPA (Environmental Protection Agency) have encouraged the adoption of biodegradable and eco-friendly chelating agents, further boosting market demand. The presence of leading manufacturers and strong R&D investments in advanced formulations have also contributed to market expansion. Moreover, high consumer awareness and industrial advancements in sustainable chemical solutions continue to drive growth, making the U.S. the dominant player in the global chelating agent market.
Drivers
The growing demand for biodegradable and sustainable chelating agents drives market expansion across multiple industries.
The increasing shift toward biodegradable and eco-friendly chelating agents is a key driver in the market, fueled by stringent environmental regulations and the need for sustainable alternatives. Governments worldwide, particularly in North America and Europe, are imposing strict limitations on traditional chelating agents like EDTA and NTA due to their persistence in the environment. Industries such as household cleaning, water treatment, and agrochemicals are increasingly adopting biodegradable alternatives like MGDA (Methylglycinediacetic Acid) and GLDA (Glutamic Acid Diacetic Acid). Additionally, growing consumer awareness regarding eco-friendly formulations in detergents and personal care products has further accelerated market growth. The push toward sustainability is also driving R&D investments by major manufacturers, leading to innovation in green chelating agents, making them more cost-effective and efficient in various industrial applications.
Restrain
Stringent environmental regulations restricting the use of conventional chelating agents pose market growth challenges.
The regulatory landscape plays a significant role in shaping the chelating agents market, particularly with restrictions on non-biodegradable variants such as EDTA and phosphates. Agencies like the EPA (Environmental Protection Agency), ECHA (European Chemicals Agency), and REACH regulations have imposed strict guidelines on the use of these chemicals due to their negative impact on water bodies and ecosystems. These restrictions have led to higher compliance costs for manufacturers and end-users, particularly in the water treatment and detergent industries. Furthermore, the availability of cost-effective synthetic alternatives has made it challenging for traditional chelating agents to maintain their market position. The transition toward sustainable and biodegradable chelating agents requires significant investment in research and reformulation, creating financial and operational hurdles for manufacturers and suppliers.
Opportunity
Rising demand for chelating agents in pharmaceutical and personal care sectors creates growth opportunities.
The expanding applications of chelating agents in pharmaceuticals and personal care products present significant market opportunities. Chelating agents play a crucial role in drug formulation, enhancing bioavailability, and stabilizing active ingredients in pharmaceutical applications. The growing pharmaceutical sector, particularly in Asia-Pacific and North America, has increased the demand for specialty chelating agents used in intravenous medications and dietary supplements. Additionally, the personal care industry is witnessing a surge in demand for chelating agents in skincare, haircare, and cosmetic formulations, where they improve product stability and prevent discoloration. With the rising focus on clean-label and natural formulations, companies are investing in biodegradable chelating agents that align with consumer preferences. This expanding demand from high-growth industries is expected to drive further innovations and market penetration in the coming years.
Challenge
High production costs and raw material price volatility hamper market growth and profitability.
The high production costs and fluctuating raw material prices pose significant challenges for the chelating agent market. The manufacturing of biodegradable chelating agents like GLDA, MGDA, and IDS (Iminodisuccinic Acid) requires advanced processing techniques, leading to higher production costs compared to traditional synthetic variants. Additionally, the volatile prices of key raw materials, including amines, carboxylic acids, and phosphonates, directly impact profit margins. The dependency on petroleum-based feedstocks makes pricing susceptible to global crude oil fluctuations, further complicating cost structures. Moreover, supply chain disruptions and increased logistics expenses due to geopolitical tensions and trade restrictions have exacerbated pricing pressures. These factors create challenges for manufacturers in maintaining competitive pricing while ensuring compliance with strict environmental regulations, ultimately affecting market growth and profitability.
By Product
Aminopolycarboxylate held the largest market share, around 64%, in 2023. It is due to a wide range of applications, strong metal-binding properties, and higher industrial usage. aminopolycarboxylates, as EDTA (Ethylenediaminetetraacetic acid), DTPA (Diethylenetriaminepentaacetic acid), and NTA (Nitrilotriacetic acid), are an important class of metal-chelating agents, widely applied in water treatment, detergents, pulp & paper, and chemical processing, due to their excellent property of chelating and removing metal ions. In such a, the largest consumer is the water treatment industry, where such chelating agents are used to inhibit scale formation and metal precipitation that helps in better efficiency of the industrial process. The pulp & paper sector also uses a chain of large aminopolycarboxylates to optimize bleaching and the quality of products. They can achieve benefits at some considerable cost, efficiency, and extensive regulatory approval in all designs, and with increasing climate & ecological concerns, are keeping in top output of the market.
By Application
The Pulp & Paper segment held the largest market share at around 27% in 2023. It is due to its extensive use in improving bleaching efficiency, preventing metal ion interference, and enhancing paper quality. Chelating agents, particularly aminopolycarboxylates like EDTA and DTPA, play a crucial role in the bleaching process by sequestering metal ions such as iron, manganese, and calcium, which can degrade pulp quality and increase chemical consumption. With the growing demand for high-quality paper products, including packaging materials and specialty papers, the adoption of chelating agents has increased significantly. Additionally, the shift toward sustainable and eco-friendly paper production has further driven the use of biodegradable chelating agents to comply with stringent environmental regulations. The expansion of the e-commerce industry and rising demand for paper-based packaging have also contributed to the segment’s dominant position in the market.
Asia Pacific held the largest market share, around 42%, in 2023. It is due to the booming industrial sector, high end-use industries demand, and rapid urbanization. The high share of chelating agent consumption is majorly due to the growth in the pulp & paper, textile, water treatment, and agrochemical industries of the region. Paper, industrial cleaning, and agriculture are some of the booming sectors for producing countries like China, India, and Japan resulting in the growing demand for chelating agents such as EDTA, DTPA, and biodegradable alternatives. Moreover, the growing environmental regulations in countries such as China, directed towards the minimization of water pollution and better handling of industrial waste, are incentivizing the use of green chelating agents. The increase in urban population, rise of manufacturing industries, and growing investments in water treatment projects are boosting the domination of Asia Pacific in the market.
North America held a significant market share. It is attributed to its robust industrial base, coupled with stringent environmental regulations and increasing demand for sustainable formulations. Demand for chelating agents such as EDTA, DTPA, and biodegradable chelating agents has been dominated by the region due to a strong presence in industries such as water treatment, pulp & paper, household & industrial cleaning, and pharmaceuticals. In the USA and Canada, organizations such as the Environmental Protection Agency (EPA) have implemented strict policies that strongly support the use of environmentally friendly and biodegradable chelating agents to reduce ecotoxicity. The other factors aiding the market growth include high demand for premium cleaning products and advanced industrial solutions in the region. A strong presence in North America is expected to continue due to the expansion of the pharmaceutical and personal care sectors and rising investments in water treatment infrastructure.
Key Players
BASF SE (Trilon, Lutensit)
Dow Inc. (Versene, Violet)
Nouryon (Dissolvine, Ferrazone)
Kemira Oyj (KemEcal, KemGuard)
Mitsubishi Chemical Holdings Corporation (Aminotron, Aminotron Plus)
Lanxess AG (Baypure, Bayhibit)
Hexion Inc. (EpiKure, EpiRez)
Archer Daniels Midland Company (ADM) (Citric Acid, Sodium Citrate)
Ascend Performance Materials (FlexaTrac-NTA, FlexaTrac-DTA)
MilliporeSigma (Chelex 100 Resin, Calcium Disodium EDTA)
Nippon Shokubai Co., Ltd. (Acrylic Acid, Acrylates)
Tate & Lyle PLC (Tate & Lyle Citric Acid, Tate & Lyle Sodium Citrate)
Shandong IRO Chelating Chemical Co., Ltd. (EDTA-2Na, EDTA-4Na)
New Alliance Fine Chem Pvt. Ltd. (Zinc EDTA, Calcium DTPA)
Starco Arochem Pvt. Ltd. (Ecoquest CL 100, Starcochel FS 1030)
Adinath Auxi Chem Pvt. Ltd. (ADILON SAM, ADILON SPIN)
American International Ingredients, Inc. (EDTA, Sodium Citrate)
Merck KGaA (EDTA Disodium Salt, EDTA Tetrasodium Salt
Nagase & Co., Ltd. (Nagase Chelate, Nagase Chelate II)
Zhonglan Industry Co., Ltd. (EDTA-2K, EDTA-4K)
In January 2023, Nouryon strengthened its presence in the agricultural sector by acquiring ADOB, a Polish provider of chelated micronutrients and specialty agricultural solutions.
In October 2023, Sasol Chemicals partnered with Solugen to explore the commercialization of sustainable solutions for home and personal care products, emphasizing chelating agents with enhanced environmental profiles.
Report Attributes | Details |
Market Size in 2023 | USD6.38 Billion |
Market Size by 2032 | USD 9.19 Billion |
CAGR | CAGR of4.16 % From 2024 to 2032 |
Base Year | 2023 |
Forecast Period | 2024-2032 |
Historical Data | 2020-2022 |
Report Scope & Coverage | Market Size, Segments Analysis, Competitive Landscape, Regional Analysis, DROC & SWOT Analysis, Forecast Outlook |
Key Segments | • By Product (Sodium gluconate, Organophosphonates, Aminopolycarboxylate, Others) • By Application (Household & industrial cleaning, Pulp & Paper, Chemical processing, Water treatment, Agrochemicals, Consumer Products, Pharmaceutical, Others) |
Regional Analysis/Coverage | North America (US, Canada, Mexico), Europe (Eastern Europe [Poland, Romania, Hungary, Turkey, Rest of Eastern Europe] Western Europe] Germany, France, UK, Italy, Spain, Netherlands, Switzerland, Austria, Rest of Western Europe]), Asia Pacific (China, India, Japan, South Korea, Vietnam, Singapore, Australia, Rest of Asia Pacific), Middle East & Africa (Middle East [UAE, Egypt, Saudi Arabia, Qatar, Rest of Middle East], Africa [Nigeria, South Africa, Rest of Africa], Latin America (Brazil, Argentina, Colombia, Rest of Latin America) |
Company Profiles | BASF SE, Dow Inc., Nouryon, Kemira Oyj, Mitsubishi Chemical Holdings Corporation, Lanxess AG, Hexion Inc., Archer Daniels Midland Company (ADM), Ascend Performance Materials, MilliporeSigma, Nippon Shokubai Co., Ltd., Tate & Lyle PLC, Shandong IRO Chelating Chemical Co., Ltd., New Alliance Fine Chem Pvt. Ltd., Starco Arochem Pvt. Ltd., Adinath Auxi Chem Pvt. Ltd., American International Ingredients, Inc., Merck KGaA, Nagase & Co., Ltd., Zhonglan Industry Co., Ltd. |
Ans: The Chelating Agents Market was valued at USD 6.36 Billion in 2023.
Ans: The expected CAGR of the global Chelating Agents Market during the forecast period is 4.16%
Ans: Aminopolycarboxylate will grow rapidly in the Chelating Agents Market from 2024 to 2032.
Ans: The growing demand for biodegradable and sustainable chelating agents drives market expansion across multiple industries.
Ans: Asia Pacific led the Chelating Agents Market in the region with the highest revenue share in 2023.
Table of Content
1. Introduction
1.1 Market Definition
1.2 Scope (Inclusion and Exclusions)
1.3 Research Assumptions
2. Executive Summary
2.1 Market Overview
2.2 Regional Synopsis
2.3 Competitive Summary
3. Research Methodology
3.1 Top-Down Approach
3.2 Bottom-up Approach
3.3. Data Validation
3.4 Primary Interviews
4. Market Dynamics Impact Analysis
4.1 Market Driving Factors Analysis
4.1.2 Drivers
4.1.2 Restraints
4.1.3 Opportunities
4.1.4 Challenges
4.2 PESTLE Analysis
4.3 Porter’s Five Forces Model
5. Statistical Insights and Trends Reporting
5.1 Production Capacity and Utilization by Country, By Type, 2023
5.2 Feedstock Prices by Country, and Type, 2023
5.3 Regulatory Impact by Country and By Type 2023.
5.4 Environmental Metrics: Emissions Data, Waste Management Practices, and Sustainability Initiatives by Region
5.5 Innovation and R&D, Type, 2023
6. Competitive Landscape
6.1 List of Major Companies By Region
6.2 Market Share Analysis By Region
6.3 Product Benchmarking
6.3.1 Product specifications and features
6.3.2 Pricing
6.4 Strategic Initiatives
6.4.1 Marketing and promotional activities
6.4.2 Distribution and Supply Chain Strategies
6.4.3 Expansion Plans and New Product Launches
6.4.4 Strategic partnerships and collaborations
6.5 Technological Advancements
6.6 Market Positioning and Branding
7. Chelating Agents Market Segmentation By Product
7.1 Chapter Overview
7.2 Sodium gluconate
7.2.1 Sodium gluconate Trends Analysis (2020-2032)
7.2.2 Sodium gluconate Market Size Estimates and Forecasts to 2032 (USD Billion)
7.3 Organphosphonates
7.3.1 Organphosphonates Market Trends Analysis (2020-2032)
7.3.2 Organphosphonates Market Size Estimates and Forecasts to 2032 (USD Billion)
7.4 Aminopolycarboxylate
7.4.1 Aminopolycarboxylate Trends Analysis (2020-2032)
7.4.2 Aminopolycarboxylate Market Size Estimates and Forecasts to 2032 (USD Billion)
7.5 Others
7.5.1 Others Trends Analysis (2020-2032)
7.5.2 Others Market Size Estimates and Forecasts to 2032 (USD Billion)
8. Chelating Agents Market Segmentation By Application
8.1 Chapter Overview
8.2 Household & industrial cleaning
8.2.1 Household & industrial cleaning Market Trends Analysis (2020-2032)
8.2.2 Household & industrial cleaning Market Size Estimates and Forecasts to 2032 (USD Billion)
8.3 Pulp & Paper
8.3.1 Pulp & Paper Market Trends Analysis (2020-2032)
8.3.2 Pulp & Paper Market Size Estimates and Forecasts to 2032 (USD Billion)
8.4 Chemical processing
8.4.1 Chemical Processing Market Trends Analysis (2020-2032)
8.4.2 Chemical Processing Market Size Estimates and Forecasts to 2032 (USD Billion)
8.5 Water treatment
8.5.1 Water treatment Market Trends Analysis (2020-2032)
8.5.2 Water treatment Market Size Estimates and Forecasts to 2032 (USD Billion)
8.6 Agrochemicals
8.6.1 Agrochemicals Market Trends Analysis (2020-2032)
8.6.2 Agrochemicals Market Size Estimates and Forecasts to 2032 (USD Billion)
8.7 Consumer products
8.7.1 Consumer Products Market Trends Analysis (2020-2032)
8.7.2 Consumer Products Market Size Estimates and Forecasts to 2032 (USD Billion)
8.8 Pharmaceutical
8.8.1 Pharmaceutical Market Trends Analysis (2020-2032)
8.8.2 Pharmaceutical Market Size Estimates and Forecasts to 2032 (USD Billion)
8.9 Others
8.9.1 Others Market Trends Analysis (2020-2032)
8.9.2 Others Market Size Estimates and Forecasts to 2032 (USD Billion)
9. Regional Analysis
9.1 Chapter Overview
9.2 North America
9.2.1 Trends Analysis
9.2.2 North America Chelating Agents Market Estimates and Forecasts, by Country (2020-2032) (USD Billion)
9.2.3 North America Chelating Agents Market Estimates and Forecasts, By Product (2020-2032) (USD Billion)
9.2.4 North America Chelating Agents Market Estimates and Forecasts, By Application (2020-2032) (USD Billion)
9.2.5 USA
9.2.5.1 USA Chelating Agents Market Estimates and Forecasts, By Product (2020-2032) (USD Billion)
9.2.5.2 USA Chelating Agents Market Estimates and Forecasts, By Application (2020-2032) (USD Billion)
9.2.6 Canada
9.2.6.1 Canada Chelating Agents Market Estimates and Forecasts, By Product (2020-2032) (USD Billion)
9.2.6.2 Canada Chelating Agents Market Estimates and Forecasts, By Application (2020-2032) (USD Billion)
9.2.7 Mexico
9.2.7.1 Mexico Chelating Agents Market Estimates and Forecasts, By Product (2020-2032) (USD Billion)
9.2.7.2 Mexico Chelating Agents Market Estimates and Forecasts, By Application (2020-2032) (USD Billion)
9.3 Europe
9.3.1 Eastern Europe
9.3.1.1 Trends Analysis
9.3.1.2 Eastern Europe Chelating Agents Market Estimates and Forecasts, by Country (2020-2032) (USD Billion)
9.3.1.3 Eastern Europe Chelating Agents Market Estimates and Forecasts, By Product (2020-2032) (USD Billion)
9.3.1.4 Eastern Europe Chelating Agents Market Estimates and Forecasts, By Application (2020-2032) (USD Billion)
9.3.1.5 Poland
9.3.1.5.1 Poland Chelating Agents Market Estimates and Forecasts, By Product (2020-2032) (USD Billion)
9.3.1.5.2 Poland Chelating Agents Market Estimates and Forecasts, By Application (2020-2032) (USD Billion)
9.3.1.6 Romania
9.3.1.6.1 Romania Chelating Agents Market Estimates and Forecasts, By Product (2020-2032) (USD Billion)
9.3.1.6.2 Romania Chelating Agents Market Estimates and Forecasts, By Application (2020-2032) (USD Billion)
9.3.1.7 Hungary
9.3.1.7.1 Hungary Chelating Agents Market Estimates and Forecasts, By Product (2020-2032) (USD Billion)
9.3.1.7.2 Hungary Chelating Agents Market Estimates and Forecasts, By Application (2020-2032) (USD Billion)
9.3.1.8 Turkey
9.3.1.8.1 Turkey Chelating Agents Market Estimates and Forecasts, By Product (2020-2032) (USD Billion)
9.3.1.8.2 Turkey Chelating Agents Market Estimates and Forecasts, By Application (2020-2032) (USD Billion)
9.3.1.9 Rest of Eastern Europe
9.3.1.9.1 Rest of Eastern Europe Chelating Agents Market Estimates and Forecasts, By Product (2020-2032) (USD Billion)
9.3.1.9.2 Rest of Eastern Europe Chelating Agents Market Estimates and Forecasts, By Application (2020-2032) (USD Billion)
9.3.2 Western Europe
9.3.2.1 Trends Analysis
9.3.2.2 Western Europe Chelating Agents Market Estimates and Forecasts, by Country (2020-2032) (USD Billion)
9.3.2.3 Western Europe Chelating Agents Market Estimates and Forecasts, By Product (2020-2032) (USD Billion)
9.3.2.4 Western Europe Chelating Agents Market Estimates and Forecasts, By Application (2020-2032) (USD Billion)
9.3.2.5 Germany
9.3.2.5.1 Germany Chelating Agents Market Estimates and Forecasts, By Product (2020-2032) (USD Billion)
9.3.2.5.2 Germany Chelating Agents Market Estimates and Forecasts, By Application (2020-2032) (USD Billion)
9.3.2.6 France
9.3.2.6.1 France Chelating Agents Market Estimates and Forecasts, By Product (2020-2032) (USD Billion)
9.3.2.6.2 France Chelating Agents Market Estimates and Forecasts, By Application (2020-2032) (USD Billion)
9.3.2.7 UK
9.3.2.7.1 UK Chelating Agents Market Estimates and Forecasts, By Product (2020-2032) (USD Billion)
9.3.2.7.2 UK Chelating Agents Market Estimates and Forecasts, By Application (2020-2032) (USD Billion)
9.3.2.8 Italy
9.3.2.8.1 Italy Chelating Agents Market Estimates and Forecasts, By Product (2020-2032) (USD Billion)
9.3.2.8.2 Italy Chelating Agents Market Estimates and Forecasts, By Application (2020-2032) (USD Billion)
9.3.2.9 Spain
9.3.2.9.1 Spain Chelating Agents Market Estimates and Forecasts, By Product (2020-2032) (USD Billion)
9.3.2.9.2 Spain Chelating Agents Market Estimates and Forecasts, By Application (2020-2032) (USD Billion)
9.3.2.10 Netherlands
9.3.2.10.1 Netherlands Chelating Agents Market Estimates and Forecasts, By Product (2020-2032) (USD Billion)
9.3.2.10.2 Netherlands Chelating Agents Market Estimates and Forecasts, By Application (2020-2032) (USD Billion)
9.3.2.11 Switzerland
9.3.2.11.1 Switzerland Chelating Agents Market Estimates and Forecasts, By Product (2020-2032) (USD Billion)
9.3.2.11.2 Switzerland Chelating Agents Market Estimates and Forecasts, By Application (2020-2032) (USD Billion)
9.3.2.12 Austria
9.3.2.12.1 Austria Chelating Agents Market Estimates and Forecasts, By Product (2020-2032) (USD Billion)
9.3.2.12.2 Austria Chelating Agents Market Estimates and Forecasts, By Application (2020-2032) (USD Billion)
9.3.2.13 Rest of Western Europe
9.3.2.13.1 Rest of Western Europe Chelating Agents Market Estimates and Forecasts, By Product (2020-2032) (USD Billion)
9.3.2.13.2 Rest of Western Europe Chelating Agents Market Estimates and Forecasts, By Application (2020-2032) (USD Billion)
9.4 Asia Pacific
9.4.1 Trends Analysis
9.4.2 Asia Pacific Chelating Agents Market Estimates and Forecasts, by Country (2020-2032) (USD Billion)
9.4.3 Asia Pacific Chelating Agents Market Estimates and Forecasts, By Product (2020-2032) (USD Billion)
9.4.4 Asia Pacific Chelating Agents Market Estimates and Forecasts, By Application (2020-2032) (USD Billion)
9.4.5 China
9.4.5.1 China Chelating Agents Market Estimates and Forecasts, By Product (2020-2032) (USD Billion)
9.4.5.2 China Chelating Agents Market Estimates and Forecasts, By Application (2020-2032) (USD Billion)
9.4.6 India
9.4.5.1 India Chelating Agents Market Estimates and Forecasts, By Product (2020-2032) (USD Billion)
9.4.5.2 India Chelating Agents Market Estimates and Forecasts, By Application (2020-2032) (USD Billion)
9.4.5 Japan
9.4.5.1 Japan Chelating Agents Market Estimates and Forecasts, By Product (2020-2032) (USD Billion)
9.4.5.2 Japan Chelating Agents Market Estimates and Forecasts, By Application (2020-2032) (USD Billion)
9.4.6 South Korea
9.4.6.1 South Korea Chelating Agents Market Estimates and Forecasts, By Product (2020-2032) (USD Billion)
9.4.6.2 South Korea Chelating Agents Market Estimates and Forecasts, By Application (2020-2032) (USD Billion)
9.4.7 Vietnam
9.4.7.1 Vietnam Chelating Agents Market Estimates and Forecasts, By Product (2020-2032) (USD Billion)
9.2.7.2 Vietnam Chelating Agents Market Estimates and Forecasts, By Application (2020-2032) (USD Billion)
9.4.8 Singapore
9.4.8.1 Singapore Chelating Agents Market Estimates and Forecasts, By Product (2020-2032) (USD Billion)
9.4.8.2 Singapore Chelating Agents Market Estimates and Forecasts, By Application (2020-2032) (USD Billion)
9.4.9 Australia
9.4.9.1 Australia Chelating Agents Market Estimates and Forecasts, By Product (2020-2032) (USD Billion)
9.4.9.2 Australia Chelating Agents Market Estimates and Forecasts, By Application (2020-2032) (USD Billion)
9.4.10 Rest of Asia Pacific
9.4.10.1 Rest of Asia Pacific Chelating Agents Market Estimates and Forecasts, By Product (2020-2032) (USD Billion)
9.4.10.2 Rest of Asia Pacific Chelating Agents Market Estimates and Forecasts, By Application (2020-2032) (USD Billion)
9.5 Middle East and Africa
9.5.1 Middle East
9.5.1.1 Trends Analysis
9.5.1.2 Middle East Chelating Agents Market Estimates and Forecasts, by Country (2020-2032) (USD Billion)
9.5.1.3 Middle East Chelating Agents Market Estimates and Forecasts, By Product (2020-2032) (USD Billion)
9.5.1.4 Middle East Chelating Agents Market Estimates and Forecasts, By Application (2020-2032) (USD Billion)
9.5.1.5 UAE
9.5.1.5.1 UAE Chelating Agents Market Estimates and Forecasts, By Product (2020-2032) (USD Billion)
9.5.1.5.2 UAE Chelating Agents Market Estimates and Forecasts, By Application (2020-2032) (USD Billion)
9.5.1.6 Egypt
9.5.1.6.1 Egypt Chelating Agents Market Estimates and Forecasts, By Product (2020-2032) (USD Billion)
9.5.1.6.2 Egypt Chelating Agents Market Estimates and Forecasts, By Application (2020-2032) (USD Billion)
9.5.1.7 Saudi Arabia
9.5.1.7.1 Saudi Arabia Chelating Agents Market Estimates and Forecasts, By Product (2020-2032) (USD Billion)
9.5.1.7.2 Saudi Arabia Chelating Agents Market Estimates and Forecasts, By Application (2020-2032) (USD Billion)
9.5.1.8 Qatar
9.5.1.8.1 Qatar Chelating Agents Market Estimates and Forecasts, By Product (2020-2032) (USD Billion)
9.5.1.8.2 Qatar Chelating Agents Market Estimates and Forecasts, By Application (2020-2032) (USD Billion)
9.5.1.9 Rest of Middle East
9.5.1.9.1 Rest of Middle East Chelating Agents Market Estimates and Forecasts, By Product (2020-2032) (USD Billion)
9.5.1.9.2 Rest of Middle East Chelating Agents Market Estimates and Forecasts, By Application (2020-2032) (USD Billion)
9.5.2 Africa
9.5.2.1 Trends Analysis
9.5.2.2 Africa Chelating Agents Market Estimates and Forecasts, by Country (2020-2032) (USD Billion)
9.5.2.3 Africa Chelating Agents Market Estimates and Forecasts, By Product (2020-2032) (USD Billion)
9.5.2.4 Africa Chelating Agents Market Estimates and Forecasts, By Application (2020-2032) (USD Billion)
9.5.2.5 South Africa
9.5.2.5.1 South Africa Chelating Agents Market Estimates and Forecasts, By Product (2020-2032) (USD Billion)
9.5.2.5.2 South Africa Chelating Agents Market Estimates and Forecasts, By Application (2020-2032) (USD Billion)
9.5.2.6 Nigeria
9.5.2.6.1 Nigeria Chelating Agents Market Estimates and Forecasts, By Product (2020-2032) (USD Billion)
9.5.2.6.2 Nigeria Chelating Agents Market Estimates and Forecasts, By Application (2020-2032) (USD Billion)
9.6 Latin America
9.6.1 Trends Analysis
9.6.2 Latin America Chelating Agents Market Estimates and Forecasts, by Country (2020-2032) (USD Billion)
9.6.3 Latin America Chelating Agents Market Estimates and Forecasts, By Product (2020-2032) (USD Billion)
9.6.4 Latin America Chelating Agents Market Estimates and Forecasts, By Application (2020-2032) (USD Billion)
9.6.5 Brazil
9.6.5.1 Brazil Chelating Agents Market Estimates and Forecasts, By Product (2020-2032) (USD Billion)
9.6.5.2 Brazil Chelating Agents Market Estimates and Forecasts, By Application (2020-2032) (USD Billion)
9.6.6 Argentina
9.6.6.1 Argentina Chelating Agents Market Estimates and Forecasts, By Product (2020-2032) (USD Billion)
9.6.6.2 Argentina Chelating Agents Market Estimates and Forecasts, By Application (2020-2032) (USD Billion)
9.6.7 Colombia
9.6.7.1 Colombia Chelating Agents Market Estimates and Forecasts, By Product (2020-2032) (USD Billion)
9.6.7.2 Colombia Chelating Agents Market Estimates and Forecasts, By Application (2020-2032) (USD Billion)
9.6.8 Rest of Latin America
9.6.8.1 Rest of Latin America Chelating Agents Market Estimates and Forecasts, By Product (2020-2032) (USD Billion)
9.6.8.2 Rest of Latin America Chelating Agents Market Estimates and Forecasts, By Application (2020-2032) (USD Billion)
10. Company Profiles
10.1 BASF SE
10.1.1 Company Overview
10.1.2 Financial
10.1.3 Product / Services Offered
10.1.4 SWOT Analysis
10.2 Dow Inc.
10.2.1 Company Overview
10.2.2 Financial
10.2.3 Product/ Services Offered
10.2.4 SWOT Analysis
10.3 Nouryon
10.3.1 Company Overview
10.3.2 Financial
10.3.3 Product/ Services Offered
10.3.4 SWOT Analysis
10.4 Kemira Oyj
10.4.1 Company Overview
10.4.2 Financial
10.4.3 Product/ Services Offered
10.4.4 SWOT Analysis
10.5 Mitsubishi Chemical Holdings Corporation
10.5.1 Company Overview
10.5.2 Financial
10.5.3 Product/ Services Offered
10.5.4 SWOT Analysis
10.6 Lanxess AG
10.6.1 Company Overview
10.6.2 Financial
10.6.3 Product/ Services Offered
10.6.4 SWOT Analysis
10.7 Hexion Inc.
10.7.1 Company Overview
10.7.2 Financial
10.7.3 Product/ Services Offered
10.7.4 SWOT Analysis
10.8 Archer Daniels Midland Company
10.8.1 Company Overview
10.8.2 Financial
10.8.3 Product/ Services Offered
10.8.4 SWOT Analysis
10.9 Ascend Performance Materials
10.9.1 Company Overview
10.9.2 Financial
10.9.3 Product/ Services Offered
10.9.4 SWOT Analysis
10.10 MilliporeSigma
10.10.1 Company Overview
10.10.2 Financial
10.10.3 Product/ Services Offered
10.10.4 SWOT Analysis
11. Use Cases and Best Practices
12. Conclusion
An accurate research report requires proper strategizing as well as implementation. There are multiple factors involved in the completion of good and accurate research report and selecting the best methodology to compete the research is the toughest part. Since the research reports we provide play a crucial role in any company’s decision-making process, therefore we at SNS Insider always believe that we should choose the best method which gives us results closer to reality. This allows us to reach at a stage wherein we can provide our clients best and accurate investment to output ratio.
Each report that we prepare takes a timeframe of 350-400 business hours for production. Starting from the selection of titles through a couple of in-depth brain storming session to the final QC process before uploading our titles on our website we dedicate around 350 working hours. The titles are selected based on their current market cap and the foreseen CAGR and growth.
The 5 steps process:
Step 1: Secondary Research:
Secondary Research or Desk Research is as the name suggests is a research process wherein, we collect data through the readily available information. In this process we use various paid and unpaid databases which our team has access to and gather data through the same. This includes examining of listed companies’ annual reports, Journals, SEC filling etc. Apart from this our team has access to various associations across the globe across different industries. Lastly, we have exchange relationships with various university as well as individual libraries.
Step 2: Primary Research
When we talk about primary research, it is a type of study in which the researchers collect relevant data samples directly, rather than relying on previously collected data. This type of research is focused on gaining content specific facts that can be sued to solve specific problems. Since the collected data is fresh and first hand therefore it makes the study more accurate and genuine.
We at SNS Insider have divided Primary Research into 2 parts.
Part 1 wherein we interview the KOLs of major players as well as the upcoming ones across various geographic regions. This allows us to have their view over the market scenario and acts as an important tool to come closer to the accurate market numbers. As many as 45 paid and unpaid primary interviews are taken from both the demand and supply side of the industry to make sure we land at an accurate judgement and analysis of the market.
This step involves the triangulation of data wherein our team analyses the interview transcripts, online survey responses and observation of on filed participants. The below mentioned chart should give a better understanding of the part 1 of the primary interview.
Part 2: In this part of primary research the data collected via secondary research and the part 1 of the primary research is validated with the interviews from individual consultants and subject matter experts.
Consultants are those set of people who have at least 12 years of experience and expertise within the industry whereas Subject Matter Experts are those with at least 15 years of experience behind their back within the same space. The data with the help of two main processes i.e., FGDs (Focused Group Discussions) and IDs (Individual Discussions). This gives us a 3rd party nonbiased primary view of the market scenario making it a more dependable one while collation of the data pointers.
Step 3: Data Bank Validation
Once all the information is collected via primary and secondary sources, we run that information for data validation. At our intelligence centre our research heads track a lot of information related to the market which includes the quarterly reports, the daily stock prices, and other relevant information. Our data bank server gets updated every fortnight and that is how the information which we collected using our primary and secondary information is revalidated in real time.
Step 4: QA/QC Process
After all the data collection and validation our team does a final level of quality check and quality assurance to get rid of any unwanted or undesired mistakes. This might include but not limited to getting rid of the any typos, duplication of numbers or missing of any important information. The people involved in this process include technical content writers, research heads and graphics people. Once this process is completed the title gets uploader on our platform for our clients to read it.
Step 5: Final QC/QA Process:
This is the last process and comes when the client has ordered the study. In this process a final QA/QC is done before the study is emailed to the client. Since we believe in giving our clients a good experience of our research studies, therefore, to make sure that we do not lack at our end in any way humanly possible we do a final round of quality check and then dispatch the study to the client.
Key Segments:
By Product
Sodium gluconate
Organphosphonates
Aminopolycarboxylate
Others
By Application
Household & industrial cleaning
Pulp & Paper
Chemical processing
Water treatment
Agrochemicals
Consumer Products
Pharmaceutical
Others
Request for Segment Customization as per your Business Requirement: Segment Customization Request
Regional Coverage:
North America
US
Canada
Mexico
Europe
Eastern Europe
Poland
Romania
Hungary
Turkey
Rest of Eastern Europe
Western Europe
Germany
France
UK
Italy
Spain
Netherlands
Switzerland
Austria
Rest of Western Europe
Asia Pacific
China
India
Japan
South Korea
Vietnam
Singapore
Australia
Rest of Asia Pacific
Middle East & Africa
Middle East
UAE
Egypt
Saudi Arabia
Qatar
Rest of Middle East
Africa
Nigeria
South Africa
Rest of Africa
Latin America
Brazil
Argentina
Colombia
Rest of Latin America
Request for Country Level Research Report: Country Level Customization Request
Available Customization
With the given market data, SNS Insider offers customization as per the company’s specific needs. The following customization options are available for the report:
Detailed Volume Analysis
Criss-Cross segment analysis (e.g. Product X Application)
Competitive Product Benchmarking
Geographic Analysis
Additional countries in any of the regions
Customized Data Representation
Detailed analysis and profiling of additional market players
The Recycled Textiles Market size was valued at USD 5.76 billion in 2023 and is expected to reach USD 8.69 billion by 2032, at a CAGR of 4.70% from 2024-2032.
Battery Metals Market size was USD 10.6 Billion in 2023 and is expected to reach USD 21.3 Billion by 2032 and grow at a CAGR of 8.1% from 2024-2032.
The textile coatings market size was USD 4.45 Billion in 2023 and is expected to reach USD 6.52 Billion by 2032 and grow at a CAGR of 4.23% over the forecast period of 2024-2032.
The Drilling Lubricants Market Size was USD 2.5 Billion in 2023 and is expected to reach USD 3.7 Billion by 2032 and grow at a CAGR of 4.6% by 2024-2032.
The Silicone Elastomer Market size was USD 7.12 Billion in 2023 and is expected to reach USD 12.64 Billion by 2032, growing at a CAGR of 6.59% from 2024-2032.
Carbon Dioxide Market size was valued at USD 10.8 billion in 2023 and is expected to reach USD 17.1 billion by 2032, growing at a CAGR of 5.2% from 2024-2032.
Hi! Click one of our member below to chat on Phone