image

Ceramic Membranes Market Report Scope & Overview

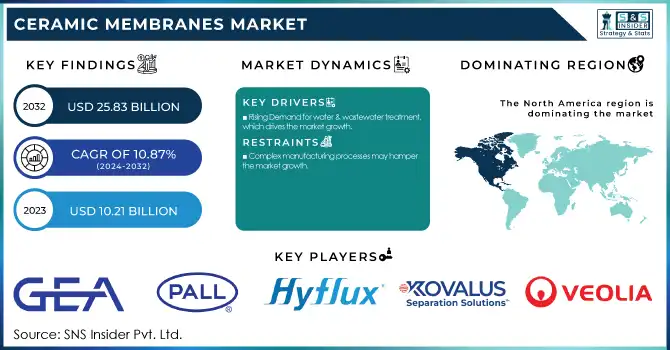
The Ceramic Membranes Market size was USD 10.21 Billion in 2023 and is expected to reach USD 25.83 Billion by 2032 and grow at a CAGR of 10.87% over the forecast period of 2024-2032. The ceramic membranes market report provides a comprehensive analysis of key industry metrics, including production capacity, feedstock pricing, regulatory impact, environmental performance, innovation trends, and adoption rates across various regions. In 2023, China, Germany, and the U.S. led ceramic membrane production, with utilization rates highest in wastewater treatment and food & beverage applications. The report explores feedstock price fluctuations, highlighting rising alumina costs in China due to energy tariffs, while Europe witnessed price stabilization supported by government subsidies. Regulatory frameworks such as the EPA’s water reuse policies in the U.S., the EU Green Deal, and China's Water Pollution Prevention Action Plan have accelerated the adoption of ceramic membranes, particularly in zero-liquid discharge (ZLD) systems.

Ceramic Membranes Market Revenue Analysis

To Get more information on Ceramic Membranes Market - Request Free Sample Report

Ceramic Membranes Market Dynamics

Drivers

  • Rising Demand for water & wastewater treatment, which drives the market growth.  

Increasing demand for efficient and sustainable solutions for water treatment drives the ceramic membranes market. Stringent regulatory measures, such as the EPA, Clean Water Act (U.S.), the EU Water Framework Directive, and the China Water Pollution Prevention Action Plan, are enforcing stricter discharge limits and encouraging the application of advanced filtration technologies. Ceramic membranes have high durability, chemical resistance, and longer operational life than polymeric membranes and, therefore, are gaining traction in industries such as municipal water treatment, pharmaceuticals, food & beverage, and oil & gas. Furthermore, the increasing number of industrial wastewater management processes being adopted in the region adopting zero liquid discharge (ZLD) systems are positively impacting the growth of the ceramic membrane market in Asia-Pacific and North America. The global water crisis due to scarce water resources and concerns over industrial wastewater pollution is expected to expedite market growth, with governments and private sectors investing in advanced membrane technologies to ensure sustainable water reuse and compliance with environmental regulations.

Restraint

  •   Complex manufacturing processes may hamper the market growth.

They require material selection, shaping, high-temperature sintering, and modification of the surface for high efficiency. Compared to polymeric membranes that are mass-manufactured at low cost, ceramic membranes are more costly to manufacture as their fabricating requires sophisticated manufacturing technologies and unique raw materials like alumina, zirconia, and titania. Moreover, the sintering method conducts a high-temperature process (usually above 1,200°C), which not only results in high energy consumption and production cost but also suffers from the scalability issue. Combined with the tightly controlled range of pore size and membrane uniformity, this makes large-scale production a difficult task. As a result, there is a high capital expenditure and longer production cycles that limit market growth, particularly in cost-sensitive sectors and developing regions where price is critical.

Opportunity

Advancements in hybrid and graphene-enhanced membranes create an opportunity in the market.  

Membranes that are enhanced with graphene-based materials have higher permeation, better fouling resistance, and mechanical strength, which is the right choice for high-purity biopharmaceuticals, semiconductors, and desalination plants. Hybrid ceramic–polymer membranes merge the structural strength of ceramics and polymer flexibility to provide cost-effective production yet simultaneously high filtration efficacies. These developments are broadening fields of application, particularly in developing countries, where cost-effectiveness and energy efficiency are very important. Moreover, the innovation proliferation, fueled by rising R&D investments from leading companies, including Japan, Germany, and the U.S., will offer continued growth opportunities in the market.

Challenges

Supply chain disruptions and raw material price volatility may create a challenge for the market.

The market for ceramic membranes has witnessed numerous challenges posed by reliance on various raw materials, such as alumina, zirconia, and titania. Prices of raw materials have continued to fluctuate. Additionally, uncertainties in the supply chain may create an obstacle for the ceramic membranes market during the forecast period. These materials have faced availability and pricing challenges driven by geopolitical tensions, trade restrictions, and rising energy costs. USA, Russia, China, etc. those nations are exporting the products of zirconia and alumina, but China is the main supplier. Therefore, the Chinese establishment resorted to export controls, making manufacturers around the world suffer from supply shortages and increased costs. Such challenges put pressure on profit margins for ceramic membrane manufacturers and hinder the adoption of this technology at scale for end-users in water treatment, pharmaceuticals, and food & beverages industries. Addressing these challenges will require more diversified sourcing strategies, investment in local production facilities, and innovations in alternative materials to safeguard the market.

Ceramic Membranes Market Segmentation Analysis

By Technology  

Microfiltration held the largest market share, around 30% in 2023.  Microfiltration is an efficient necessary separation blocking bacteria, suspended solids, and larger contaminants, which holds importance in drinking water treatment, dairy industry processes (like milk clarification), and biopharmaceutical sterilization, among others. Moreover, high regulation requirements regarding water quality and the need for food safety, including EPA(U.S.), EU Drinking Water Directive, and WHO guidelines, have driven the demand. Its low operational cost and energy consumption are what make microfiltration a preferred technology for industrial applications over ultrafiltration and nanofiltration. Microfiltration maintains its market leadership as the adoption of sustainable and energy-efficient filtration solutions continues to grow.

By Application

Water & Wastewater Treatment held the largest market share, around 46% in 2023. It is primarily due to the increasing demand for filtration products, which provides high durability, and the high performance as it purified water. These factors, in synchronization with stringent regulations on water quality and industrial discharge across the globe (such as the U.S. Clean Water Act, EU Water Framework Directive, and China Water Pollution Prevention Plan), are leading to the growing adoption of advanced filtration technologies. Compared to membranes made from polymeric materials, ceramic membranes demonstrate higher filtration efficiency, greater resistance to chemicals, and enhanced operating life making them well-suited for municipal water treatment, seawater desalination plants and industrial wastewater recycling. Furthermore, increasing emphasis on zero liquid discharge (ZLD) systems and sustainable water management practices is stimulating the market expansion.

Ceramic Membranes Market Regional Outlook

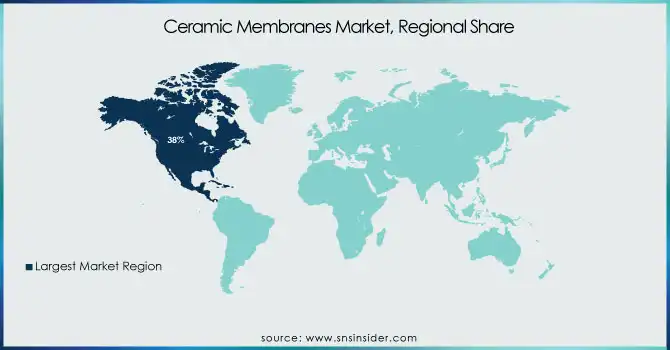
North America held the largest market share, around 38% in 2023. It is due to stringent environmental regulations, high investments in treatment infrastructure, and developed industrial applications. Stringent water quality standards set by U.S. Environmental Protection Agency (EPA) and the Clean Water Act in Canada are resulting in demand for advanced high-performance filtration technologies. Furthermore, increasing industrial wastewater discharge from industries such as pharmaceuticals, food & beverage, chemicals, etc. is driving the adoption of ceramic membranes to achieve effective purification and wastewater recycling. High research and development spending and technology advancement in the area resulting in innovative hybrid membranes and graphene-based ceramic solutions are a few of the key factors contributing to the growth of the market in this business segmentation. In addition, the U.S. Infrastructure Investment and Jobs Act, which is a government funding program for sustainable water management projects, is also driving market growth. North America has been the largest market segment for ceramic membranes, driven by a long-established industrial background, relatively high penetration of advanced filtration technologies, and robust regulatory support.

Asia held a significant market share in the market. It is owing to the rapid pace of industrialization, increasing freshwater scarcity levels, and stringent environmental regulations in countries such as China, India, and Japan. For instance, countries such as China through its Water Pollution Prevention Action Plan and India through its National Water Policy are introducing stringent wastewater treatment laws which is in turn propelling the market for advanced filtration technologies in the region. Moreover, the rising requirement for potable water, increasing investments in desalination projects, and implementation of zero liquid discharge (ZLD) systems have positively influenced the market growth. Another important factor is the booming industries such as food & beverage, pharmaceuticals and chemicals that will ultimately lead to the demand of a filtration method that can provide high-purity water.

Ceramic-Membranes-Market-Regional-Share

Get Customized Report as per Your Business Requirement - Enquiry Now

Key Players

  • GEA Group Aktiengesellschaft (Membrane Filtration Systems, Dairy Membrane Plants)

  • Pall Corporation (Microza Membranes, Pall SepraSol Plus Liquid/Gas Coalescers)

  • Hyflux Ltd (Kristal Membrane Modules, PoroCep Membrane Bioreactor)

  • Kovalus Separation Solutions (Ceramic Membrane Filtration Units, Crossflow Filtration Systems)

  • Nanostone (CM-151 Membrane, CM-700 Membrane)

  • Veolia (Ceramic Membrane Ultrafiltration, AnoxKaldnes MBBR)

  • TAMI Industries (Inside CéRAM Membranes, Multi-Channel Ceramic Membranes)

  • METAWATER Co., Ltd. (Ceramic Flat Sheet Membrane, Ceramic Hollow Fiber Membrane)

  • ITN Nanovation AG (CeraNovis Membranes, NanoCeram Filtration Systems)

  • SIVA Unit (Ceramic Membrane Modules, Industrial Filtration Systems)

  • Atech Innovations gmbh (Ceramic Membrane Elements, Tubular Membrane Modules)

  • LiqTech Holding A/S (SiC Ceramic Membranes, CoMem Industrial Modules)

  • Qua Group LLC (CeraQ* Ceramic Filters, EnviQ Membrane Bioreactors)

  • TORAY INDUSTRIES, INC. (Ceramic UF Membranes, TORAYFIL* Hollow Fiber Membranes)

  • KERAFOL Ceramic Films GmbH & Co. KG (Ceramic Membrane Discs, Flat Sheet Membranes)

  • Aquatech International LLC (Ceramic Membrane Systems, AquaEZ Membrane Solutions)

  • Paul Rauschert GmbH & Co. KG (Ceramic Filter Elements, Membrane Filtration Units)

  • HYDRASYST (Ceramic Membrane Filtration Systems, HYDRAcap Modules)

  • Membratec SA (Ceramic Membrane Plants, Membrane Filtration Solutions)

  • Mantec Filtration (Star-Sep Ceramic Membranes, Porous Ceramic Filters)

Recent Development:

  • In 2024, Pall Corporation expanded its product line by launching a new series of ceramic membranes designed to improve filtration efficiency in the food and beverage industry. The new membranes offer enhanced durability, higher permeability, and improved fouling resistance, making them ideal for dairy processing, beverage clarification, and industrial filtration applications. 

  • In 2023, TAMI Industries invested in research and development to create innovative ceramic membrane solutions specifically for the pharmaceutical sector. These new solutions focus on enhancing separation processes, offering improved efficiency and reliability for pharmaceutical production.

Ceramic Membranes Market Report Scope:

Report Attributes Details
Market Size in 2023 USD 10.21 Billion
Market Size by 2032 USD 25.83 Billion
CAGR CAGR of 10.87%  From 2024 to 2032
Base Year 2023
Forecast Period 2024-2032
Historical Data 2020-2022
Report Scope & Coverage Market Size, Segments Analysis, Competitive  Landscape, Regional Analysis, DROC & SWOT Analysis, Forecast Outlook
Key Segments • By Technology (Ultrafiltration, Microfiltration, Nanofiltration, Others)
• By Application (Water & Wastewater Treatment, Pharmaceuticals, Food & Beverage, Chemical Processing, Biotechnology, Other)
Regional Analysis/Coverage North America (US, Canada, Mexico), Europe (Eastern Europe [Poland, Romania, Hungary, Turkey, Rest of Eastern Europe] Western Europe] Germany, France, UK, Italy, Spain, Netherlands, Switzerland, Austria, Rest of Western Europe]), Asia Pacific (China, India, Japan, South Korea, Vietnam, Singapore, Australia, Rest of Asia Pacific), Middle East & Africa (Middle East [UAE, Egypt, Saudi Arabia, Qatar, Rest of Middle East], Africa [Nigeria, South Africa, Rest of Africa], Latin America (Brazil, Argentina, Colombia, Rest of Latin America)
Company Profiles GEA Group Aktiengesellschaft, Pall Corporation, Hyflux Ltd, Kovalus Separation Solutions, Nanostone, Veolia, TAMI Industries, METAWATER Co., Ltd., ITN Nanovation AG, SIVA Unit, Atech Innovations gmbh, LiqTech Holding A/S, Qua Group LLC, TORAY INDUSTRIES, INC., KERAFOL Ceramic Films GmbH & Co. KG, Aquatech International LLC, Paul Rauschert GmbH & Co. KG, HYDRASYST, Membratec SA, Mantec Filtration

Frequently Asked Questions

Ans: The Ceramic Membranes Market was valued at USD 10.21 Billion in 2023.

Ans: The expected CAGR of the global Ceramic Membranes Market during the forecast period is 10.87%

Ans: Water & Wastewater Treatment will grow rapidly in the Ceramic Membranes Market from 2024-2032.

Ans: Rising Demand for water & wastewater treatment, which drives the market growth.

Ans: North America led the Ceramic Membranes Market in the region with the highest revenue share in 2023.

Table of Contents:

1. Introduction

1.1 Market Definition

1.2 Scope (Inclusion and Exclusions)

1.3 Research Assumptions

2. Executive Summary

2.1 Market Overview

2.2 Regional Synopsis

2.3 Competitive Summary

3. Research Methodology

3.1 Top-Down Approach

3.2 Bottom-up Approach

3.3. Data Validation

3.4 Primary Interviews

4. Market Dynamics Impact Analysis

4.1 Market Driving Factors Analysis

4.1.2 Drivers

4.1.2 Restraints

4.1.3 Opportunities

4.1.4 Challenges

4.2 PESTLE Analysis

4.3 Porter’s Five Forces Model

5. Statistical Insights and Trends Reporting

5.1 Production Capacity and Utilization, by Country, By Type, 2023

5.2 Feedstock Prices, by Country, By Type, 2023

5.3   Regulatory Impact, by Country, By Technology 2023.

5.4 Environmental Metrics: Emissions Data, Waste Management Practices, and Sustainability Initiatives, by Region

5.5 Innovation and R&D, Type, 2023

6. Competitive Landscape

6.1 List of Major Companies, By Region

6.2 Market Share Analysis, By Region

6.3 Product Benchmarking

6.3.1 Product specifications and features

6.3.2 Pricing

6.4 Strategic Initiatives

6.4.1 Marketing and promotional activities

6.4.2 Distribution and Supply Chain Strategies

6.4.3 Expansion Plans and New Product Launches

6.4.4 Strategic partnerships and collaborations

6.5 Technological Advancements

6.6 Market Positioning and Branding

7. Ceramic Membranes Market Segmentation, By Technology

7.1 Chapter Overview

7.2 Ultrafiltration

        7.2.1 Ultrafiltration Trends Analysis (2020-2032)

7.2.2 Ultrafiltration Market Size Estimates and Forecasts to 2032 (USD Billion)

7.3 Microfiltration

       7.3.1 Microfiltration Market Trends Analysis (2020-2032)

       7.3.2 Microfiltration Market Size Estimates and Forecasts to 2032 (USD Billion)

7.4 Nanofiltration

        7.4.1 Nanofiltration Trends Analysis (2020-2032)

7.4.2 Nanofiltration Market Size Estimates and Forecasts to 2032 (USD Billion)

7.5 Others

       7.5.1 Others Market Trends Analysis (2020-2032)

       7.5.2 Others Market Size Estimates and Forecasts to 2032 (USD Billion)

8. Ceramic Membranes Market Segmentation, by Application

8.1 Chapter Overview

8.2 Water & Wastewater Treatment

        8.2.1 Water & Wastewater Treatment Market Trends Analysis (2020-2032)

8.2.2 Water & Wastewater Treatment Market Size Estimates and Forecasts to 2032 (USD Billion)

8.3 Pharmaceuticals

      8.3.1 Pharmaceuticals Market Trends Analysis (2020-2032)

      8.3.2 Pharmaceuticals Market Size Estimates and Forecasts to 2032 (USD Billion)

8.4 Food & Beverage

        8.4.1 Food & Beverage Market Trends Analysis (2020-2032)

8.4.2 Food & Beverage Market Size Estimates and Forecasts to 2032 (USD Billion)

8.5 Chemical Processing

        8.5.1 Chemical Processing Market Trends Analysis (2020-2032)

8.5.2 Chemical Processing Market Size Estimates and Forecasts to 2032 (USD Billion)

8.6 Biotechnology

        8.6.1 Biotechnology Market Trends Analysis (2020-2032)

8.6.2 Biotechnology Market Size Estimates and Forecasts to 2032 (USD Billion)

8.7 Other

        8.7.1 Other Market Trends Analysis (2020-2032)

8.7.2 Other Market Size Estimates and Forecasts to 2032 (USD Billion)

9. Regional Analysis

9.1 Chapter Overview

9.2 North America

9.2.1 Trends Analysis

9.2.2 North America Ceramic Membranes Market Estimates and Forecasts, by Country (2020-2032) (USD Billion)

9.2.3 North America Ceramic Membranes Market Estimates and Forecasts, By Technology (2020-2032) (USD Billion)  

9.2.4 North America Ceramic Membranes Market Estimates and Forecasts, by Application (2020-2032) (USD Billion)

9.2.5 USA

9.2.5.1 USA Ceramic Membranes Market Estimates and Forecasts, By Technology (2020-2032) (USD Billion)

9.2.5.2 USA Ceramic Membranes Market Estimates and Forecasts, by Application (2020-2032) (USD Billion)

9.2.6 Canada

9.2.6.1 Canada Ceramic Membranes Market Estimates and Forecasts, By Technology (2020-2032) (USD Billion)

9.2.6.2 Canada Ceramic Membranes Market Estimates and Forecasts, by Application (2020-2032) (USD Billion)

9.2.7 Mexico

9.2.7.1 Mexico Ceramic Membranes Market Estimates and Forecasts, By Technology (2020-2032) (USD Billion)

9.2.7.2 Mexico Ceramic Membranes Market Estimates and Forecasts, by Application (2020-2032) (USD Billion)

9.3 Europe

9.3.1 Eastern Europe

9.3.1.1 Trends Analysis

9.3.1.2 Eastern Europe Ceramic Membranes Market Estimates and Forecasts, by Country (2020-2032) (USD Billion)

9.3.1.3 Eastern Europe Ceramic Membranes Market Estimates and Forecasts, By Technology (2020-2032) (USD Billion)  

9.3.1.4 Eastern Europe Ceramic Membranes Market Estimates and Forecasts, by Application (2020-2032) (USD Billion)

9.3.1.5 Poland

9.3.1.5.1 Poland Ceramic Membranes Market Estimates and Forecasts, By Technology (2020-2032) (USD Billion)

9.3.1.5.2 Poland Ceramic Membranes Market Estimates and Forecasts, by Application (2020-2032) (USD Billion)

9.3.1.6 Romania

9.3.1.6.1 Romania Ceramic Membranes Market Estimates and Forecasts, By Technology (2020-2032) (USD Billion)

9.3.1.6.2 Romania Ceramic Membranes Market Estimates and Forecasts, by Application (2020-2032) (USD Billion)

9.3.1.7 Hungary

9.3.1.7.1 Hungary Ceramic Membranes Market Estimates and Forecasts, By Technology (2020-2032) (USD Billion)

9.3.1.7.2 Hungary Ceramic Membranes Market Estimates and Forecasts, by Application (2020-2032) (USD Billion)

9.3.1.8 Turkey

9.3.1.8.1 Turkey Ceramic Membranes Market Estimates and Forecasts, By Technology (2020-2032) (USD Billion)

9.3.1.8.2 Turkey Ceramic Membranes Market Estimates and Forecasts, by Application (2020-2032) (USD Billion)

9.3.1.9 Rest of Eastern Europe

9.3.1.9.1 Rest of Eastern Europe Ceramic Membranes Market Estimates and Forecasts, By Technology (2020-2032) (USD Billion)

9.3.1.9.2 Rest of Eastern Europe Ceramic Membranes Market Estimates and Forecasts, by Application (2020-2032) (USD Billion)

9.3.2 Western Europe

9.3.2.1 Trends Analysis

9.3.2.2 Western Europe Ceramic Membranes Market Estimates and Forecasts, by Country (2020-2032) (USD Billion)

9.3.2.3 Western Europe Ceramic Membranes Market Estimates and Forecasts, By Technology (2020-2032) (USD Billion)  

9.3.2.4 Western Europe Ceramic Membranes Market Estimates and Forecasts, by Application (2020-2032) (USD Billion)

9.3.2.5 Germany

9.3.2.5.1 Germany Ceramic Membranes Market Estimates and Forecasts, By Technology (2020-2032) (USD Billion)

9.3.2.5.2 Germany Ceramic Membranes Market Estimates and Forecasts, by Application (2020-2032) (USD Billion)

9.3.2.6 France

9.3.2.6.1 France Ceramic Membranes Market Estimates and Forecasts, By Technology (2020-2032) (USD Billion)

9.3.2.6.2 France Ceramic Membranes Market Estimates and Forecasts, by Application (2020-2032) (USD Billion)

9.3.2.7 UK

9.3.2.7.1 UK Ceramic Membranes Market Estimates and Forecasts, By Technology (2020-2032) (USD Billion)

9.3.2.7.2 UK Ceramic Membranes Market Estimates and Forecasts, by Application (2020-2032) (USD Billion)

9.3.2.8 Italy

9.3.2.8.1 Italy Ceramic Membranes Market Estimates and Forecasts, By Technology (2020-2032) (USD Billion)

9.3.2.8.2 Italy Ceramic Membranes Market Estimates and Forecasts, by Application (2020-2032) (USD Billion)

9.3.2.9 Spain

9.3.2.9.1 Spain Ceramic Membranes Market Estimates and Forecasts, By Technology (2020-2032) (USD Billion)

9.3.2.9.2 Spain Ceramic Membranes Market Estimates and Forecasts, by Application (2020-2032) (USD Billion)

9.3.2.10 Netherlands

9.3.2.10.1 Netherlands Ceramic Membranes Market Estimates and Forecasts, By Technology (2020-2032) (USD Billion)

9.3.2.10.2 Netherlands Ceramic Membranes Market Estimates and Forecasts, by Application (2020-2032) (USD Billion)

9.3.2.11 Switzerland

9.3.2.11.1 Switzerland Ceramic Membranes Market Estimates and Forecasts, By Technology (2020-2032) (USD Billion)

9.3.2.11.2 Switzerland Ceramic Membranes Market Estimates and Forecasts, by Application (2020-2032) (USD Billion)

9.3.2.12 Austria

9.3.2.12.1 Austria Ceramic Membranes Market Estimates and Forecasts, By Technology (2020-2032) (USD Billion)

9.3.2.12.2 Austria Ceramic Membranes Market Estimates and Forecasts, by Application (2020-2032) (USD Billion)

9.3.2.13 Rest of Western Europe

9.3.2.13.1 Rest of Western Europe Ceramic Membranes Market Estimates and Forecasts, By Technology (2020-2032) (USD Billion)

9.3.2.13.2 Rest of Western Europe Ceramic Membranes Market Estimates and Forecasts, by Application (2020-2032) (USD Billion)

9.4 Asia Pacific

9.4.1 Trends Analysis

9.4.2 Asia Pacific Ceramic Membranes Market Estimates and Forecasts, by Country (2020-2032) (USD Billion)

9.4.3 Asia Pacific Ceramic Membranes Market Estimates and Forecasts, By Technology (2020-2032) (USD Billion)  

9.4.4 Asia Pacific Ceramic Membranes Market Estimates and Forecasts, by Application (2020-2032) (USD Billion)

9.4.5 China

9.4.5.1 China Ceramic Membranes Market Estimates and Forecasts, By Technology (2020-2032) (USD Billion)

9.4.5.2 China Ceramic Membranes Market Estimates and Forecasts, by Application (2020-2032) (USD Billion)

9.4.6 India

9.4.5.1 India Ceramic Membranes Market Estimates and Forecasts, By Technology (2020-2032) (USD Billion)

9.4.5.2 India Ceramic Membranes Market Estimates and Forecasts, by Application (2020-2032) (USD Billion)

9.4.5 Japan

9.4.5.1 Japan Ceramic Membranes Market Estimates and Forecasts, By Technology (2020-2032) (USD Billion)

9.4.5.2 Japan Ceramic Membranes Market Estimates and Forecasts, by Application (2020-2032) (USD Billion)

9.4.6 South Korea

9.4.6.1 South Korea Ceramic Membranes Market Estimates and Forecasts, By Technology (2020-2032) (USD Billion)

9.4.6.2 South Korea Ceramic Membranes Market Estimates and Forecasts, by Application (2020-2032) (USD Billion)

9.4.7 Vietnam

9.4.7.1 Vietnam Ceramic Membranes Market Estimates and Forecasts, By Technology (2020-2032) (USD Billion)

9.2.7.2 Vietnam Ceramic Membranes Market Estimates and Forecasts, by Application (2020-2032) (USD Billion)

9.4.8 Singapore

9.4.8.1 Singapore Ceramic Membranes Market Estimates and Forecasts, By Technology (2020-2032) (USD Billion)

9.4.8.2 Singapore Ceramic Membranes Market Estimates and Forecasts, by Application (2020-2032) (USD Billion)

9.4.9 Australia

9.4.9.1 Australia Ceramic Membranes Market Estimates and Forecasts, By Technology (2020-2032) (USD Billion)

9.4.9.2 Australia Ceramic Membranes Market Estimates and Forecasts, by Application (2020-2032) (USD Billion)

9.4.10 Rest of Asia Pacific

9.4.10.1 Rest of Asia Pacific Ceramic Membranes Market Estimates and Forecasts, By Technology (2020-2032) (USD Billion)

9.4.10.2 Rest of Asia Pacific Ceramic Membranes Market Estimates and Forecasts, by Application (2020-2032) (USD Billion)

9.5 Middle East and Africa

9.5.1 Middle East

9.5.1.1 Trends Analysis

9.5.1.2 Middle East Ceramic Membranes Market Estimates and Forecasts, by Country (2020-2032) (USD Billion)

9.5.1.3 Middle East Ceramic Membranes Market Estimates and Forecasts, By Technology (2020-2032) (USD Billion)  

9.5.1.4 Middle East Ceramic Membranes Market Estimates and Forecasts, by Application (2020-2032) (USD Billion)

9.5.1.5 UAE

9.5.1.5.1 UAE Ceramic Membranes Market Estimates and Forecasts, By Technology (2020-2032) (USD Billion)

9.5.1.5.2 UAE Ceramic Membranes Market Estimates and Forecasts, by Application (2020-2032) (USD Billion)

9.5.1.6 Egypt

9.5.1.6.1 Egypt Ceramic Membranes Market Estimates and Forecasts, By Technology (2020-2032) (USD Billion)

9.5.1.6.2 Egypt Ceramic Membranes Market Estimates and Forecasts, by Application (2020-2032) (USD Billion)

9.5.1.7 Saudi Arabia

9.5.1.7.1 Saudi Arabia Ceramic Membranes Market Estimates and Forecasts, By Technology (2020-2032) (USD Billion)

9.5.1.7.2 Saudi Arabia Ceramic Membranes Market Estimates and Forecasts, by Application (2020-2032) (USD Billion)

9.5.1.8 Qatar

9.5.1.8.1 Qatar Ceramic Membranes Market Estimates and Forecasts, By Technology (2020-2032) (USD Billion)

9.5.1.8.2 Qatar Ceramic Membranes Market Estimates and Forecasts, by Application (2020-2032) (USD Billion)

9.5.1.9 Rest of Middle East

9.5.1.9.1 Rest of Middle East Ceramic Membranes Market Estimates and Forecasts, By Technology (2020-2032) (USD Billion)

9.5.1.9.2 Rest of Middle East Ceramic Membranes Market Estimates and Forecasts, by Application (2020-2032) (USD Billion)

9.5.2 Africa

9.5.2.1 Trends Analysis

9.5.2.2 Africa Ceramic Membranes Market Estimates and Forecasts, by Country (2020-2032) (USD Billion)

9.5.2.3 Africa Ceramic Membranes Market Estimates and Forecasts, By Technology (2020-2032) (USD Billion)  

9.5.2.4 Africa Ceramic Membranes Market Estimates and Forecasts, by Application (2020-2032) (USD Billion)

9.5.2.5 South Africa

9.5.2.5.1 South Africa Ceramic Membranes Market Estimates and Forecasts, By Technology (2020-2032) (USD Billion)

9.5.2.5.2 South Africa Ceramic Membranes Market Estimates and Forecasts, by Application (2020-2032) (USD Billion)

9.5.2.6 Nigeria

9.5.2.6.1 Nigeria Ceramic Membranes Market Estimates and Forecasts, By Technology (2020-2032) (USD Billion)

9.5.2.6.2 Nigeria Ceramic Membranes Market Estimates and Forecasts, by Application (2020-2032) (USD Billion)

9.6 Latin America

9.6.1 Trends Analysis

9.6.2 Latin America Ceramic Membranes Market Estimates and Forecasts, by Country (2020-2032) (USD Billion)

9.6.3 Latin America Ceramic Membranes Market Estimates and Forecasts, By Technology (2020-2032) (USD Billion)  

9.6.4 Latin America Ceramic Membranes Market Estimates and Forecasts, by Application (2020-2032) (USD Billion)

9.6.5 Brazil

9.6.5.1 Brazil Ceramic Membranes Market Estimates and Forecasts, By Technology (2020-2032) (USD Billion)

9.6.5.2 Brazil Ceramic Membranes Market Estimates and Forecasts, by Application (2020-2032) (USD Billion)

9.6.6 Argentina

9.6.6.1 Argentina Ceramic Membranes Market Estimates and Forecasts, By Technology (2020-2032) (USD Billion)

9.6.6.2 Argentina Ceramic Membranes Market Estimates and Forecasts, by Application (2020-2032) (USD Billion)

9.6.7 Colombia

9.6.7.1 Colombia Ceramic Membranes Market Estimates and Forecasts, By Technology (2020-2032) (USD Billion)

9.6.7.2 Colombia Ceramic Membranes Market Estimates and Forecasts, by Application (2020-2032) (USD Billion)

9.6.8 Rest of Latin America

9.6.8.1 Rest of Latin America Ceramic Membranes Market Estimates and Forecasts, By Technology (2020-2032) (USD Billion)

9.6.8.2 Rest of Latin America Ceramic Membranes Market Estimates and Forecasts, by Application (2020-2032) (USD Billion)

10. Company Profiles

           10.1     GEA Group Aktiengesellschaft

                          10.1.1 Company Overview

10.1.2 Financial

10.1.3 Product / Services Offered

10.1.4 SWOT Analysis

           10.2      Pall Corporation

                           10.2.1 Company Overview

10.2.2 Financial

10.2.3 Product/ Services Offered

10.2.4 SWOT Analysis

10.3 Hyflux Ltd

              10.3.1 Company Overview

10.3.2 Financial

10.3.3 Product/ Services Offered

10.3.4 SWOT Analysis

10.4 Kovalus Separation Solutions

             10.4.1 Company Overview

10.4.2 Financial

10.4.3 Product/ Services Offered

10.4.4 SWOT Analysis

10.5 Nanostone

             10.5.1 Company Overview

10.5.2 Financial

10.5.3 Product/ Services Offered

10.5.4 SWOT Analysis

10.6 Veolia

             10.6.1 Company Overview

10.6.2 Financial

10.6.3 Product/ Services Offered

10.6.4 SWOT Analysis

10.7 TAMI Industries

             10.7.1 Company Overview

10.7.2 Financial

10.7.3 Product/ Services Offered

10.7.4 SWOT Analysis

10.8 METAWATER Co., Ltd.

             10.8.1 Company Overview

10.8.2 Financial

10.8.3 Product/ Services Offered

10.8.4 SWOT Analysis

10.9 ITN Nanovation AG

             10.9.1 Company Overview

10.9.2 Financial

10.9.3 Product/ Services Offered

10.9.4 SWOT Analysis

10.10 SIVA Unit

             10.10.1 Company Overview

10.10.2 Financial

10.10.3 Product/ Services Offered

10.10.4 SWOT Analysis

11. Use Cases and Best Practices

12. Conclusion

An accurate research report requires proper strategizing as well as implementation. There are multiple factors involved in the completion of good and accurate research report and selecting the best methodology to compete the research is the toughest part. Since the research reports we provide play a crucial role in any company’s decision-making process, therefore we at SNS Insider always believe that we should choose the best method which gives us results closer to reality. This allows us to reach at a stage wherein we can provide our clients best and accurate investment to output ratio.

Each report that we prepare takes a timeframe of 350-400 business hours for production. Starting from the selection of titles through a couple of in-depth brain storming session to the final QC process before uploading our titles on our website we dedicate around 350 working hours. The titles are selected based on their current market cap and the foreseen CAGR and growth.


The 5 steps process:

Step 1: Secondary Research:

Secondary Research or Desk Research is as the name suggests is a research process wherein, we collect data through the readily available information. In this process we use various paid and unpaid databases which our team has access to and gather data through the same. This includes examining of listed companies’ annual reports, Journals, SEC filling etc. Apart from this our team has access to various associations across the globe across different industries. Lastly, we have exchange relationships with various university as well as individual libraries.

Secondary Research

Step 2: Primary Research

When we talk about primary research, it is a type of study in which the researchers collect relevant data samples directly, rather than relying on previously collected data.  This type of research is focused on gaining content specific facts that can be sued to solve specific problems. Since the collected data is fresh and first hand therefore it makes the study more accurate and genuine.

We at SNS Insider have divided Primary Research into 2 parts.

Part 1 wherein we interview the KOLs of major players as well as the upcoming ones across various geographic regions. This allows us to have their view over the market scenario and acts as an important tool to come closer to the accurate market numbers. As many as 45 paid and unpaid primary interviews are taken from both the demand and supply side of the industry to make sure we land at an accurate judgement and analysis of the market.

This step involves the triangulation of data wherein our team analyses the interview transcripts, online survey responses and observation of on filed participants. The below mentioned chart should give a better understanding of the part 1 of the primary interview.

Primary Research

Part 2: In this part of primary research the data collected via secondary research and the part 1 of the primary research is validated with the interviews from individual consultants and subject matter experts.

Consultants are those set of people who have at least 12 years of experience and expertise within the industry whereas Subject Matter Experts are those with at least 15 years of experience behind their back within the same space. The data with the help of two main processes i.e., FGDs (Focused Group Discussions) and IDs (Individual Discussions). This gives us a 3rd party nonbiased primary view of the market scenario making it a more dependable one while collation of the data pointers.

Step 3: Data Bank Validation

Once all the information is collected via primary and secondary sources, we run that information for data validation. At our intelligence centre our research heads track a lot of information related to the market which includes the quarterly reports, the daily stock prices, and other relevant information. Our data bank server gets updated every fortnight and that is how the information which we collected using our primary and secondary information is revalidated in real time.

Data Bank Validation

Step 4: QA/QC Process

After all the data collection and validation our team does a final level of quality check and quality assurance to get rid of any unwanted or undesired mistakes. This might include but not limited to getting rid of the any typos, duplication of numbers or missing of any important information. The people involved in this process include technical content writers, research heads and graphics people. Once this process is completed the title gets uploader on our platform for our clients to read it.

Step 5: Final QC/QA Process:

This is the last process and comes when the client has ordered the study. In this process a final QA/QC is done before the study is emailed to the client. Since we believe in giving our clients a good experience of our research studies, therefore, to make sure that we do not lack at our end in any way humanly possible we do a final round of quality check and then dispatch the study to the client.

Key Segments:

By Technology

  • Ultrafiltration

  • Microfiltration

  • Nanofiltration

  • Others

By Application

  • Water & Wastewater Treatment

  • Pharmaceuticals

  • Food & Beverage

  • Chemical Processing

  • Biotechnology

  • Other

Request for Segment Customization as per your Business Requirement: Segment Customization Request

Regional Coverage:

North America

  • US

  • Canada

  • Mexico

Europe

  • Eastern Europe

    • Poland

    • Romania

    • Hungary

    • Turkey

    • Rest of Eastern Europe

  • Western Europe

    • Germany

    • France

    • UK

    • Italy

    • Spain

    • Netherlands

    • Switzerland

    • Austria

    • Rest of Western Europe

Asia Pacific

  • China

  • India

  • Japan

  • South Korea

  • Vietnam

  • Singapore

  • Australia

  • Rest of Asia Pacific

Middle East & Africa

  • Middle East

    • UAE

    • Egypt

    • Saudi Arabia

    • Qatar

    • Rest of Middle East

  • Africa

    • Nigeria

    • South Africa

    • Rest of Africa

  • Latin America

  • Brazil

  • Argentina

  • Colombia

  • Rest of Latin America

Request for Country Level Research Report: Country Level Customization Request

Available Customization

With the given market data, SNS Insider offers customization as per the company’s specific needs. The following customization options are available for the report:

  • Product Analysis

  • Criss-Cross segment analysis (e.g. Product X Application)

  • Product Matrix which gives a detailed comparison of the product portfolio of each company

  • Geographic Analysis

  • Additional countries in any of the regions

  • Company Information

  • Detailed analysis and profiling of additional market players (Up to five)


  •            5000 (33% Discount)


  •            8950 (40% Discount)


  •            3050 (23% Discount)

Start a Conversation

Hi! Click one of our member below to chat on Phone