Ceramic Matrix Composites Market Size:
Get More Information on Ceramic Matrix Composites Market- Request Sample Report
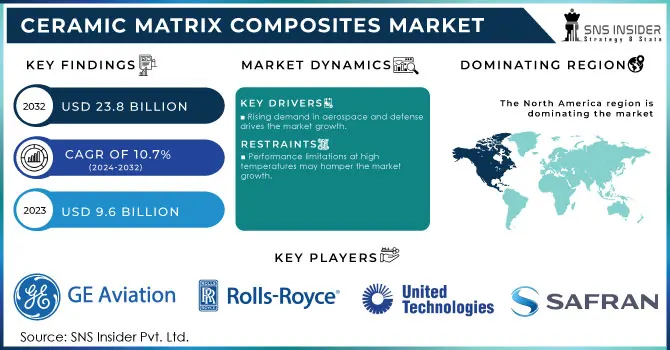
The Ceramic Matrix Composites Market Size was valued at USD 9.6 Billion in 2023. It is expected to grow to USD 23.8 Billion by 2032 and grow at a CAGR of 10.7% over the forecast period of 2024-2032.
Ceramic matrix composites are being rapidly established as a critical technology within the energy sector, specifically as it relates to gas turbines and nuclear reactors. Its combination of unique features, including exceptional high-temperature resistance and corrosion stability, makes CMC ideally suited for the industrial environment, as it permits new and renovated machinery and structural features to operate in conditions that are characterized by both high-temperature outputs and corrosive environments. In gas turbines, for example, CMC permits substantially increased operational temperatures, making it possible to increase performance and efficiency while also minimizing emissions. In the case of nuclear reactors, the unique features of CMC make it substantially more compatible with the industry’s ongoing zeal for preventative controls and continuous safety. The importance of working with composite materials has become realized as a development force.
In 2023, the U.S. Department of Energy (DOE) reported a projected investment of USD 8 billion in advanced manufacturing technologies, including Ceramic Matrix Composites, to enhance the efficiency and performance of energy systems, particularly in gas turbines and nuclear energy applications.
The current generation of industries is characterized by the increasing need for the use of high-performance materials. Many companies are hoping to improve the work of their processes, and durable certain products to enhance weight reduction. Ceramic matrix composites are becoming one of the central materials choices for many companies because of a unique combination of lightweight, high strength, and resistance to heat and corrosion. The superior combination of these characteristics makes this material quite perfect for some of the most technologically advanced applications, such as hypersonic vehicles and space shuttle systems.
In 2023, the National Aeronautics and Space Administration (NASA) announced a USD 1.2 billion investment in advanced materials research, including Ceramic Matrix Composites, aimed at developing next-generation aerospace technologies.
Drivers
Rising demand in aerospace and defense drives the market growth.
One of the most significant drivers of market growth for ceramic matrix composites is the increasing demand in the defense and aerospace sectors. Since these industries put a premium on performance, efficiency, and, most of all, safety, CMCs have become the material of choice due to their distinct properties. The ability to face critical temperatures and harsh environmental conditions makes CMCs ideally suited for the most critical parts of a wide variety of aircraft and missiles, such as turbine blades, thermal protection systems, and structural components. In addition, as the aforementioned industries look for ways to increase fuel efficiency and reduce harmful emissions, they promote lightweight materials such as CMCs. In turn, the defense sector is expending considerable funds on CMCs due to its stringent performance requirements and emphasis on next-generation aircraft and advanced military technologies. This combination of factors creates the conditions for the most market growth and helps establish the CMC as a critical enabler of advancements in aerospace and defense technologies of the future.
The U.S. Department of Defense allocated approximately USD 1.5 billion specifically for the development and integration of advanced materials, including Ceramic Matrix Composites, into military aircraft and defense systems. This investment reflects the increasing emphasis on enhancing the performance, durability, and efficiency of defense technologies, highlighting the critical role that CMCs play in meeting the rigorous demands of modern aerospace and defense applications.
Restraint
Performance limitations at high temperatures may hamper the market growth.
One of the most significant restraints impeding the growth of the ceramic matrix composites market is the performance limits at high temperatures. While these materials are specifically designed for being used in extreme thermal environments, they may still exhibit performance issues under certain conditions. For instance, prolonged exposure to temperatures that exceed the specified maximum may create problems such as thermal shock, microcracking, and deterioration of mechanical properties. As a result, the components made of CMCs cannot be trusted to be reliable and safe in critical applications, including aerospace and defense. If industries tend to require materials capable of maintaining their integrity and functionality under extreme conditions, any issues related to the high-temperature performance of CMCs may make manufacturers reluctant to expand their use of these materials for advanced applications. As such, the concerns related to high-temperature performance may restrict market adoption and growth, particularly in such performance-sensitive sectors as TRS. This means that CMCs may fail to penetrate the markets that require extreme thermal performance.
Market segmentation
By Product
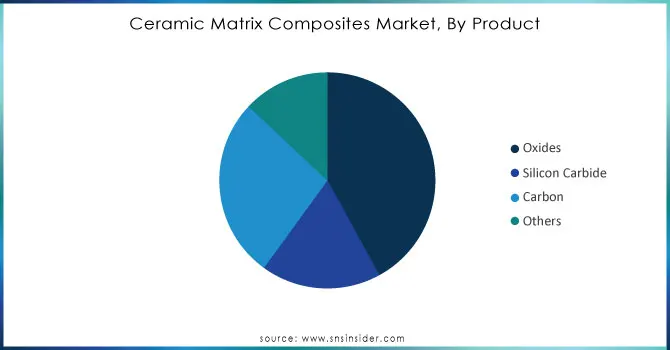
Oxide products held the largest market share around 42% in 2023. This is due to their wide application and advantageous properties. The oxide-based CMCs, such as alumina and zirconia composites, have excellent thermal stability, corrosion resistance, and mechanical strength, which are necessary for industries operating in high-temperature conditions, such as aerospace, automotive, and energy. For example, oxide CMCs are widely used in thermal barrier coatings to protect from extreme temperature the components in gas turbines and jet engines. Moreover, owing to the industry's increasing demand for lightweight materials aimed at reducing fuel consumption, the oxide CMCs are widely used in the aerospace and defense sectors. Hence, the CMCs based on oxides are the most demanded as they demonstrate excellent performance in harsh conditions, and with the help of developing production facilities, they will maintain the leading position in the market.
Product Type |
Key Specifications |
---|---|
Silicon Carbide (SiC) Matrix Composites |
High thermal conductivity, and excellent oxidation resistance, are used in aerospace and nuclear reactors. |
Carbon/Carbon (C/C) Composites |
Exceptional thermal shock resistance, lightweight, used in brake systems and rocket nozzles. |
Oxide-Oxide Composites |
High resistance to oxidation and corrosion, suitable for aerospace turbine components, operating at 1,000°C+. |
Silicon Nitride (Si3N4) Composites |
Superior wear resistance, and low thermal expansion, ideal for automotive and high-temperature industrial applications. |
Alumina (Al2O3) Matrix Composites |
Excellent mechanical properties, and high hardness, are used in cutting tools and biomedical implants. |
Need Any Customization Research On Ceramic Matrix Composites Market - Inquiry Now
By Application
Aerospace held the largest market share around 43% in 2023. The aerospace industry is the key end-use sector contributing to the growth of the ceramic matrix composites market. The primary reason is the necessity for high-performing materials that can withstand extreme conditions and, at the same time, enhance efficiency. CMCs are increasingly popular among the aerospace segment for components, including turbine blades, thermal protection systems, and structural parts, among others. They provide multiple advantages in the sector due to their being lightweight; thus, the final product has higher fuel efficiency and lower emissions a crucial competitive factor for the aerospace industry. Moreover, CMCs offer better thermal and mechanical resistance, which allows them to operate in harsh environments. For example, new spaceships are created with the utilization of the tested compositions and successfully reach the orbit several times on one engine due to the thermal and mechanical strength characteristic of CMC.
Regional Analysis
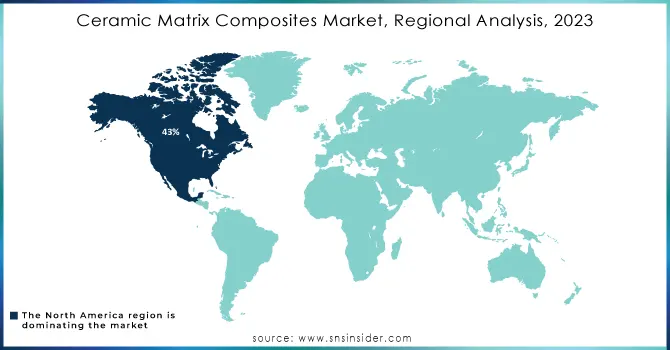
North America region held the highest market share around 43% in 2023. In North America CMC is actively utilized in the US in a multitude of advanced applications such as turbine engines, thermal protection systems, and structural components. Large aerospace manufacturers such as Boeing and Lockheed Martin produce some of the most advanced aircraft in which the reliance on R&D and material improvement cannot be overstated. Moreover, CMC increases fuel efficiency, and therefore governmental initiatives and funding contributing to the growth of advanced manufacturing technologies in the region is a critical driver for CMC consumption. NASA is one example of a government organization that invests in the development of CMC for space exploration purposes. Lastly, North America is a highly developed market in terms of the production of CMC and the presence of larger producers allows for the heightened consumption of the product. Overall, the unique combination of industry demand, government incentive for growth, and the strong presence of ceramic material manufacturers contributes to high market share in North America.
Key Players
General Electric Aviation (CMC Turbine Blades)
Rolls-Royce plc (Ceramic Matrix Composite Engine Components)
3M Company (Nextel Ceramic Fibers)
COI Ceramics Inc. (SiC/SiC Composites)
United Technologies Corporation (Pratt & Whitney CMC Turbine Components)
Safran S.A. (CMC Turbofan Engine Parts)
SGL Carbon (SIGRASIC C/SiC Composites)
Ultramet (UHT CMC Components)
Applied Thin Films Inc. (Thin Film CMC Coatings)
Saint-Gobain Ceramics (Hexoloy SiC CMC Components)
CeramTec GmbH (BIOLOX CMC Implants)
Lancer Systems (CMC Structural Components)
Kyocera Corporation (Kyocera Advanced Ceramics)
Schunk Carbon Technology (CMC Brake Discs)
CoorsTek Inc. (Ceramic Composite Armor)
Morgan Advanced Materials (Technical Ceramic Composites)
Pyromeral Systems (PyroKarb CMC Solutions)
Rauschert GmbH (High-Temperature CMCs)
Hitco Carbon Composites Inc. (SiC CMC Solutions)
Fiber Materials Inc. (Carbon-Carbon Composite Structures)
Key Users
Boeing
Airbus
Lockheed Martin
NASA
United States Department of Defense
Raytheon Technologies
General Electric
Rolls-Royce
Safran
Recent Development:
In 2023, CoorsTek Inc. significantly expanded its production capacity for ceramic composite armor to address the growing demand for advanced protective solutions in both military vehicles and personal protection.
In 2023, Rauschert GmbH developed high-temperature ceramic matrix composites (CMCs) specifically tailored for power generation applications, addressing the need for materials that can withstand extreme temperatures and harsh operating conditions.
In 2022, Fiber Materials Inc. expanded its Carbon-Carbon composite structures specifically designed for hypersonic vehicles, targeting applications that demand extreme heat tolerance and structural integrity.
Report Attributes | Details |
---|---|
Market Size in 2023 | US$ 9.6 Billion |
Market Size by 2032 | US$ 23.8 Billion |
CAGR | CAGR of10.7% From 2024 to 2032 |
Base Year | 2023 |
Forecast Period | 2024-2032 |
Historical Data | 2020-2022 |
Report Scope & Coverage | Market Size, Segments Analysis, Competitive Landscape, Regional Analysis, DROC & SWOT Analysis, Forecast Outlook |
Key Segments | • Segmentation By Product (Oxides, Silicon Carbide, Carbon, Others) •By Application (Aerospace, Defense, Energy & Power, Electrical & Electronics, Others) |
Regional Analysis/Coverage | North America (US, Canada, Mexico), Europe (Eastern Europe [Poland, Romania, Hungary, Turkey, Rest of Eastern Europe] Western Europe] Germany, France, UK, Italy, Spain, Netherlands, Switzerland, Austria, Rest of Western Europe]), Asia Pacific (China, India, Japan, South Korea, Vietnam, Singapore, Australia, Rest of Asia Pacific), Middle East & Africa (Middle East [UAE, Egypt, Saudi Arabia, Qatar, Rest of Middle East], Africa [Nigeria, South Africa, Rest of Africa], Latin America (Brazil, Argentina, Colombia, Rest of Latin America) |
Company Profiles | General Electric Aviation, Rolls-Royce plc, 3M Company, COI Ceramics Inc., United Technologies Corporation, Safran S.A., SGL Carbon, Ultramet, Applied Thin Films Inc., Saint-Gobain Ceramics, CeramTec GmbH, Lancer Systems, Kyocera Corporation, Schunk Carbon Technology, CoorsTek Inc., Morgan Advanced Materials, Pyromeral Systems, Rauschert GmbH, Hitco Carbon Composites Inc., Fiber Materials Inc. and others |
Key Drivers | •Growing demand in aerospace and defense drives the market growth. |
Restraints | • Performance Limitations at High Temperatures may hamper the market growth. |
Ans: The Ceramic Matrix Composites Market was valued at USD 9.6 Billion in 2023.
Ans: The expected CAGR of the global Ceramic Matrix Composites Market during the forecast period is 10.7%.
Ans: The oxides segment product will grow rapidly in the Ceramic Matrix Composites Market from 2024-2032.
Ans: Growing demand in aerospace and defense drives the market growth.
Ans: The U.S. led the Ceramic Matrix Composites Market in the North America region with the highest revenue share in 2023.
Table of Content
1. Introduction
1.1 Market Definition
1.2 Scope (Inclusion and Exclusions)
1.3 Research Assumptions
2. Executive Summary
2.1 Market Overview
2.2 Regional Synopsis
2.3 Competitive Summary
3. Research Methodology
3.1 Top-Down Approach
3.2 Bottom-up Approach
3.3. Data Validation
3.4 Primary Interviews
4. Market Dynamics Impact Analysis
3.1 Market Driving Factors Analysis
3.1.2 Drivers
3.1.2 Restraints
3.1.3 Opportunities
3.1.4 Challenges
3.2 PESTLE Analysis
3.3 Porter’s Five Forces Model
5. Statistical Insights and Trends Reporting
5.1 Production Capacity and Utilization, by Country, by Type, 2023
5.2 Feedstock Prices, by Country, by Type, 2023
5.3 Regulatory Impact, by l Country, by Type, 2023.
5.4 Environmental Metrics: Emissions Data, Waste Management Practices, and Sustainability Initiatives, by Region
5.5 Innovation and R&D, by Product, 2023
6. Competitive Landscape
6.1 List of Major Companies, By Region
6.2 Market Share Analysis, By Region
6.3 Product Benchmarking
6.3.1 Product specifications and features
6.3.2 Pricing
6.4 Strategic Initiatives
6.4.1 Marketing and promotional activities
6.4.2 Distribution and supply chain strategies
6.4.3 Expansion plans and new Product launches
6.4.4 Strategic partnerships and collaborations
6.5 Technological Advancements
6.6 Market Positioning and Branding
7. Ceramic Matrix Composites Market Segmentation, by Product
7.1 Chapter Overview
7.2 Oxides
7.2.1 Oxides Market Trends Analysis (2020-2032)
7.2.2 Oxides Market Size Estimates and Forecasts to 2032 (USD Billion)
7.3 Silicon Carbide
7.3.1 Silicon Carbide Market Trends Analysis (2020-2032)
7.3.2 Silicon Carbide Market Size Estimates and Forecasts to 2032 (USD Billion)
7.4 Carbon
7.4.1 Carbon Market Trends Analysis (2020-2032)
7.4.2 Carbon Market Size Estimates and Forecasts to 2032 (USD Billion)
7.5 Others
7.5.1 Others Market Trends Analysis (2020-2032)
7.5.2 Others Market Size Estimates and Forecasts to 2032 (USD Billion)
8. Ceramic Matrix Composites Market Segmentation, by Application
8.1 Chapter Overview
8.2 Aerospace
8.2.1 Aerospace Market Trends Analysis (2020-2032)
8.2.2 Aerospace Market Size Estimates and Forecasts to 2032 (USD Billion)
8.3 Defense
8.3.1 Defense Market Trends Analysis (2020-2032)
8.3.2 Defense Market Size Estimates and Forecasts to 2032 (USD Billion)
8.4 Energy & Power
8.4.1 Energy & Power Market Trends Analysis (2020-2032)
8.4.2 Energy & Power Market Size Estimates and Forecasts to 2032 (USD Billion)
8.5 Electrical & Electronics
8.5.1 Electrical & Electronics Market Trends Analysis (2020-2032)
8.5.2 Electrical & Electronics Market Size Estimates and Forecasts to 2032 (USD Billion)
8.6 Others
8.6.1 Others Market Trends Analysis (2020-2032)
8.6.2 Others Market Size Estimates and Forecasts to 2032 (USD Billion)
9. Regional Analysis
9.1 Chapter Overview
9.2 North America
9.2.1 Trends Analysis
9.2.2 North America Ceramic Matrix Composites Market Estimates and Forecasts, by Country (2020-2032) (USD Billion)
9.2.3 North America Ceramic Matrix Composites Market Estimates and Forecasts, by Product (2020-2032) (USD Billion)
9.2.4 North America Ceramic Matrix Composites Market Estimates and Forecasts, by Application (2020-2032) (USD Billion)
9.2.5 USA
9.2.5.1 USA Ceramic Matrix Composites Market Estimates and Forecasts, by Product (2020-2032) (USD Billion)
9.2.5.2 USA Ceramic Matrix Composites Market Estimates and Forecasts, by Application (2020-2032) (USD Billion)
9.2.6 Canada
9.2.6.1 Canada Ceramic Matrix Composites Market Estimates and Forecasts, by Product (2020-2032) (USD Billion)
9.2.6.2 Canada Ceramic Matrix Composites Market Estimates and Forecasts, by Application (2020-2032) (USD Billion)
9.2.7 Mexico
9.2.7.1 Mexico Ceramic Matrix Composites Market Estimates and Forecasts, by Product (2020-2032) (USD Billion)
9.2.7.2 Mexico Ceramic Matrix Composites Market Estimates and Forecasts, by Application (2020-2032) (USD Billion)
9.3 Europe
9.3.1 Eastern Europe
9.3.1.1 Trends Analysis
9.3.1.2 Eastern Europe Ceramic Matrix Composites Market Estimates and Forecasts, by Country (2020-2032) (USD Billion)
9.3.1.3 Eastern Europe Ceramic Matrix Composites Market Estimates and Forecasts, by Product (2020-2032) (USD Billion)
9.3.1.4 Eastern Europe Ceramic Matrix Composites Market Estimates and Forecasts, by Application (2020-2032) (USD Billion)
9.3.1.5 Poland
9.3.1.5.1 Poland Ceramic Matrix Composites Market Estimates and Forecasts, by Product (2020-2032) (USD Billion)
9.3.1.5.2 Poland Ceramic Matrix Composites Market Estimates and Forecasts, by Application (2020-2032) (USD Billion)
9.3.1.6 Romania
9.3.1.6.1 Romania Ceramic Matrix Composites Market Estimates and Forecasts, by Product (2020-2032) (USD Billion)
9.3.1.6.2 Romania Ceramic Matrix Composites Market Estimates and Forecasts, by Application (2020-2032) (USD Billion)
9.3.1.7 Hungary
9.3.1.7.1 Hungary Ceramic Matrix Composites Market Estimates and Forecasts, by Product (2020-2032) (USD Billion)
9.3.1.7.2 Hungary Ceramic Matrix Composites Market Estimates and Forecasts, by Application (2020-2032) (USD Billion)
9.3.1.8 Turkey
9.3.1.8.1 Turkey Ceramic Matrix Composites Market Estimates and Forecasts, by Product (2020-2032) (USD Billion)
9.3.1.8.2 Turkey Ceramic Matrix Composites Market Estimates and Forecasts, by Application (2020-2032) (USD Billion)
9.3.1.9 Rest of Eastern Europe
9.3.1.9.1 Rest of Eastern Europe Ceramic Matrix Composites Market Estimates and Forecasts, by Product (2020-2032) (USD Billion)
9.3.1.9.2 Rest of Eastern Europe Ceramic Matrix Composites Market Estimates and Forecasts, by Application (2020-2032) (USD Billion)
9.3.2 Western Europe
9.3.2.1 Trends Analysis
9.3.2.2 Western Europe Ceramic Matrix Composites Market Estimates and Forecasts, by Country (2020-2032) (USD Billion)
9.3.2.3 Western Europe Ceramic Matrix Composites Market Estimates and Forecasts, by Product (2020-2032) (USD Billion)
9.3.2.4 Western Europe Ceramic Matrix Composites Market Estimates and Forecasts, by Application (2020-2032) (USD Billion)
9.3.2.5 Germany
9.3.2.5.1 Germany Ceramic Matrix Composites Market Estimates and Forecasts, by Product (2020-2032) (USD Billion)
9.3.2.5.2 Germany Ceramic Matrix Composites Market Estimates and Forecasts, by Application (2020-2032) (USD Billion)
9.3.2.6 France
9.3.2.6.1 France Ceramic Matrix Composites Market Estimates and Forecasts, by Product (2020-2032) (USD Billion)
9.3.2.6.2 France Ceramic Matrix Composites Market Estimates and Forecasts, by Application (2020-2032) (USD Billion)
9.3.2.7 UK
9.3.2.7.1 UK Ceramic Matrix Composites Market Estimates and Forecasts, by Product (2020-2032) (USD Billion)
9.3.2.7.2 UK Ceramic Matrix Composites Market Estimates and Forecasts, by Application (2020-2032) (USD Billion)
9.3.2.8 Italy
9.3.2.8.1 Italy Ceramic Matrix Composites Market Estimates and Forecasts, by Product (2020-2032) (USD Billion)
9.3.2.8.2 Italy Ceramic Matrix Composites Market Estimates and Forecasts, by Application (2020-2032) (USD Billion)
9.3.2.9 Spain
9.3.2.9.1 Spain Ceramic Matrix Composites Market Estimates and Forecasts, by Product (2020-2032) (USD Billion)
9.3.2.9.2 Spain Ceramic Matrix Composites Market Estimates and Forecasts, by Application (2020-2032) (USD Billion)
9.3.2.10 Netherlands
9.3.2.10.1 Netherlands Ceramic Matrix Composites Market Estimates and Forecasts, by Product (2020-2032) (USD Billion)
9.3.2.10.2 Netherlands Ceramic Matrix Composites Market Estimates and Forecasts, by Application (2020-2032) (USD Billion)
9.3.2.11 Switzerland
9.3.2.11.1 Switzerland Ceramic Matrix Composites Market Estimates and Forecasts, by Product (2020-2032) (USD Billion)
9.3.2.11.2 Switzerland Ceramic Matrix Composites Market Estimates and Forecasts, by Application (2020-2032) (USD Billion)
9.3.2.12 Austria
9.3.2.12.1 Austria Ceramic Matrix Composites Market Estimates and Forecasts, by Product (2020-2032) (USD Billion)
9.3.2.12.2 Austria Ceramic Matrix Composites Market Estimates and Forecasts, by Application (2020-2032) (USD Billion)
9.3.2.13 Rest of Western Europe
9.3.2.13.1 Rest of Western Europe Ceramic Matrix Composites Market Estimates and Forecasts, by Product (2020-2032) (USD Billion)
9.3.2.13.2 Rest of Western Europe Ceramic Matrix Composites Market Estimates and Forecasts, by Application (2020-2032) (USD Billion)
9.4 Asia Pacific
9.4.1 Trends Analysis
9.4.2 Asia Pacific Ceramic Matrix Composites Market Estimates and Forecasts, by Country (2020-2032) (USD Billion)
9.4.3 Asia Pacific Ceramic Matrix Composites Market Estimates and Forecasts, by Product (2020-2032) (USD Billion)
9.4.4 Asia Pacific Ceramic Matrix Composites Market Estimates and Forecasts, by Application (2020-2032) (USD Billion)
9.4.5 China
9.4.5.1 China Ceramic Matrix Composites Market Estimates and Forecasts, by Product (2020-2032) (USD Billion)
9.4.5.2 China Ceramic Matrix Composites Market Estimates and Forecasts, by Application (2020-2032) (USD Billion)
9.4.6 India
9.4.5.1 India Ceramic Matrix Composites Market Estimates and Forecasts, by Product (2020-2032) (USD Billion)
9.4.5.2 India Ceramic Matrix Composites Market Estimates and Forecasts, by Application (2020-2032) (USD Billion)
9.4.5 Japan
9.4.5.1 Japan Ceramic Matrix Composites Market Estimates and Forecasts, by Product (2020-2032) (USD Billion)
9.4.5.2 Japan Ceramic Matrix Composites Market Estimates and Forecasts, by Application (2020-2032) (USD Billion)
9.4.6 South Korea
9.4.6.1 South Korea Ceramic Matrix Composites Market Estimates and Forecasts, by Product (2020-2032) (USD Billion)
9.4.6.2 South Korea Ceramic Matrix Composites Market Estimates and Forecasts, by Application (2020-2032) (USD Billion)
9.4.7 Vietnam
9.4.7.1 Vietnam Ceramic Matrix Composites Market Estimates and Forecasts, by Product (2020-2032) (USD Billion)
9.2.7.2 Vietnam Ceramic Matrix Composites Market Estimates and Forecasts, by Application (2020-2032) (USD Billion)
9.4.8 Singapore
9.4.8.1 Singapore Ceramic Matrix Composites Market Estimates and Forecasts, by Product (2020-2032) (USD Billion)
9.4.8.2 Singapore Ceramic Matrix Composites Market Estimates and Forecasts, by Application (2020-2032) (USD Billion)
9.4.9 Australia
9.4.9.1 Australia Ceramic Matrix Composites Market Estimates and Forecasts, by Product (2020-2032) (USD Billion)
9.4.9.2 Australia Ceramic Matrix Composites Market Estimates and Forecasts, by Application (2020-2032) (USD Billion)
9.4.10 Rest of Asia Pacific
9.4.10.1 Rest of Asia Pacific Ceramic Matrix Composites Market Estimates and Forecasts, by Product (2020-2032) (USD Billion)
9.4.10.2 Rest of Asia Pacific Ceramic Matrix Composites Market Estimates and Forecasts, by Application (2020-2032) (USD Billion)
9.5 Middle East and Africa
9.5.1 Middle East
9.5.1.1 Trends Analysis
9.5.1.2 Middle East Ceramic Matrix Composites Market Estimates and Forecasts, by Country (2020-2032) (USD Billion)
9.5.1.3 Middle East Ceramic Matrix Composites Market Estimates and Forecasts, by Product (2020-2032) (USD Billion)
9.5.1.4 Middle East Ceramic Matrix Composites Market Estimates and Forecasts, by Application (2020-2032) (USD Billion)
9.5.1.5 UAE
9.5.1.5.1 UAE Ceramic Matrix Composites Market Estimates and Forecasts, by Product (2020-2032) (USD Billion)
9.5.1.5.2 UAE Ceramic Matrix Composites Market Estimates and Forecasts, by Application (2020-2032) (USD Billion)
9.5.1.6 Egypt
9.5.1.6.1 Egypt Ceramic Matrix Composites Market Estimates and Forecasts, by Product (2020-2032) (USD Billion)
9.5.1.6.2 Egypt Ceramic Matrix Composites Market Estimates and Forecasts, by Application (2020-2032) (USD Billion)
9.5.1.7 Saudi Arabia
9.5.1.7.1 Saudi Arabia Ceramic Matrix Composites Market Estimates and Forecasts, by Product (2020-2032) (USD Billion)
9.5.1.7.2 Saudi Arabia Ceramic Matrix Composites Market Estimates and Forecasts, by Application (2020-2032) (USD Billion)
9.5.1.8 Qatar
9.5.1.8.1 Qatar Ceramic Matrix Composites Market Estimates and Forecasts, by Product (2020-2032) (USD Billion)
9.5.1.8.2 Qatar Ceramic Matrix Composites Market Estimates and Forecasts, by Application (2020-2032) (USD Billion)
9.5.1.9 Rest of Middle East
9.5.1.9.1 Rest of Middle East Ceramic Matrix Composites Market Estimates and Forecasts, by Product (2020-2032) (USD Billion)
9.5.1.9.2 Rest of Middle East Ceramic Matrix Composites Market Estimates and Forecasts, by Application (2020-2032) (USD Billion)
9.5.2 Africa
9.5.2.1 Trends Analysis
9.5.2.2 Africa Ceramic Matrix Composites Market Estimates and Forecasts, by Country (2020-2032) (USD Billion)
9.5.2.3 Africa Ceramic Matrix Composites Market Estimates and Forecasts, by Product (2020-2032) (USD Billion)
9.5.2.4 Africa Ceramic Matrix Composites Market Estimates and Forecasts, by Application (2020-2032) (USD Billion)
9.5.2.5 South Africa
9.5.2.5.1 South Africa Ceramic Matrix Composites Market Estimates and Forecasts, by Product (2020-2032) (USD Billion)
9.5.2.5.2 South Africa Ceramic Matrix Composites Market Estimates and Forecasts, by Application (2020-2032) (USD Billion)
9.5.2.6 Nigeria
9.5.2.6.1 Nigeria Ceramic Matrix Composites Market Estimates and Forecasts, by Product (2020-2032) (USD Billion)
9.5.2.6.2 Nigeria Ceramic Matrix Composites Market Estimates and Forecasts, by Application (2020-2032) (USD Billion)
9.6 Latin America
9.6.1 Trends Analysis
9.6.2 Latin America Ceramic Matrix Composites Market Estimates and Forecasts, by Country (2020-2032) (USD Billion)
9.6.3 Latin America Ceramic Matrix Composites Market Estimates and Forecasts, by Product (2020-2032) (USD Billion)
9.6.4 Latin America Ceramic Matrix Composites Market Estimates and Forecasts, by Application (2020-2032) (USD Billion)
9.6.5 Brazil
9.6.5.1 Brazil Ceramic Matrix Composites Market Estimates and Forecasts, by Product (2020-2032) (USD Billion)
9.6.5.2 Brazil Ceramic Matrix Composites Market Estimates and Forecasts, by Application (2020-2032) (USD Billion)
9.6.6 Argentina
9.6.6.1 Argentina Ceramic Matrix Composites Market Estimates and Forecasts, by Product (2020-2032) (USD Billion)
9.6.6.2 Argentina Ceramic Matrix Composites Market Estimates and Forecasts, by Application (2020-2032) (USD Billion)
9.6.7 Colombia
9.6.7.1 Colombia Ceramic Matrix Composites Market Estimates and Forecasts, by Product (2020-2032) (USD Billion)
9.6.7.2 Colombia Ceramic Matrix Composites Market Estimates and Forecasts, by Application (2020-2032) (USD Billion)
9.6.8 Rest of Latin America
9.6.8.1 Rest of Latin America Ceramic Matrix Composites Market Estimates and Forecasts, by Product (2020-2032) (USD Billion)
9.6.8.2 Rest of Latin America Ceramic Matrix Composites Market Estimates and Forecasts, by Application (2020-2032) (USD Billion)
10. Company Profiles
10.1 General Electric Aviation
10.1.1 Company Overview
10.1.2 Financial
10.1.3 Product / Services Offered
10.1.4 SWOT Analysis
10.2 Rolls-Royce plc
10.2.1 Company Overview
10.2.2 Financial
10.2.3 Product / Services Offered
10.2.4 SWOT Analysis
10.3 3M Company
10.3.1 Company Overview
10.3.2 Financial
10.3.3 Product / Services Offered
10.3.4 SWOT Analysis
10.4 COI Ceramics Inc.
10.4.1 Company Overview
10.4.2 Financial
10.4.3 Product / Services Offered
10.4.4 SWOT Analysis
10.5 United Technologies Corporation
10.5.1 Company Overview
10.5.2 Financial
10.5.3 Product / Services Offered
10.5.4 SWOT Analysis
10.6 Safran S.A.
10.6.1 Company Overview
10.6.2 Financial
10.6.3 Product / Services Offered
10.6.4 SWOT Analysis
10.7 SGL Carbon
10.7.1 Company Overview
10.7.2 Financial
10.7.3 Product / Services Offered
10.7.4 SWOT Analysis
10.8 Ultramet
10.8.1 Company Overview
10.8.2 Financial
10.8.3 Product / Services Offered
10.8.4 SWOT Analysis
10.9 Applied Thin Films Inc.
10.9.1 Company Overview
10.9.2 Financial
10.9.3 Product / Services Offered
10.9.4 SWOT Analysis
10.10 Saint-Gobain Ceramics
10.10.1 Company Overview
10.10.2 Financial
10.10.3 Product / Services Offered
10.10.4 SWOT Analysis
11. Use Cases and Best Practices
12. Conclusion
An accurate research report requires proper strategizing as well as implementation. There are multiple factors involved in the completion of good and accurate research report and selecting the best methodology to compete the research is the toughest part. Since the research reports we provide play a crucial role in any company’s decision-making process, therefore we at SNS Insider always believe that we should choose the best method which gives us results closer to reality. This allows us to reach at a stage wherein we can provide our clients best and accurate investment to output ratio.
Each report that we prepare takes a timeframe of 350-400 business hours for production. Starting from the selection of titles through a couple of in-depth brain storming session to the final QC process before uploading our titles on our website we dedicate around 350 working hours. The titles are selected based on their current market cap and the foreseen CAGR and growth.
The 5 steps process:
Step 1: Secondary Research:
Secondary Research or Desk Research is as the name suggests is a research process wherein, we collect data through the readily available information. In this process we use various paid and unpaid databases which our team has access to and gather data through the same. This includes examining of listed companies’ annual reports, Journals, SEC filling etc. Apart from this our team has access to various associations across the globe across different industries. Lastly, we have exchange relationships with various university as well as individual libraries.
Step 2: Primary Research
When we talk about primary research, it is a type of study in which the researchers collect relevant data samples directly, rather than relying on previously collected data. This type of research is focused on gaining content specific facts that can be sued to solve specific problems. Since the collected data is fresh and first hand therefore it makes the study more accurate and genuine.
We at SNS Insider have divided Primary Research into 2 parts.
Part 1 wherein we interview the KOLs of major players as well as the upcoming ones across various geographic regions. This allows us to have their view over the market scenario and acts as an important tool to come closer to the accurate market numbers. As many as 45 paid and unpaid primary interviews are taken from both the demand and supply side of the industry to make sure we land at an accurate judgement and analysis of the market.
This step involves the triangulation of data wherein our team analyses the interview transcripts, online survey responses and observation of on filed participants. The below mentioned chart should give a better understanding of the part 1 of the primary interview.
Part 2: In this part of primary research the data collected via secondary research and the part 1 of the primary research is validated with the interviews from individual consultants and subject matter experts.
Consultants are those set of people who have at least 12 years of experience and expertise within the industry whereas Subject Matter Experts are those with at least 15 years of experience behind their back within the same space. The data with the help of two main processes i.e., FGDs (Focused Group Discussions) and IDs (Individual Discussions). This gives us a 3rd party nonbiased primary view of the market scenario making it a more dependable one while collation of the data pointers.
Step 3: Data Bank Validation
Once all the information is collected via primary and secondary sources, we run that information for data validation. At our intelligence centre our research heads track a lot of information related to the market which includes the quarterly reports, the daily stock prices, and other relevant information. Our data bank server gets updated every fortnight and that is how the information which we collected using our primary and secondary information is revalidated in real time.
Step 4: QA/QC Process
After all the data collection and validation our team does a final level of quality check and quality assurance to get rid of any unwanted or undesired mistakes. This might include but not limited to getting rid of the any typos, duplication of numbers or missing of any important information. The people involved in this process include technical content writers, research heads and graphics people. Once this process is completed the title gets uploader on our platform for our clients to read it.
Step 5: Final QC/QA Process:
This is the last process and comes when the client has ordered the study. In this process a final QA/QC is done before the study is emailed to the client. Since we believe in giving our clients a good experience of our research studies, therefore, to make sure that we do not lack at our end in any way humanly possible we do a final round of quality check and then dispatch the study to the client.
Key Segments:
By Product
Oxides
Silicon Carbide
Carbon
Others
By Application
Aerospace
Defense
Energy & Power
Electrical & Electronics
Others
Request for Segment Customization as per your Business Requirement: Segment Customization Request
Regional Coverage:
North America
US
Canada
Mexico
Europe
Eastern Europe
Poland
Romania
Hungary
Turkey
Rest of Eastern Europe
Western Europe
Germany
France
UK
Italy
Spain
Netherlands
Switzerland
Austria
Rest of Western Europe
Asia Pacific
China
India
Japan
South Korea
Vietnam
Singapore
Australia
Rest of Asia Pacific
Middle East & Africa
Middle East
UAE
Egypt
Saudi Arabia
Qatar
Rest of Middle East
Africa
Nigeria
South Africa
Rest of Africa
Latin America
Brazil
Argentina
Colombia
Rest of Latin America
Request for Country Level Research Report: Country Level Customization Request
Available Customization
With the given market data, SNS Insider offers customization as per the company’s specific needs. The following customization options are available for the report:
Product Analysis
Criss-Cross segment analysis (e.g. Product X Application)
Product Matrix which gives a detailed comparison of product portfolio of each company
Geographic Analysis
Additional countries in any of the regions
Company Information
Detailed analysis and profiling of additional market players (Up to five)
The Mussel Oil Market Size was valued at USD 41.7 billion in 2023 and is expected to reach USD 66.1 billion by 2032 and grow at a CAGR of 5.3% by 2024-2032.
The BOPP Films Market is expected to increase at a CAGR of 5.9% from 2024 to 2031 from USD 28.7 billion in 2023 to USD 45.5 billion in 2031.
The Tight Gas Market Size was valued at USD 12.76 trillion cubic feet in 2023 and is expected to reach USD 19.97 trillion cubic feet by 2032 and grow at a CAGR of 5.85% over the forecast period 2024-2032.
The Filled Fluoropolymer Market Size was $3.79 billion in 2023, and is expected to reach USD 5.96 billion by 2031, and grow at a CAGR of 5.8% by 2024-2031.
The Ceramic Balls Market size was USD 535.65 million in 2023 and is expected to Reach USD 805.37 million by 2031 and grow at a CAGR of 5.3% over the forecast period of 2024-2031.
The Intumescent Coatings Market was valued at USD 1.19 billion in 2023 and is projected to reach USD 1.92 billion by 2032, growing at a compound annual growth rate of 5.45% during the forecast period from 2024 to 2032.
Hi! Click one of our member below to chat on Phone