image

Ceramic Balls Market Report Scope & Overview

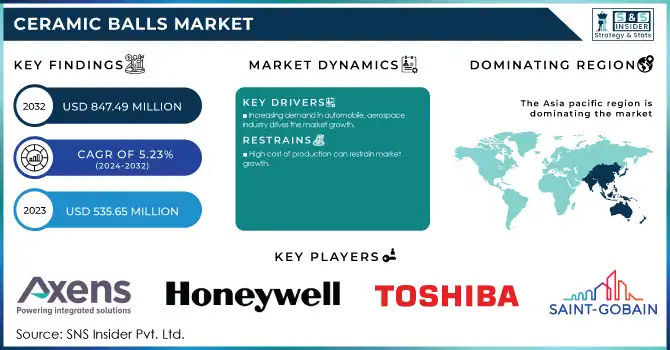
The Ceramic Balls Market was USD 535.65 Million in 2023 and is expected to reach USD 847.49 Million by 2032, growing at a CAGR of 5.23% over the forecast period of 2024-2032.

Ceramic Balls Market Revenue Analysis

Get E-PDF Sample Report on Ceramic Balls Market - Request Sample Report

In the chemical and petrochemical industries, the increasing demand for ceramic balls due to their oxide chemical resistance, capability to endure high temperatures, and wear-resistance is expected to boost the ceramic balls market. Since ceramic balls are the widely used catalyst bed support media in many petrochemical refineries and chemical processing plants, they provide superior stability in extreme conditions. Because of this, they make perfect candidates for reactors, absorbers, and separation processes due to their great resistivity to acids, alkaline, and extreme heat. They also reduce process contamination and increase equipment life relative to metal or polymer-based alternatives, thus increasing process efficiency. The growing global consumption of accidents and other specialty chemicals, ever-increasing economic development, and related demand for refined petrochemical products would drive the growth of ceramic balls, and with the help of the latest mechanical and thermal properties-enhancing material engineering techniques, the mechanical and thermal properties could be further improved, thereby providing a competitive edge over the market players.

Recent technological advancements in manufacturing techniques have enhanced the quality, performance, and cost-effectiveness of these products, and this has led to a wider adoption of ceramic balls across various industries. Advancements in precision engineering, material science, and automated production processes have led manufacturers to synthesis more mechanical strength, sphericity and wear resistance in ceramic balls for this industry. Development of hot isostatic pressing (HIP), and spark plasma sintering (SPS) techniques in advanced sintering technology have produced denser, tougher ceramics. Moreover, combining computer-aided design (CAD) with an artificial intelligence (AI)-based quality control system has improved production efficiency and lessened defect rates. These technological improvements have broadened the application of ceramic balls, in aerospace, medical and high-speed machinery industries where performance and durability are crucial. In an effort to continue developing more efficient and cost-effective solutions for industrial applications, further advances by R&D teams will develop ceramic balls through nanotechnology and additive manufacturing.

Additionally, the U.S. ceramics manufacturing industry has shown growth, with approximately 12,994 individuals employed across 1,887 businesses as of April 2023.

Ceramic Balls Market Dynamics

Drivers

  • Increasing demand in automobile, aerospace industry drives the market growth.

High strength, wear resistance, lower weight, and desirable mechanical properties of ceramic balls are the factors responsible for driving the automobile and aerospace industry, which in turn, will drive market growth. Automobile is one of the booming end-use industries, where ceramic balls are utilized in high precision components including bearings, valves and clutch system, presence of ceramic balls reduces the high temperature and extreme friction, hence, improving the efficiency and longevity of vehicle hardware. Their light weight further aids fuel efficiency, key in making cars green and powerful. Ceramic balls are used in key aerospace applications, such as turbine engines, bearings and other high-speed high precision components. They improve the reliability and performance of aerospace components, especially in severe service temperature and other adverse environments, due to their resistance to heat and corrosion. With both industries striving to provide even more performance and sustainability, the carrying capacity of advanced materials such as ceramic balls will increasingly need to drive market development.

Restraint

  • High cost of production can restrain market growth.

High production cost is one of the major factors which restrains the growth of the ceramic balls market. The making of ceramic balls should take use of advanced materials and special production process with high temperature sintering, and precision machining, and they are expensive. Production costs are driven even higher by patented procedures to make ceramic balls using premium raw materials including silicon nitride, zirconia, and alumina which are necessary to achieve high strength and durability. Also, the processes involved to manufacture these high-end ceramic balls are quite complicated and energy-taking which in turn increases the costs. This can translate to a high-end product and make it of prohibitive expense compared to typical metal or plastic alternatives, preventing widespread acceptance, especially within price-sensitive industries or regions. Although ceramic balls provide marked improvements in performance and durability, the initial investment cost can be a significant barrier to widespread adoption and market growth, especially in the developing regions of the world where cost consideration can have an outsized impact on adoption.

Opportunity

  • Research and development activities for products are estimated to generate significant opportunities in the market

  • Raising demand from wind farm are creating new opportunities for market growth

Ceramic Balls Market Segmentation Analysis

By Material

Alumina held the largest market share 44% in 2023.  It is owing to combination of excellent properties, availability, and cost-based challenges. Alumina is ideal for high strength, wear-resistant applications and is used in industrial applications such as bearings, valves, and catalytic supports. As a material, alumina is also durable and resistant to high temperatures, and corrosion which also makes it perfect to withstand harsh environments in the automotive, aerospace, and chemical industries. In addition, compared to other advanced ceramic materials, such as silicon nitride or zirconia, alumina is relatively abundant and inexpensive, and permeated by industrial ropes. Due to its versatile nature and its relatively low production costs, alumina has emerged as one of the leading materials in the ceramic balls market, thus continuing to maintain its prominent position in the market.

By Function

Inert function held the largest market share around 68% in 2023. Due to its resistance of high purity silicone to acids, bases, and other corrosive substances means they are ideal for applications where interaction of the reaction solution with any reactive chemical can alter the quality of products or the efficiency of the process. Characteristics like inert function of ceramic balls are highly attractive in high-temperature high-pressure applications, such as the refining of petrochemical products, where it is beneficial that the ceramic balls do not change form, or in many cases release contaminants into the process. The increasing demand for inert materials to meet sustainable, non-reactive material requirements in industrial processes reinforces this wide-ranging and fundamental applicability, which is expected to result in the largest share of the overall market for inert function segment.

By Application

Bearing held the largest market share around 42% in 2023.Due to these attributes, ceramic balls are often sought after in extreme applications in industries such as automotive, aerospace, and industrial machinery, where speed, low maintenance, and durability are all essential functions. Ceramic bearings are utilized in automotive applications, such as in the engine, transmission, and turbochargers, and help reduce friction and wear in order to improve fuel efficiency and lower emissions. Ceramic bearings play an essential role in turbine engines and other rotating parts in aerospace, where the needs for high-temperature and stress resistance are significant. The rising requirement for high-speed and energy-efficient systems in such industries has led to an increase in the adoption of ceramic bearings, thus having the largest application segment in this market.

Ceramic Balls Market Regional Outlook

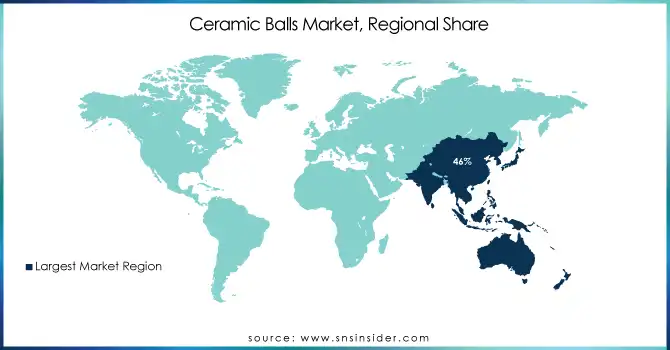
Asia pacific has the highest share of ceramic balls market share around 46% in 2023.  Due to significant activities in some of the critical industrial sectors, including automotive, aerospace, manufacturing, and chemical processing, Asia-Pacific accounts for a lion's share of the global ceramic balls market. As one of the fastest developing areas of the world with huge manufacturing powers, China, Japan, and India speeding up industrialization for better development, the region will surely not allow this to happen. The rapid growth of the automotive and aerospace industries in the region (specifically China) repaired with the widespread use of ceramic balls in bearings, valves, and other components contributes significantly to the market growth in this region. Asia-Pacific also accounts for a most of the ceramic balls used in chemical and petrochemical industries, where they are used as catalyst supports and in other high-temperature and corrosion-resistant applications. Moreover, the region offers low-cost production capacity and high-scale manufacturing infrastructure supporting the ceramic balls to be more readily available and affordable for many industries. Another driver for market dominance by Asia-pacific is the ever-advancing technological processes in terms of manufacturing these ceramic materials, as well as the lower pricing.

Ceramic-Balls-Market-Regional-Share

Get Customized Report as Per Your Business Requirement - Request For Customized Report

Key Players

  • Axens (Catalyst Bed Support, Reactor Internals)

  • Honeywell International (Aerospace Bearings, Catalysts)

  • Saint-Gobain (Ceramic Balls, Catalyst Supports)

  • Toshiba Materials Co. (Ceramic Ball Bearings, Wear-resistant Components)

  • Global Precision Ball & Roller (Precision Ceramic Balls, Steel Balls)

  • Fineway Ceramics (Grinding Media, Ceramic Balls)

  • Tsabuki Nakashima Co. Ltd (Ceramic Balls, Bearing Balls)

  • Topack Ceramics Pvt Ltd (Industrial Ceramic Balls, Grinding Media)

  • CoorsTek, Inc. (Alumina Ceramic Balls, Zirconia Balls)

  • SKF (Ceramic Ball Bearings, High-performance Bearings)

  • Ceramic Bearings (Silicon Nitride Bearings, Hybrid Ceramic Bearings)

  • NGK Spark Plug Co. (Ceramic Balls, Advanced Ceramics)

  • Kyocera Corporation (Alumina Ceramic Balls, Ball Bearings)

  • 3M (Ceramic Balls, Grinding Media)

  • Rauschert (Ceramic Media, Porcelain Balls)

  • SinterBall (Sintered Ceramic Balls, Catalyst Carrier Balls)

  • Saint-Gobain Ceramic Materials (Ceramic Balls, Grinding Media)

  • Precision Ceramics (Silicon Nitride Balls, Zirconia Balls)

  • Morgan Advanced Materials (Ceramic Bearings, Catalyst Support Balls)

  • DuPont (Ceramic Ball Bearings, High-performance Ceramics)

Recent Development:

  •  In 2023, Saint-Gobain announced the expansion of its ceramic materials division to enhance production capacity for advanced ceramic balls, aiming to meet the growing demand in the automotive and aerospace sectors.

  • In 2023, SKF introduced a new line of hybrid ceramic ball bearings designed to improve performance and energy efficiency in electric vehicles, addressing the increasing need for sustainable automotive solutions.

  •  In 2023, CoorsTek expanded its manufacturing capabilities by opening a new facility dedicated to producing high-purity ceramic balls for medical applications, enhancing their presence in the healthcare sector.

Ceramic Balls Market Report Scope:

Report Attributes Details
Market Size in 2023 USD 535.35 Million
Market Size by 2032 USD 847.49 Million
CAGR CAGR of 5.23% From 2024 to 2032
Base Year 2023
Forecast Period 2024-2032
Historical Data 2020-2022
Report Scope & Coverage Market Size, Segments Analysis, Competitive  Landscape, Regional Analysis, DROC & SWOT Analysis, Forecast Outlook
Key Segments • By Material (Silicon, Zirconia, Alumina, Others)
• By Function (Inert, Active)
• By Application (Grinding, Valve, Bearing, Others)
• By End-User (Chemical, Aerospace, Automotive, Others)
Regional Analysis/Coverage North America (US, Canada, Mexico), Europe (Eastern Europe [Poland, Romania, Hungary, Turkey, Rest of Eastern Europe] Western Europe] Germany, France, UK, Italy, Spain, Netherlands, Switzerland, Austria, Rest of Western Europe]), Asia Pacific (China, India, Japan, South Korea, Vietnam, Singapore, Australia, Rest of Asia Pacific), Middle East & Africa (Middle East [UAE, Egypt, Saudi Arabia, Qatar, Rest of Middle East], Africa [Nigeria, South Africa, Rest of Africa], Latin America (Brazil, Argentina, Colombia, Rest of Latin America)
Company Profiles
Axens, Honeywell International, Saint-Gobain, Toshiba Materials Co., Global Precision Ball & Roller, Fineway Ceramics, Tsabuki Nakashima Co. Ltd, Topack Ceramics Pvt Ltd, CoorsTek, Inc., SKF, Ceramic Bearings, NGK Spark Plug Co., Kyocera Corporation, 3M, Rauschert, SinterBall, Saint-Gobain Ceramic Materials, Precision Ceramics, Morgan Advanced Materials, DuPont
Key Drivers • Increasing demand in automobile, aerospace industry drives the market growth.   
Restraints • High cost of production can restrain market growth.

Frequently Asked Questions

Ans: The Ceramic Balls Market was valued at USD 535.65 Million in 2023.

Ans: The expected CAGR of the global Ceramic Balls Market during the forecast period is 5.23%.

Ans: The bearing application will grow rapidly in the Ceramic Balls Market from 2024-2032.

Ans: Increasing demand in automobile, aerospace industry drives the market growth.

Ans: The Asia Pacific led the Ceramic Balls Market in the region with the highest revenue share in 2023.

Table of Contents:

1. Introduction

1.1 Market Definition

1.2 Scope (Inclusion and Exclusions)

1.3 Research Assumptions

2. Executive Summary

2.1 Market Overview

2.2 Regional Synopsis

2.3 Competitive Summary

3. Research Methodology

3.1 Top-Down Approach

3.2 Bottom-up Approach

3.3. Data Validation

3.4 Primary Interviews

4. Market Dynamics Impact Analysis

4.1 Market Driving Factors Analysis

4.1.1 Drivers

4.1.2 Restraints

4.1.3 Opportunities

4.1.4 Challenges

4.2 PESTLE Analysis

4.3 Porter’s Five Forces Model

5. Statistical Insights and Trends Reporting

5.1 By Production Capacity and Utilization, by Country, By Type, 2023

5.2 Feedstock Prices, by Country, By Type, 2023

5.3   Regulatory Impact, by l Country, By Type, 2023.

5.4 Environmental Metrics: Emissions Data, Waste Management Practices, and Sustainability Initiatives, by Region

5.5 Innovation and R&D, Type, 2023

6. Competitive Landscape

6.1 List of Major Companies, By Region

6.2 Market Share Analysis, By Region

6.3 Product Benchmarking

6.3.1 Product specifications and features

6.3.2 Pricing

6.4 Strategic Initiatives

6.4.1 Marketing and promotional activities

6.4.2 Distribution and supply chain strategies

6.4.3 Expansion plans and new product launches

6.4.4 Strategic partnerships and collaborations

6.5 Technological Advancements

6.6 Market Positioning and Branding

7. Ceramic Balls Market Segmentation, by Material Type

7.1 Chapter Overview

7.2 Silicon

7.2.1 Silicon Market Trends Analysis (2020-2032)

7.2.2 Silicon Market Size Estimates and Forecasts to 2032 (USD Million)

7.3 Zirconia

        7.3.1 Zirconia Market Trends Analysis (2020-2032)

7.3.2 Zirconia Market Size Estimates and Forecasts to 2032 (USD Million)

7.4 Alumina

7.4.1 Alumina Market Trends Analysis (2020-2032)

7.4.2 Alumina Market Size Estimates and Forecasts to 2032 (USD Million)

7.5 Others

7.5.1 Others Market Trends Analysis (2020-2032)

7.5.2 Others Market Size Estimates and Forecasts to 2032 (USD Million)

8. Ceramic Balls Market Segmentation, By Function

8.1 Chapter Overview

8.2 Inert

        8.2.1 Inert Market Trends Analysis (2020-2032)

8.2.2 Inert Market Size Estimates and Forecasts to 2032 (USD Million)

8.3 Active

        8.3.1 Active Market Trends Analysis (2020-2032)

8.3.2 Active Market Size Estimates and Forecasts to 2032 (USD Million)

9. Ceramic Balls Market Segmentation, By Application

9.1 Chapter Overview

9.2 Grinding

9.2.1 Grinding Market Trends Analysis (2020-2032)

9.2.2 Grinding Market Size Estimates and Forecasts to 2032 (USD Million)

9.3 Valve

9.3.1 Valve Market Trends Analysis (2020-2032)

9.3.2 Valve Market Size Estimates and Forecasts to 2032 (USD Million)

9.4 Bearing

9.4.1 Bearing Market Trends Analysis (2020-2032)

9.4.2 Bearing Market Size Estimates and Forecasts to 2032 (USD Million)

9.4 Others

9.4.1 Others Market Trends Analysis (2020-2032)

9.4.2 Others Market Size Estimates and Forecasts to 2032 (USD Million)

10. Ceramic Balls Market Segmentation, by End-User

10.1 Chapter Overview

10.2 Chemical

10.2.1 Chemical Market Trends Analysis (2020-2032)

10.2.2 Chemical Market Size Estimates and Forecasts to 2032 (USD Million)

10.3 Aerospace

10.3.1 Aerospace Market Trends Analysis (2020-2032)

10.3.2 Aerospace Market Size Estimates and Forecasts to 2032 (USD Million)

10.4 Automotive

        10.4.1 Automotive Market Trends Analysis (2020-2032)

10.4.2 Automotive Market Size Estimates and Forecasts to 2032 (USD Million)

10.5 Others

10.5. Others Market Trends Analysis (2020-2032)

10.5.2 Others Market Size Estimates and Forecasts to 2032 (USD Million)

11. Regional Analysis

11.1 Chapter Overview

11.2 North America

11.2.1 Trends Analysis

11.2.2 North America Ceramic Balls Market Estimates and Forecasts, by Country (2020-2032) (USD Million)

11.2.3 North America Ceramic Balls Market Estimates and Forecasts, by Material Type (2020-2032) (USD Million)  

11.2.4 North America Ceramic Balls Market Estimates and Forecasts, By Function (2020-2032) (USD Million)

11.2.5 North America Ceramic Balls Market Estimates and Forecasts, By Application (2020-2032) (USD Million)

11.2.6 North America Ceramic Balls Market Estimates and Forecasts, by End-User (2020-2032) (USD Million)

11.2.7 USA

11.2.7.1 USA Ceramic Balls Market Estimates and Forecasts, by Material Type (2020-2032) (USD Million)

11.2.7.2 USA Ceramic Balls Market Estimates and Forecasts, By Function (2020-2032) (USD Million)

11.2.7.3 USA Ceramic Balls Market Estimates and Forecasts, By Application (2020-2032) (USD Million)

11.2.7.4 USA Ceramic Balls Market Estimates and Forecasts, by End-User (2020-2032) (USD Million)

11.2.8 Canada

11.2.8.1 Canada Ceramic Balls Market Estimates and Forecasts, by Material Type (2020-2032) (USD Million)

11.2.8.2 Canada Ceramic Balls Market Estimates and Forecasts, By Function (2020-2032) (USD Million)

11.2.8.3 Canada Ceramic Balls Market Estimates and Forecasts, By Application (2020-2032) (USD Million)

11.2.8.4 Canada Ceramic Balls Market Estimates and Forecasts, by End-User (2020-2032) (USD Million)

11.2.9 Mexico

11.2.9.1 Mexico Ceramic Balls Market Estimates and Forecasts, by Material Type (2020-2032) (USD Million)

11.2.9.2 Mexico Ceramic Balls Market Estimates and Forecasts, By Function (2020-2032) (USD Million)

11.2.9.3 Mexico Ceramic Balls Market Estimates and Forecasts, By Application (2020-2032) (USD Million)

11.2.9.4 Mexico Ceramic Balls Market Estimates and Forecasts, by End-User (2020-2032) (USD Million)

11.3 Europe

11.3.1 Eastern Europe

11.3.1.1 Trends Analysis

11.3.1.2 Eastern Europe Ceramic Balls Market Estimates and Forecasts, by Country (2020-2032) (USD Million)

11.3.1.3 Eastern Europe Ceramic Balls Market Estimates and Forecasts, by Material Type (2020-2032) (USD Million)  

11.3.1.4 Eastern Europe Ceramic Balls Market Estimates and Forecasts, By Function (2020-2032) (USD Million)

11.3.1.5 Eastern Europe Ceramic Balls Market Estimates and Forecasts, By Application (2020-2032) (USD Million)

11.3.1.6 Eastern Europe Ceramic Balls Market Estimates and Forecasts, by End-User (2020-2032) (USD Million)

11.3.1.7 Poland

11.3.1.7.1 Poland Ceramic Balls Market Estimates and Forecasts, by Material Type (2020-2032) (USD Million)

11.3.1.7.2 Poland Ceramic Balls Market Estimates and Forecasts, By Function (2020-2032) (USD Million)

11.3.1.7.3 Poland Ceramic Balls Market Estimates and Forecasts, By Application (2020-2032) (USD Million)

11.3.1.7.4 Poland Ceramic Balls Market Estimates and Forecasts, by End-User (2020-2032) (USD Million)

11.3.1.8 Romania

11.3.1.8.1 Romania Ceramic Balls Market Estimates and Forecasts, by Material Type (2020-2032) (USD Million)

11.3.1.8.2 Romania Ceramic Balls Market Estimates and Forecasts, By Function (2020-2032) (USD Million)

11.3.1.8.3 Romania Ceramic Balls Market Estimates and Forecasts, By Application (2020-2032) (USD Million)

11.3.1.8.4 Romania Ceramic Balls Market Estimates and Forecasts, by End-User (2020-2032) (USD Million)

11.3.1.9 Hungary

11.3.1.9.1 Hungary Ceramic Balls Market Estimates and Forecasts, by Material Type (2020-2032) (USD Million)

11.3.1.9.2 Hungary Ceramic Balls Market Estimates and Forecasts, By Function (2020-2032) (USD Million)

11.3.1.9.3 Hungary Ceramic Balls Market Estimates and Forecasts, By Application (2020-2032) (USD Million)

11.3.1.9.4 Hungary Ceramic Balls Market Estimates and Forecasts, by End-User (2020-2032) (USD Million)

11.3.1.10 Turkey

11.3.1.10.1 Turkey Ceramic Balls Market Estimates and Forecasts, by Material Type (2020-2032) (USD Million)

11.3.1.10.2 Turkey Ceramic Balls Market Estimates and Forecasts, By Function (2020-2032) (USD Million)

11.3.1.10.3 Turkey Ceramic Balls Market Estimates and Forecasts, By Application (2020-2032) (USD Million)

11.3.1.10.4 Turkey Ceramic Balls Market Estimates and Forecasts, by End-User (2020-2032) (USD Million)

11.3.1.11 Rest of Eastern Europe

11.3.1.11.1 Rest of Eastern Europe Ceramic Balls Market Estimates and Forecasts, by Material Type (2020-2032) (USD Million)

11.3.1.11.2 Rest of Eastern Europe Ceramic Balls Market Estimates and Forecasts, By Function (2020-2032) (USD Million)

11.3.1.11.3 Rest of Eastern Europe Ceramic Balls Market Estimates and Forecasts, By Application (2020-2032) (USD Million)

11.3.1.11.4 Rest of Eastern Europe Ceramic Balls Market Estimates and Forecasts, by End-User (2020-2032) (USD Million)

11.3.2 Western Europe

11.3.2.1 Trends Analysis

11.3.2.2 Western Europe Ceramic Balls Market Estimates and Forecasts, by Country (2020-2032) (USD Million)

11.3.2.3 Western Europe Ceramic Balls Market Estimates and Forecasts, by Material Type (2020-2032) (USD Million)  

11.3.2.4 Western Europe Ceramic Balls Market Estimates and Forecasts, By Function (2020-2032) (USD Million)

11.3.2.5 Western Europe Ceramic Balls Market Estimates and Forecasts, By Application (2020-2032) (USD Million)

11.3.2.6 Western Europe Ceramic Balls Market Estimates and Forecasts, by End-User (2020-2032) (USD Million)

11.3.2.7 Germany

11.3.2.7.1 Germany Ceramic Balls Market Estimates and Forecasts, by Material Type (2020-2032) (USD Million)

11.3.2.7.2 Germany Ceramic Balls Market Estimates and Forecasts, By Function (2020-2032) (USD Million)

11.3.2.7.3 Germany Ceramic Balls Market Estimates and Forecasts, By Application (2020-2032) (USD Million)

11.3.2.7.4 Germany Ceramic Balls Market Estimates and Forecasts, by End-User (2020-2032) (USD Million)

11.3.2.8 France

11.3.2.8.1 France Ceramic Balls Market Estimates and Forecasts, by Material Type (2020-2032) (USD Million)

11.3.2.8.2 France Ceramic Balls Market Estimates and Forecasts, By Function (2020-2032) (USD Million)

11.3.2.8.3 France Ceramic Balls Market Estimates and Forecasts, By Application (2020-2032) (USD Million)

11.3.2.8.4 France Ceramic Balls Market Estimates and Forecasts, by End-User (2020-2032) (USD Million)

11.3.2.9 UK

11.3.2.9.1 UK Ceramic Balls Market Estimates and Forecasts, by Material Type (2020-2032) (USD Million)

11.3.2.9.2 UK Ceramic Balls Market Estimates and Forecasts, By Function (2020-2032) (USD Million)

11.3.2.9.3 UK Ceramic Balls Market Estimates and Forecasts, By Application (2020-2032) (USD Million)

11.3.2.9.4 UK Ceramic Balls Market Estimates and Forecasts, by End-User (2020-2032) (USD Million)

11.3.2.10 Italy

11.3.2.10.1 Italy Ceramic Balls Market Estimates and Forecasts, by Material Type (2020-2032) (USD Million)

11.3.2.10.2 Italy Ceramic Balls Market Estimates and Forecasts, By Function (2020-2032) (USD Million)

11.3.2.10.3 Italy Ceramic Balls Market Estimates and Forecasts, By Application (2020-2032) (USD Million)

11.3.2.10.4 Italy Ceramic Balls Market Estimates and Forecasts, by End-User (2020-2032) (USD Million)

11.3.2.11 Spain

11.3.2.11.1 Spain Ceramic Balls Market Estimates and Forecasts, by Material Type (2020-2032) (USD Million)

11.3.2.11.2 Spain Ceramic Balls Market Estimates and Forecasts, By Function (2020-2032) (USD Million)

11.3.2.11.3 Spain Ceramic Balls Market Estimates and Forecasts, By Application (2020-2032) (USD Million)

11.3.2.11.4 Spain Ceramic Balls Market Estimates and Forecasts, by End-User (2020-2032) (USD Million)

11.3.2.12 Netherlands

11.3.2.12.1 Netherlands Ceramic Balls Market Estimates and Forecasts, by Material Type (2020-2032) (USD Million)

11.3.2.12.2 Netherlands Ceramic Balls Market Estimates and Forecasts, By Function (2020-2032) (USD Million)

11.3.2.12.3 Netherlands Ceramic Balls Market Estimates and Forecasts, By Application (2020-2032) (USD Million)

11.3.2.12.4 Netherlands Ceramic Balls Market Estimates and Forecasts, by End-User (2020-2032) (USD Million)

11.3.2.13 Switzerland

11.3.2.13.1 Switzerland Ceramic Balls Market Estimates and Forecasts, by Material Type (2020-2032) (USD Million)

11.3.2.13.2 Switzerland Ceramic Balls Market Estimates and Forecasts, By Function (2020-2032) (USD Million)

11.3.2.13.3 Switzerland Ceramic Balls Market Estimates and Forecasts, By Application (2020-2032) (USD Million)

11.3.2.13.4 Switzerland Ceramic Balls Market Estimates and Forecasts, by End-User (2020-2032) (USD Million)

11.3.2.14 Austria

11.3.2.14.1 Austria Ceramic Balls Market Estimates and Forecasts, by Material Type (2020-2032) (USD Million)

11.3.2.14.2 Austria Ceramic Balls Market Estimates and Forecasts, By Function (2020-2032) (USD Million)

11.3.2.14.3 Austria Ceramic Balls Market Estimates and Forecasts, By Application (2020-2032) (USD Million)

11.3.2.14.4 Austria Ceramic Balls Market Estimates and Forecasts, by End-User (2020-2032) (USD Million)

11.3.2.15 Rest of Western Europe

11.3.2.15.1 Rest of Western Europe Ceramic Balls Market Estimates and Forecasts, by Material Type (2020-2032) (USD Million)

11.3.2.15.2 Rest of Western Europe Ceramic Balls Market Estimates and Forecasts, By Function (2020-2032) (USD Million)

11.3.2.15.3 Rest of Western Europe Ceramic Balls Market Estimates and Forecasts, By Application (2020-2032) (USD Million)

11.3.2.15.4 Rest of Western Europe Ceramic Balls Market Estimates and Forecasts, by End-User (2020-2032) (USD Million)

11.4 Asia-Pacific

11.4.1 Trends Analysis

11.4.2 Asia-Pacific Ceramic Balls Market Estimates and Forecasts, by Country (2020-2032) (USD Million)

11.4.3 Asia-Pacific Ceramic Balls Market Estimates and Forecasts, by Material Type (2020-2032) (USD Million)  

11.4.4 Asia-Pacific Ceramic Balls Market Estimates and Forecasts, By Function (2020-2032) (USD Million)

11.4.5 Asia-Pacific Ceramic Balls Market Estimates and Forecasts, By Application (2020-2032) (USD Million)

11.4.6 Asia-Pacific Ceramic Balls Market Estimates and Forecasts, by End-User (2020-2032) (USD Million)

11.4.7 China

11.4.7.1 China Ceramic Balls Market Estimates and Forecasts, by Material Type (2020-2032) (USD Million)

11.4.7.2 China Ceramic Balls Market Estimates and Forecasts, By Function (2020-2032) (USD Million)

11.4.7.3 China Ceramic Balls Market Estimates and Forecasts, By Application (2020-2032) (USD Million)

11.4.7.4 China Ceramic Balls Market Estimates and Forecasts, by End-User (2020-2032) (USD Million)

11.4.8 India

11.4.8.1 India Ceramic Balls Market Estimates and Forecasts, by Material Type (2020-2032) (USD Million)

11.4.8.2 India Ceramic Balls Market Estimates and Forecasts, By Function (2020-2032) (USD Million)

11.4.8.3 India Ceramic Balls Market Estimates and Forecasts, By Application (2020-2032) (USD Million)

11.4.8.4 India Ceramic Balls Market Estimates and Forecasts, by End-User (2020-2032) (USD Million)

11.4.9 Japan

11.4.9.1 Japan Ceramic Balls Market Estimates and Forecasts, by Material Type (2020-2032) (USD Million)

11.4.9.2 Japan Ceramic Balls Market Estimates and Forecasts, By Function (2020-2032) (USD Million)

11.4.9.3 Japan Ceramic Balls Market Estimates and Forecasts, By Application (2020-2032) (USD Million)

11.4.9.4 Japan Ceramic Balls Market Estimates and Forecasts, by End-User (2020-2032) (USD Million)

11.4.10 South Korea

11.4.10.1 South Korea Ceramic Balls Market Estimates and Forecasts, by Material Type (2020-2032) (USD Million)

11.4.10.2 South Korea Ceramic Balls Market Estimates and Forecasts, By Function (2020-2032) (USD Million)

11.4.10.3 South Korea Ceramic Balls Market Estimates and Forecasts, By Application (2020-2032) (USD Million)

11.4.10.4 South Korea Ceramic Balls Market Estimates and Forecasts, by End-User (2020-2032) (USD Million)

11.4.11 Vietnam

11.4.11.1 Vietnam Ceramic Balls Market Estimates and Forecasts, by Material Type (2020-2032) (USD Million)

11.4.11.2 Vietnam Ceramic Balls Market Estimates and Forecasts, By Function (2020-2032) (USD Million)

11.4.11.3 Vietnam Ceramic Balls Market Estimates and Forecasts, By Application (2020-2032) (USD Million)

11.4.11.4 Vietnam Ceramic Balls Market Estimates and Forecasts, by End-User (2020-2032) (USD Million)

11.4.12 Singapore

11.4.12.1 Singapore Ceramic Balls Market Estimates and Forecasts, by Material Type (2020-2032) (USD Million)

11.4.12.2 Singapore Ceramic Balls Market Estimates and Forecasts, By Function (2020-2032) (USD Million)

11.4.12.3 Singapore Ceramic Balls Market Estimates and Forecasts, By Application (2020-2032) (USD Million)

11.4.12.4 Singapore Ceramic Balls Market Estimates and Forecasts, by End-User (2020-2032) (USD Million)

11.4.13 Australia

11.4.13.1 Australia Ceramic Balls Market Estimates and Forecasts, by Material Type (2020-2032) (USD Million)

11.4.13.2 Australia Ceramic Balls Market Estimates and Forecasts, By Function (2020-2032) (USD Million)

11.4.13.3 Australia Ceramic Balls Market Estimates and Forecasts, By Application (2020-2032) (USD Million)

11.4.13.4 Australia Ceramic Balls Market Estimates and Forecasts, by End-User (2020-2032) (USD Million)

11.4.14 Rest of Asia-Pacific

11.4.14.1 Rest of Asia-Pacific Ceramic Balls Market Estimates and Forecasts, by Material Type (2020-2032) (USD Million)

11.4.14.2 Rest of Asia-Pacific Ceramic Balls Market Estimates and Forecasts, By Function (2020-2032) (USD Million)

11.4.14.3 Rest of Asia-Pacific Ceramic Balls Market Estimates and Forecasts, By Application (2020-2032) (USD Million)

11.4.14.4 Rest of Asia-Pacific Ceramic Balls Market Estimates and Forecasts, by End-User (2020-2032) (USD Million)

11.5 Middle East and Africa

11.5.1 Middle East

11.5.1.1 Trends Analysis

11.5.1.2 Middle East Ceramic Balls Market Estimates and Forecasts, by Country (2020-2032) (USD Million)

11.5.1.3 Middle East Ceramic Balls Market Estimates and Forecasts, by Material Type (2020-2032) (USD Million)  

11.5.1.4 Middle East Ceramic Balls Market Estimates and Forecasts, By Function (2020-2032) (USD Million)

11.5.1.5 Middle East Ceramic Balls Market Estimates and Forecasts, By Application (2020-2032) (USD Million)

11.5.1.6 Middle East Ceramic Balls Market Estimates and Forecasts, by End-User (2020-2032) (USD Million)

11.5.1.7 UAE

11.5.1.7.1 UAE Ceramic Balls Market Estimates and Forecasts, by Material Type (2020-2032) (USD Million)

11.5.1.7.2 UAE Ceramic Balls Market Estimates and Forecasts, By Function (2020-2032) (USD Million)

11.5.1.7.3 UAE Ceramic Balls Market Estimates and Forecasts, By Application (2020-2032) (USD Million)

11.5.1.7.4 UAE Ceramic Balls Market Estimates and Forecasts, by End-User  (2020-2032) (USD Million)

11.5.1.8 Egypt

11.5.1.8.1 Egypt Ceramic Balls Market Estimates and Forecasts, by Material Type (2020-2032) (USD Million)

11.5.1.8.2 Egypt Ceramic Balls Market Estimates and Forecasts, By Function (2020-2032) (USD Million)

11.5.1.8.3 Egypt Ceramic Balls Market Estimates and Forecasts, By Application (2020-2032) (USD Million)

11.5.1.8.4 Egypt Ceramic Balls Market Estimates and Forecasts, by End-User (2020-2032) (USD Million)

11.5.1.9 Saudi Arabia

11.5.1.9.1 Saudi Arabia Ceramic Balls Market Estimates and Forecasts, by Material Type (2020-2032) (USD Million)

11.5.1.9.2 Saudi Arabia Ceramic Balls Market Estimates and Forecasts, By Function (2020-2032) (USD Million)

11.5.1.9.3 Saudi Arabia Ceramic Balls Market Estimates and Forecasts, By Application (2020-2032) (USD Million)

11.5.1.9.4 Saudi Arabia Ceramic Balls Market Estimates and Forecasts, by End-User (2020-2032) (USD Million)

11.5.1.10 Qatar

11.5.1.10.1 Qatar Ceramic Balls Market Estimates and Forecasts, by Material Type (2020-2032) (USD Million)

11.5.1.10.2 Qatar Ceramic Balls Market Estimates and Forecasts, By Function (2020-2032) (USD Million)

11.5.1.10.3 Qatar Ceramic Balls Market Estimates and Forecasts, By Application (2020-2032) (USD Million)

11.5.1.10.4 Qatar Ceramic Balls Market Estimates and Forecasts, by End-User (2020-2032) (USD Million)

11.5.1.11 Rest of Middle East

11.5.1.11.1 Rest of Middle East Ceramic Balls Market Estimates and Forecasts, by Material Type (2020-2032) (USD Million)

11.5.1.11.2 Rest of Middle East Ceramic Balls Market Estimates and Forecasts, By Function (2020-2032) (USD Million)

11.5.1.11.3 Rest of Middle East Ceramic Balls Market Estimates and Forecasts, By Application (2020-2032) (USD Million)

11.5.1.11.4 Rest of Middle East Ceramic Balls Market Estimates and Forecasts, by End-User (2020-2032) (USD Million)

11.5.2 Africa

11.5.2.1 Trends Analysis

11.5.2.2 Africa Ceramic Balls Market Estimates and Forecasts, by Country (2020-2032) (USD Million)

11.5.2.3 Africa Ceramic Balls Market Estimates and Forecasts, by Material Type (2020-2032) (USD Million)  

11.5.2.4 Africa Ceramic Balls Market Estimates and Forecasts, By Function (2020-2032) (USD Million)

11.5.2.5 Africa Ceramic Balls Market Estimates and Forecasts, By Application (2020-2032) (USD Million)

11.5.2.6 Africa Ceramic Balls Market Estimates and Forecasts, by End-User (2020-2032) (USD Million)

11.5.2.7 South Africa

11.5.2.7.1 South Africa Ceramic Balls Market Estimates and Forecasts, by Material Type (2020-2032) (USD Million)

11.5.2.7.2 South Africa Ceramic Balls Market Estimates and Forecasts, By Function (2020-2032) (USD Million)

11.5.2.7.3 South Africa Ceramic Balls Market Estimates and Forecasts, By Application (2020-2032) (USD Million)

11.5.2.7.4 South Africa Ceramic Balls Market Estimates and Forecasts, by End-User (2020-2032) (USD Million)

11.5.2.8 Nigeria

11.5.2.8.1 Nigeria Ceramic Balls Market Estimates and Forecasts, by Material Type (2020-2032) (USD Million)

11.5.2.8.2 Nigeria Ceramic Balls Market Estimates and Forecasts, By Function (2020-2032) (USD Million)

11.5.2.8.3 Nigeria Ceramic Balls Market Estimates and Forecasts, By Application (2020-2032) (USD Million)

11.5.2.8.4 Nigeria Ceramic Balls Market Estimates and Forecasts, by End-User (2020-2032) (USD Million)

11.5.2.9 Rest of Africa

11.5.2.9.1 Rest of Africa Ceramic Balls Market Estimates and Forecasts, by Material Type (2020-2032) (USD Million)

11.5.2.9.2 Rest of Africa Ceramic Balls Market Estimates and Forecasts, By Function (2020-2032) (USD Million)

11.5.2.9.3 Rest of Africa Ceramic Balls Market Estimates and Forecasts, By Application (2020-2032) (USD Million)

11.5.2.9.4 Rest of Africa Ceramic Balls Market Estimates and Forecasts, by End-User (2020-2032) (USD Million)

11.6 Latin America

11.6.1 Trends Analysis

11.6.2 Latin America Ceramic Balls Market Estimates and Forecasts, by Country (2020-2032) (USD Million)

11.6.3 Latin America Ceramic Balls Market Estimates and Forecasts, by Material Type (2020-2032) (USD Million)  

11.6.4 Latin America Ceramic Balls Market Estimates and Forecasts, By Function (2020-2032) (USD Million)

11.6.5 Latin America Ceramic Balls Market Estimates and Forecasts, By Application (2020-2032) (USD Million)

11.6.6 Latin America Ceramic Balls Market Estimates and Forecasts, by End-User (2020-2032) (USD Million)

11.6.7 Brazil

11.6.7.1 Brazil Ceramic Balls Market Estimates and Forecasts, by Material Type (2020-2032) (USD Million)

11.6.7.2 Brazil Ceramic Balls Market Estimates and Forecasts, By Function (2020-2032) (USD Million)

11.6.7.3 Brazil Ceramic Balls Market Estimates and Forecasts, By Application (2020-2032) (USD Million)

11.6.7.4 Brazil Ceramic Balls Market Estimates and Forecasts, by End-User (2020-2032) (USD Million)

11.6.8 Argentina

11.6.8.1 Argentina Ceramic Balls Market Estimates and Forecasts, by Material Type (2020-2032) (USD Million)

11.6.8.2 Argentina Ceramic Balls Market Estimates and Forecasts, By Function (2020-2032) (USD Million)

11.6.8.3 Argentina Ceramic Balls Market Estimates and Forecasts, By Application (2020-2032) (USD Million)

11.6.8.4 Argentina Ceramic Balls Market Estimates and Forecasts, by End-User (2020-2032) (USD Million)

11.6.9 Colombia

11.6.9.1 Colombia Ceramic Balls Market Estimates and Forecasts, by Material Type (2020-2032) (USD Million)

11.6.9.2 Colombia Ceramic Balls Market Estimates and Forecasts, By Function (2020-2032) (USD Million)

11.6.9.3 Colombia Ceramic Balls Market Estimates and Forecasts, By Application (2020-2032) (USD Million)

11.6.9.4 Colombia Ceramic Balls Market Estimates and Forecasts, by End-User (2020-2032) (USD Million)

11.6.10 Rest of Latin America

11.6.10.1 Rest of Latin America Ceramic Balls Market Estimates and Forecasts, by Material Type (2020-2032) (USD Million)

11.6.10.2 Rest of Latin America Ceramic Balls Market Estimates and Forecasts, By Function (2020-2032) (USD Million)

11.6.10.3 Rest of Latin America Ceramic Balls Market Estimates and Forecasts, By Application (2020-2032) (USD Million)

11.6.10.4 Rest of Latin America Ceramic Balls Market Estimates and Forecasts, by End-User (2020-2032) (USD Million)

12. Company Profiles

12.1 Axens

12.1.1 Company Overview

12.1.2 Financial

12.1.3 Products/ Services Offered

12.1.4 SWOT Analysis

12.2 Honeywell International

             12.2.1 Company Overview

12.2.2 Financial

12.2.3 Products/ Services Offered

12.2.4 SWOT Analysis

12.3 Saint-Gobain

             12.3.1 Company Overview

12.3.2 Financial

12.3.3 Products/ Services Offered

12.3.4 SWOT Analysis

12.4 Toshiba Materials Co.

12.4.1 Company Overview

12.4.2 Financial

12.4.3 Products/ Services Offered

12.4.4 SWOT Analysis

12.5 Global Precision Ball & Roller

             12.5.1 Company Overview

12.5.2 Financial

12.5.3 Products/ Services Offered

12.5.4 SWOT Analysis

12.6 Fineway Ceramics

             12.6.1 Company Overview

12.6.2 Financial

12.6.3 Products/ Services Offered

12.6.4 SWOT Analysis

12.7 Tsabuki Nakashima Co. Ltd

12.7.1 Company Overview

12.7.2 Financial

12.7.3 Products/ Services Offered

12.7.4 SWOT Analysis

12.8 Topack Ceramics Pvt Ltd

             12.8.1 Company Overview

12.8.2 Financial

12.8.3 Products/ Services Offered

12.8.4 SWOT Analysis

12.9 CoorsTek, Inc.

             12.9.1 Company Overview

12.9.2 Financial

12.9.3 Products/ Services Offered

12.9.4 SWOT Analysis

12.10 SKF             

             12.10.1 Company Overview

12.10.2 Financial

12.10.3 Products/ Services Offered

12.10.4 SWOT Analysis

13. Use Cases and Best Practices

14. Conclusion

An accurate research report requires proper strategizing as well as implementation. There are multiple factors involved in the completion of good and accurate research report and selecting the best methodology to compete the research is the toughest part. Since the research reports we provide play a crucial role in any company’s decision-making process, therefore we at SNS Insider always believe that we should choose the best method which gives us results closer to reality. This allows us to reach at a stage wherein we can provide our clients best and accurate investment to output ratio.

Each report that we prepare takes a timeframe of 350-400 business hours for production. Starting from the selection of titles through a couple of in-depth brain storming session to the final QC process before uploading our titles on our website we dedicate around 350 working hours. The titles are selected based on their current market cap and the foreseen CAGR and growth.


The 5 steps process:

Step 1: Secondary Research:

Secondary Research or Desk Research is as the name suggests is a research process wherein, we collect data through the readily available information. In this process we use various paid and unpaid databases which our team has access to and gather data through the same. This includes examining of listed companies’ annual reports, Journals, SEC filling etc. Apart from this our team has access to various associations across the globe across different industries. Lastly, we have exchange relationships with various university as well as individual libraries.

Secondary Research

Step 2: Primary Research

When we talk about primary research, it is a type of study in which the researchers collect relevant data samples directly, rather than relying on previously collected data.  This type of research is focused on gaining content specific facts that can be sued to solve specific problems. Since the collected data is fresh and first hand therefore it makes the study more accurate and genuine.

We at SNS Insider have divided Primary Research into 2 parts.

Part 1 wherein we interview the KOLs of major players as well as the upcoming ones across various geographic regions. This allows us to have their view over the market scenario and acts as an important tool to come closer to the accurate market numbers. As many as 45 paid and unpaid primary interviews are taken from both the demand and supply side of the industry to make sure we land at an accurate judgement and analysis of the market.

This step involves the triangulation of data wherein our team analyses the interview transcripts, online survey responses and observation of on filed participants. The below mentioned chart should give a better understanding of the part 1 of the primary interview.

Primary Research

Part 2: In this part of primary research the data collected via secondary research and the part 1 of the primary research is validated with the interviews from individual consultants and subject matter experts.

Consultants are those set of people who have at least 12 years of experience and expertise within the industry whereas Subject Matter Experts are those with at least 15 years of experience behind their back within the same space. The data with the help of two main processes i.e., FGDs (Focused Group Discussions) and IDs (Individual Discussions). This gives us a 3rd party nonbiased primary view of the market scenario making it a more dependable one while collation of the data pointers.

Step 3: Data Bank Validation

Once all the information is collected via primary and secondary sources, we run that information for data validation. At our intelligence centre our research heads track a lot of information related to the market which includes the quarterly reports, the daily stock prices, and other relevant information. Our data bank server gets updated every fortnight and that is how the information which we collected using our primary and secondary information is revalidated in real time.

Data Bank Validation

Step 4: QA/QC Process

After all the data collection and validation our team does a final level of quality check and quality assurance to get rid of any unwanted or undesired mistakes. This might include but not limited to getting rid of the any typos, duplication of numbers or missing of any important information. The people involved in this process include technical content writers, research heads and graphics people. Once this process is completed the title gets uploader on our platform for our clients to read it.

Step 5: Final QC/QA Process:

This is the last process and comes when the client has ordered the study. In this process a final QA/QC is done before the study is emailed to the client. Since we believe in giving our clients a good experience of our research studies, therefore, to make sure that we do not lack at our end in any way humanly possible we do a final round of quality check and then dispatch the study to the client.

Key Segments

By Material

  • Silicon

  • Zirconia

  • Alumina

  • Others

By Function

  • Inert

  • Active

By Application

  • Grinding

  • Valve

  • Bearing

  • Others

By End-User

  • Chemical

  • Aerospace

  • Automotive

  • Others

Request for Segment Customization as per your Business Requirement: Segment Customization Request

Regional Coverage:

North America

  • US

  • Canada

  • Mexico

Europe

  • Eastern Europe

    • Poland

    • Romania

    • Hungary

    • Turkey

    • Rest of Eastern Europe

  • Western Europe

    • Germany

    • France

    • UK

    • Italy

    • Spain

    • Netherlands

    • Switzerland

    • Austria

    • Rest of Western Europe

Asia Pacific

  • China

  • India

  • Japan

  • South Korea

  • Vietnam

  • Singapore

  • Australia

  • Rest of Asia Pacific

Middle East & Africa

  • Middle East

    • UAE

    • Egypt

    • Saudi Arabia

    • Qatar

    • Rest of Middle East

  • Africa

    • Nigeria

    • South Africa

    • Rest of Africa

  • Latin America

  • Brazil

  • Argentina

  • Colombia

  • Rest of Latin America

Request for Country Level Research Report: Country Level Customization Request

Available Customization

With the given market data, SNS Insider offers customization as per the company’s specific needs. The following customization options are available for the report:

  • Product Analysis

  • Criss-Cross segment analysis (e.g. Product X Application)

  • Product Matrix which gives a detailed comparison of the product portfolio of each company

  • Geographic Analysis

  • Additional countries in any of the regions

  • Company Information

  • Detailed analysis and profiling of additional market players (Up to five)


  •            5000 (33% Discount)


  •            8950 (40% Discount)


  •            3050 (23% Discount)

Start a Conversation

Hi! Click one of our member below to chat on Phone