Cellular M2M Market Report & Scope overview:
The Cellular M2M Market was valued at USD 19.53 billion in 2024 and is expected to reach USD 90.63 billion by 2032, growing at a CAGR of 21.15% from 2025-2032.

Get More Information on Cellular M2M Market - Request Sample Report
The growth of the Cellular M2M Market is driven by rising adoption of IoT applications across industries such as automotive, healthcare, logistics, and utilities. Increasing demand for real-time data monitoring, predictive maintenance, and smart connectivity solutions is fueling market expansion. Advancements in 5G networks, coupled with the need for efficient supply chain operations and connected healthcare services, further accelerate adoption. Additionally, government initiatives supporting digital transformation and the rising integration of AI and cloud platforms are creating new opportunities for market growth.

Cellular M2M Market Size and Forecast
-
Cellular M2M Market Size in 2024: USD 19.53 Billion
-
Cellular M2M Market Size by 2032: USD 90.63 Billion
-
CAGR: 21.15% from 2025 to 2032
-
Base Year: 2024
-
Forecast Period: 2025–2032
-
Historical Data: 2021–2023
Cellular M2M Market Trends
-
Rising adoption of IoT devices and connected ecosystems is driving the cellular M2M market.
-
Growing demand for real-time data exchange in automotive, healthcare, utilities, and logistics is boosting deployment.
-
Expansion of 4G/5G networks is enabling faster, low-latency, and reliable machine-to-machine communication.
-
Increasing use in smart meters, fleet management, and remote monitoring is shaping market growth.
-
Advancements in eSIM and embedded connectivity solutions are enhancing scalability and flexibility.
-
Focus on cost efficiency, automation, and predictive maintenance is fueling adoption across industries.
-
Collaborations between telecom operators, device manufacturers, and IoT solution providers are accelerating innovation.
Cellular M2M Market Growth Drivers:
-
Increased IoT Adoption Across Sectors Drives Demand for Scalable and Reliable Cellular M2M Connectivity Solutions.
Increased penetration of IoT devices across segments, including the automotive, health, and manufacturing industries, will enhance the increasing need for efficient, reliable, and scalable cellular M2M solutions. Thus, with these trends of increasing automation, remote monitoring, and real-time collection, the demands of advanced connectivity solutions for efficient and seamless M2M applications will be accelerating fast. The applications of cellular M2M networks are crucial for secure, high-speed, and continuous connectivity, which makes them indispensable in smart manufacturing, fleet management, and telemedicine. The large-scale adoption of IoT and the need for scalable solutions will create long-term demand for cellular M2M technologies, unlocking new opportunities across diverse sectors.
Cellular M2M Market Restraints:
-
Poor Cellular Network Coverage in Some Regions Limits the Effective Deployment and Efficiency of M2M Solutions.
In regions with poor cellular network coverage or insufficient infrastructure, the installation of M2M solutions is severely challenged. Reliable and strong networks are a prerequisite for real-time data transmission, which is very crucial for fields such as logistics, autonomous vehicles, and healthcare. In regions lacking an underdeveloped cellular network infrastructure, the effectiveness of M2M systems is hampered, leading to communication delays, loss of data, and poor efficiency levels in the running systems. As M2M applications become more dependent on continuous connectivity, poor cellular coverage in some areas may hinder the mass adoption of these applications and the innovation that comes with them. This problem can be more significant in rural or remote areas, further slowing the growth of the market in such regions.
Cellular M2M Market Opportunities:
-
The Global Deployment of 5G Technology Enables Faster, More Reliable Connectivity for Advanced M2M Applications like Smart Cities.
The global widespread deployment of 5G has been a transformational event that has brought revolution to the market of M2M, not only in speeding up the devices but also due to low latency and reliable connection. 5G enables these high-bandwidth applications such as autonomous vehicles and smart cities using industrial automation applications with up-to 20-Gigabits-per-second peak data rates along with 100+ Megabits-per-second average data rates. This technology leap facilitates real-time communication among devices and enhances the functionality of M2M solutions by allowing the continued exchange of data for fast decision-making and large-scale processing. Further deployment of 5G networks is going to provide new capabilities to industries that aim to implement smarter, more efficient systems. These will further push innovations in transportation, healthcare, and manufacturing areas. This transformative technology will dramatically speed up the spread of M2M solutions, changing global markets.
Cellular M2M Market Challenges:
-
Ensuring Data Security and Privacy for M2M Devices is Critical Amid Increasing Cyber Threats and Strict Regulatory Requirements.
As M2M devices continue to process sensitive information, its safety is a significant concern. Increased cyberattacks and breaches call for a robust implementation of security systems that would secure data transmitted across the M2M devices in the market. Further complicating matters, a stringent data privacy regulation such as GDPR requires more work to meet these standards in data security. Failure to mitigate these security and privacy issues leads to heavy losses in terms of money, court cases, and loss of a company's goodwill. As the M2M applications grow within the healthcare, automotive, and manufacturing industries, the threat of cyberattacks will increase, which is why secure communication and encryption of data becomes a necessity for organizations.
Cellular M2M Market Segment Analysis
By Function, Connectivity Services dominated in 2024 with 61% revenue share, Managed Services is expected to grow fastest with 24.16% CAGR
The Connectivity Services segment dominated the Cellular M2M Market in 2024, with the highest revenue share of about 61%, due to the critical need for reliable and scalable network connections to support a wide range of M2M applications across various industries. The Managed Services segment is expected to grow at the fastest CAGR of about 24.16% from 2024-2032, driven by the increasing demand for outsourced M2M system management, maintenance, and optimization to ensure operational efficiency and reduce costs.

By Application, Asset Tracking & Monitoring dominated in 2024 with 34% revenue share, Telemedicine is expected to grow fastest with 25.71% CAGR.
The Asset Tracking and Monitoring segment dominated the Cellular M2M Market in 2024, with the highest revenue share of about 34%, due to the growing need for real-time tracking and management of assets in industries like logistics, manufacturing, and transportation. The Telemedicine segment is expected to grow at the fastest CAGR of about 25.71% from 2024-2032, driven by the increasing demand for remote patient monitoring, healthcare automation, and advancements in telecommunication technologies that enable seamless, real-time healthcare services.
By Industry, Healthcare dominated in 2024 with 30% revenue share, Transportation & Logistics is expected to grow fastest with 23.33% CAGR.
The Healthcare segment dominated the Cellular M2M Market in 2024, with the highest revenue share of about 30%, driven by the increasing adoption of remote patient monitoring, telemedicine, and healthcare automation. These applications benefit from reliable M2M connectivity for real-time health data transmission. The Transportation and Logistics segment is expected to grow at the fastest CAGR of about 23.33% from 2024-2032, fueled by the rising demand for fleet management, asset tracking, and real-time monitoring to enhance operational efficiency and reduce costs.
Cellular M2M Market Regional Analysis
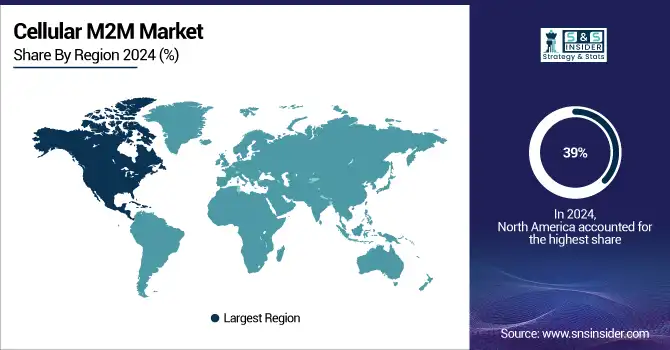
North America Cellular M2M Market Insights
In 2024, North America dominated the AI consulting services market with the highest revenue share of approximately 39%, driven by the region’s early adoption of AI technologies and a mature digital infrastructure. The presence of major tech firms, strong investments in AI R&D, and widespread integration of AI across industries such as healthcare, finance, and retail further strengthened market leadership. Additionally, supportive government policies and a skilled workforce have contributed to sustained demand for advanced AI consulting solutions.
Get Customized Report as per Your Business Requirement - Request For Customized Report
Asia Pacific Cellular M2M Market Insights
Asia Pacific is projected to grow at the fastest CAGR of around 23.15% from 2025 to 2032, fueled by rapid digital transformation across emerging economies such as China, India, and Southeast Asian nations. Increasing investments in AI startups, government-led AI initiatives, and the rising adoption of AI in manufacturing, logistics, and public services are accelerating growth. A growing pool of tech talent and expanding internet penetration also enhance the region’s capacity to adopt and scale AI consulting services.
Europe Cellular M2M Market Insights
Europe’s Cellular M2M Market is witnessing steady growth, fueled by the region’s strong digital infrastructure and widespread adoption of IoT technologies. Increasing use of connected solutions in automotive, energy, and healthcare sectors supports expansion. Moreover, regulatory support for smart city projects and sustainability initiatives further strengthens market adoption, positioning Europe as a key hub for Cellular M2M growth.
Middle East & Africa and Latin America Cellular M2M Market Insights
The Middle East & Africa and Latin America Cellular M2M Market is expanding steadily, driven by rising adoption of connected solutions in industries such as automotive, utilities, and logistics. Growing investments in telecom infrastructure and government initiatives supporting digital transformation are enhancing market opportunities. Additionally, the increasing penetration of smart devices and demand for efficient connectivity are fueling long-term market growth across these regions.
Cellular M2M Market Competitive Landscape:
Verizon Communications Inc.
Verizon Communications Inc., founded in 1983 and headquartered in New York, is one of the world’s largest telecommunications companies. It provides wireless, broadband, and enterprise solutions, serving both consumer and business markets. Verizon is recognized for its leadership in 5G technology, IoT, and digital transformation. With a strong focus on network reliability and innovation, the company continues to expand advanced connectivity and smart solutions globally.
-
In 2024, Verizon launched LTE-M and Narrowband IoT solutions to provide low-power, cost-effective connectivity for a wide range of IoT applications, boosting M2M communication. These technologies support efficient and scalable IoT networks.
Orange S.A.
Orange S.A., founded in 1994 and headquartered in Paris, France, is a global telecommunications leader offering mobile, internet, and IT services. It operates in more than 25 countries and serves millions of customers across Europe, Africa, and the Middle East. The company emphasizes innovation in 5G, IoT, cybersecurity, and cloud services while pursuing energy-efficient and sustainable digital infrastructure. Orange continues to drive digital transformation for businesses and consumers worldwide.
-
In 2024, Orange showcased open, secure, and software-centric connectivity solutions at the Mobile World Congress, focusing on the transformation of business networks and improving energy efficiency through advanced network design and management.
SK Telecom Co., Ltd.
SK Telecom Co., Ltd., founded in 1984 and headquartered in Seoul, South Korea, is a leading wireless telecommunications operator and digital innovator. It provides mobile, broadband, and AI-driven solutions while pioneering advancements in 5G and ICT services. Beyond telecom, the company is investing in AI, cloud, metaverse, and mobility to strengthen its future growth. SK Telecom remains central to Korea’s digital ecosystem and continues expanding globally through collaborations and innovation.
-
In June 2024, SK Telecom, alongside Deutsche Telekom, e&, Singtel, and SoftBank, launched a joint venture to co-develop a multilingual Large Language Model (LLM) tailored for telecommunications, aiming to enhance AI capabilities for telecom services.
Key Players
-
AT&T: (IoT Connectivity Solutions, Control Center Platform)
-
Verizon: (IoT Connectivity Services, ThingSpace Platform)
-
T-Mobile: (IoT Connectivity Plans, IoT Developer Kit)
-
Deutsche Telekom: (M2M SIM Cards, Cloud of Things Platform)
-
Orange S.A.: (IoT Connect, Live Objects Platform)
-
Telefónica: (Smart M2M Platform, Kite Platform)
-
Vodafone: (Global SIM, IoT Connectivity Platform)
-
Ericsson: (IoT Accelerator, Connected Vehicle Cloud)
-
Kore Wireless: (ConnectivityPro, Position Logic)
-
Aeris: (Aeris Fusion IoT Network, AerPort Connectivity Platform)
-
Arm Holdings: (Pelion Connectivity Management, Mbed OS)
-
China Mobile: (OneLink IoT Platform, M2M SIM Cards)
-
Infineon: (OPTIGA Trust, XMC Microcontrollers)
-
Thales Group: (Cinterion IoT Modules, Sentinel Licensing)
-
Orbcomm: (ST 6100 Satellite Terminal, IDP Series Modems)
-
Telit: (ME910G1-W1 Module, deviceWISE IoT Platform)
-
Cubic Telecom: (Global Connectivity Solution, PACE Platform)
-
KPN: (IoT Connect, LoRa Network)
-
A1 Digital: (SIMplify IoT Connectivity, IoT Platform)
-
SK Telecom: (ThingPlug IoT Platform, Smart Fleet)
-
Rogers Communications: (IoT Connectivity Management, Asset Monitoring Solutions)
-
Telenor Connexion: (Global Connectivity, Managed IoT Cloud)
-
Truphone: (IoT SIM Cards, Remote SIM Provisioning)
-
1oT: (1oT SIM Card, 1oT Terminal)
| Report Attributes | Details |
|---|---|
| Market Size in 2024 | USD 19.53 Billion |
| Market Size by 2032 | USD 90.63 Billion |
| CAGR | CAGR of 21.15% From 2025 to 2032 |
| Base Year | 2024 |
| Forecast Period | 2025-2032 |
| Historical Data | 2021-2023 |
| Report Scope & Coverage | Market Size, Segments Analysis, Competitive Landscape, Regional Analysis, DROC & SWOT Analysis, Forecast Outlook |
| Key Segments | • By Function (Connectivity Services, Professional Services, Managed Services) • By Application (Asset Tracking and Monitoring, Predictive Maintenance, Telemedicine, Fleet Management, Warehouse Management, Industrial Automation, Smart Meter) • By Industry (Healthcare, Energy and Utilities, Transportation and Logistics, Manufacturing, Others) |
| Regional Analysis/Coverage | North America (US, Canada, Mexico), Europe (Eastern Europe [Poland, Romania, Hungary, Turkey, Rest of Eastern Europe] Western Europe] Germany, France, UK, Italy, Spain, Netherlands, Switzerland, Austria, Rest of Western Europe]), Asia Pacific (China, India, Japan, South Korea, Vietnam, Singapore, Australia, Rest of Asia Pacific), Middle East & Africa (Middle East [UAE, Egypt, Saudi Arabia, Qatar, Rest of Middle East], Africa [Nigeria, South Africa, Rest of Africa], Latin America (Brazil, Argentina, Colombia, Rest of Latin America) |
| Company Profiles | AT&T, Verizon, T-Mobile, Deutsche Telekom, Orange S.A., Telefónica, Vodafone, Ericsson, Kore Wireless, Aeris, Arm Holdings, China Mobile, Infineon, Thales Group, Orbcomm, Telit, Cubic Telecom, KPN, A1 Digital, SK Telecom, Rogers Communications, Telenor Connexion, Truphone, 1oT |
