CCUS Absorption Market Report Scope & Overview:
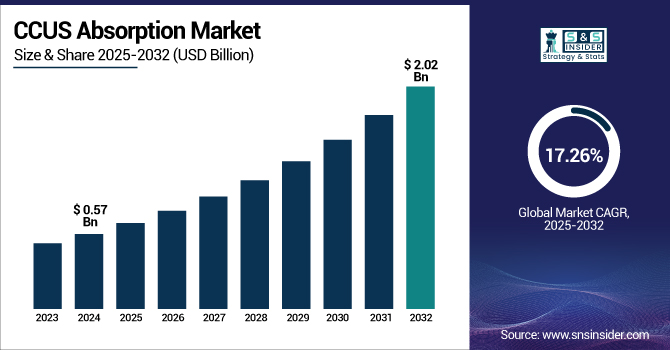
The CCUS Absorption Market size was USD 0.57 billion in 2024 and is expected to reach USD 2.02 billion by 2032 and grow at a CAGR of 17.26% over the forecast period of 2025-2032.
To Get more information on CCUS Absorption Market - Request Free Sample Report
The increasing adoption of bioenergy with carbon capture and storage (BECCS) is majorly driving the growth of the CCUS absorption market. BECCS is special in that it links positive energy production from biomass with CO₂ removal by capturing directly environmental carbon and storing it. BECCS' dual ability casts as a CCUS absorption market key technology on the road to net-zero emissions.
For instance, in February 2024, the US Department of Energy allocated USD 100 million for pilot projects on Carbon Dioxide Removal (CDR), including BECCS technologies. The U.S. similarly announced a USD 35 million prize for its "CDR purchase pilot" to stimulate deployment via federal offtake agreements.
Moreover, according to the International Energy Agency (IEA), BECCS is essential in clean energy transitions. BECCS has also become an important part of sectors that are difficult to decarbonize with traditional methods, such as heavy industry, aviation, and trucking. This innovation raises the CCUS absorption market growth.
CCUS Absorption Market Dynamics:
Drivers:
-
Integration with Hydrogen and Ammonia Production Drives the Market Growth
The combination of CCUS absorption technology with hydrogen and ammonia production represents a potential growth axis for the market. (SMR). Chemical absorption-based carbon capture systems can be integrated into these production locations, allowing operators to greatly reduce emissions and therefore generate blue hydrogen, which is a vital step in the international shift toward cleaner energy.
For instance, in 2023, Japan's revised Basic Hydrogen Strategy aims to increase the supply of hydrogen and ammonia to 3 million tons by 2030, 12 million tons by 2040, and 20 million tons by 2050. To support this, the Ministry of Economy, Trade and Industry (METI) is planning a Contract for Difference (CfD) scheme over the next 15 years, designed to bridge the cost gap between low-carbon hydrogen/ammonia and conventional fossil fuels. This scheme will provide financial stability for producers investing in CCUS absorption technologies. Moreover, this integration and expansion help to drive the CCUS absorption market share.
Restraints:
-
Limited availability of suitable storage sites may hamper the market growth.
A major issue hindering the expansion of the CCUS (Carbon Capture, Utilization and Storage) absorption market is the shortage of appropriate storage sites. Certain types of geologic formations are necessary for successfully storing carbon, including deep saline aquifers, depleted oil and gas-bearing reservoirs, or unmineable coal seams that can retain CO₂ indefinitely and without serious risk of leakage. Nevertheless, those formations are not uniformly distributed spatially, with some areas completely devoid of the subsurface architecture that would permit it. This restriction necessitates long-distance transport of the captured CO₂, further compounding LCE costs and deployment complexity.
Opportunities:
Surging Development of Carbon Transport & Storage Infrastructure Creates Opportunity Market Expansion
With an increasing need to capture significant amounts of CO₂ from widespread sectors, including power generation, cement, and chemical processing, we need to conduct transportation and storage of this captured CO₂ efficiently and at a large scale. CO₂ pipeline networks, shipping corridors, and centralized storage hubs enable broad uptake of CCUS absorption technologies by providing a means to transport captured carbon quickly, safely, and cost-effectively to storage sites. The U.S. Gulf Coast, North Sea, and Australia have already committed billions of dollars to this type of infrastructure, bringing together multiple industrial participants in an integrated carbon management system.
Moreover, CCUS absorption companies adapt to the opportunity and to the partnership to increase their presence and production facilities. For instance, in April 2025, ExxonMobil signed a CO₂ transportation and storage agreement with Calpine to transport and store up to 2 million metric tons per year of CO₂ from Calpine's natural gas power generation facility.
There have also been large investments in CCUS infrastructure by the U.S. government. CCUS absorption projects have garnered more than USD 20 billion of public funding in the U.S. and Europe in 2023, accounting for USD 1.7 billion for carbon capture demonstration projects and USD 1.2 billion for Direct Air Capture (DAC) hubs under the 2021 Infrastructure Investment and Jobs Act.
CCUS Absorption Market Segmentation Analysis:
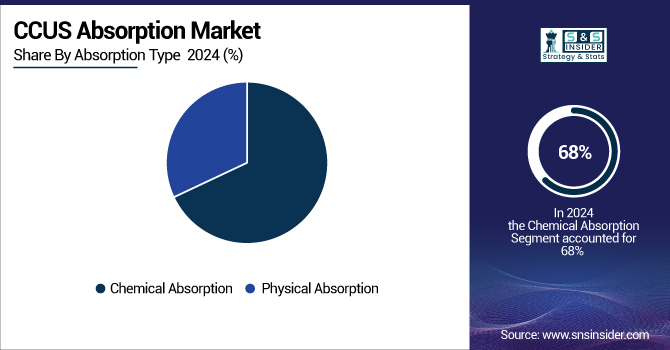
By Absorption Type
Chemical Absorption held the largest market share, around 68%, in 2024. The growth is driven by its efficiency, maturity, and the ability to capture CO₂ from a range of different emission source. The technique is mostly based on chemical solvents, particularly amine-based solutions, such as monoethanolamine (MEA), that absorb CO₂ at low temperatures, forming a compound, which is then heated to release and recover pure CO₂. This is used in industries, such as power generation, oil & gas, and cement, where enormous quantities of CO₂ must be dealt with quickly. It is also the most commercialized and technically developed among the existing absorption techniques, with decades of R&D providing a track record of successful application.
Physical absorption held a significant market share during the forecast period. It is due to its economic and energy efficiency in several high-pressure applications. It is most effective in processes where CO₂ is captured before combustion, such as natural gas processing and hydrogen production. Higher energetic needs for solvent regeneration make technologies as Selexol and Rectisol very common. Proliferation of blue hydrogen and syngas treatment plants is an added advantage for the market growth, providing opportunities for penetration into North American and Asian countries.
By End-User Industry
The oil & gas segment held the largest market share of approximately 28% in 2024. The segment’s growth is driven by the high CO₂ emissions during extraction, shivering, and processing activities. Carbon capture utilisation and storage market companies in this sector have invested heavily in CCUS absorption for EOR and to support global decarbonization targets. In blue hydrogen production, it separates CO₂ from natural gas and locks it up underground. The oil & gas sector remains the frontrunner in CCUS deployment due to significant government support and major pilot projects, especially in the U.S., Canada, and the Middle East, further propelling the carbon capture absorption.
The chemical & petrochemical segment held a significant market share. It is the largest industrial source of CO₂ emissions, coming from carbon capture solvents and various processes, such as ammonia, methanol, and ethylene production. Many of these facilities operate under high concentrations of CO₂, which is easier to capture and more economical. CCUS technologies are increasingly being adopted across the sector to comply with international emission regulations and ambitious sustainability targets.
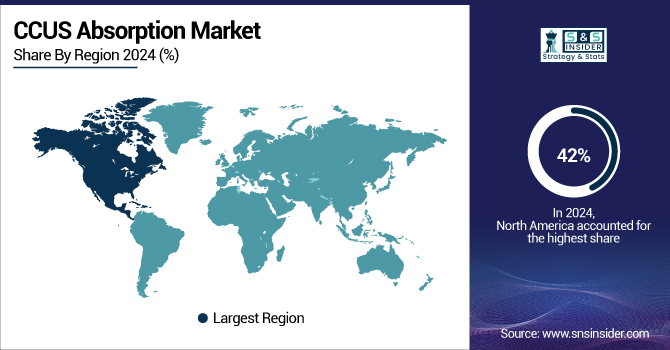
CCUS Absorption Market Regional Outlook:
North America held the largest market share of around 42% due to significant government investments coupled with supportive policies in the region. In North America, the U.S. is held the largest market share. The U.S market size was 0.17 billion in 2024 and is expected to reach USD O.59 billion by 2032 and grow at the CAGR of 16.76% over the forecast period 2025-2032.
The federal government in the U.S. has made major investments in CCUS absorption projects. Through a mixture of applied research projects, the Carbon Storage Program of the Department of Energy has helped drive the development and validation of CCUS technologies and raise the CCUS absorption market trends. Also, Canada itself has been a significant investor in CCUS. In 2020, the federal government pledged USD 2 billion to establish and fund large-scale CCUS projects nationwide. The Alberta Carbon Trunk Line is a USD 1.2 billion pipeline system funded by federal and provincial dollars to move CO₂ away from its industrial sources to places it can be kept underground. This alignment by North American governments reinforces the region's CCUS leadership and places it firmly among the world leaders in global carbon mitigation.
Europe held a significant market share and is the fastest-growing region in the market during the forecast period. The growth is driven by its ambitious climate objectives, stringent carbon emission regulations, and push for new clean energy technologies. The Green Deal of the European Union sets the ambitious goal of a climate-neutral economy by 2050, and CCUS is identified as one of the key technologies necessary to meet this objective. For instance, Norway, the U.K., and the Netherlands have put significant resources into CCUS projects, most notably the huge Longship project in Norway and the Northern Lights CO₂ transport and storage infrastructure. The EU Innovation Fund, which is one of the largest financial mechanisms in the world for the demonstration of low-carbon technologies, has also invested billions of euros in some CCUS deployments.
Asia Pacific held a significant market share and is the fastest-growing segment during the projected period. It is owing to the region with its economies rapidly gaining ground in the industrial front, larger carbon emissions, and a strong focus on sustainable energy solutions. Eyeing to combat the high CO2 emissions and meet the regulations imposed by authorities, industrialized nations, including China, Japan, and India, are the main sources of demand for CCUS technologies being applied over the region. Being the largest emitter, China has also put in a lot of investment in CCUS projects to reach peak carbon emissions before 2030 and carbon neutrality by 2060. Japan's government also recently set ambitious targets for CCUS, fitting for a nation so committed to carbon reduction.
Get Customized Report as per Your Business Requirement - Enquiry Now
Key Players:
The leading players in the CCUS absorption market are Aker Solutions, Fluor Corporation, Mitsubishi Heavy Industries, Shell CANSOLV, Linde plc, Honeywell UOP, ExxonMobil, Carbon Clean, Schlumberger (SLB), and BASF SE. These CCUS Absorptions companies provided CCUS absorption market trends, CCUS absorption market analysis.
Recent Developments:
-
In June 2024, Shell Canada supported the Polaris carbon capture project at the Shell Energy and Chemicals Park in Canada, which will capture around 650,000 tonnes of CO₂ per year from the Shell Scotford refinery and chemicals complex, reducing carbon emissions to the atmosphere.
-
In September 2023, Cleanova launched its Cleanova C-CLEAN suite of filtration technology to improve the carbon capture, utilization, and storage (CCUS) value chain 23. The suite encompasses high-capacity filters, coalescers, activated carbon filters, and oil mist eliminators, all of which are designed for various conditions, including CO₂ concentrations, emission sources, and contaminants.
| Report Attributes | Details |
|---|---|
| Market Size in 2024 | USD 0.57 Billion |
| Market Size by 2032 | USD 2.02 Billion |
| CAGR | CAGR of 17.26% From 2025 to 2032 |
| Base Year | 2024 |
| Forecast Period | 2025-2032 |
| Historical Data | 2021-2023 |
| Report Scope & Coverage | Market Size, Segments Analysis, Competitive Landscape, Regional Analysis, DROC & SWOT Analysis, Forecast Outlook |
| Key Segments | • By Absorption Type (Chemical Absorption, Physical Absorption) • By End User Industry (Oil & Gas, Power Generation, Chemical & Petrochemical, Cement, Iron & Steel) |
| Regional Analysis/Coverage | North America (US, Canada, Mexico), Europe (Germany, France, UK, Italy, Spain, Poland, Turkey, Rest of Europe), Asia Pacific (China, India, Japan, South Korea, Singapore, Australia, Rest of Asia Pacific), Middle East & Africa (UAE, Saudi Arabia, Qatar, South Africa, Rest of Middle East & Africa), Latin America (Brazil, Argentina, Rest of Latin America) |
| Company Profiles | Solvay S.A., Evonik Industries AG, Ecolab Inc., Mitsubishi Gas Chemical Company, Inc., Kemira Oyj, Enviro Tech Chemical Services, Inc., SEITZ GmbH, Aditya Birla Chemicals, Christeyns, National Peroxide Limited |
