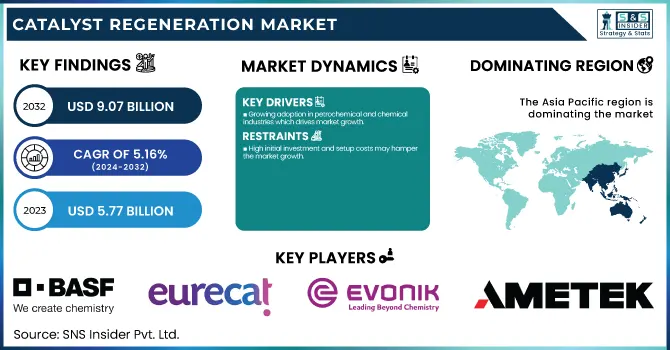
The Catalyst Regeneration Market size was USD 5.77 Billion in 2023 and is expected to reach USD 9.07 Billion by 2032 and grow at a CAGR of 5.16 % over the forecast period of 2024-2032. This report provides comprehensive statistical insights and trends in the catalyst regeneration market, covering key aspects such as production capacity and utilization rates by country and type, along with feedstock and regeneration costs across major regions. It examines the regulatory impact and environmental compliance, highlighting sustainability initiatives and waste reduction efforts. The report also explores innovation and R&D investments, focusing on advancements in regeneration technologies. Additionally, it analyzes market adoption trends by industry and region, providing a clear picture of demand across the refining, petrochemical, and chemical sectors. These insights help stakeholders understand market dynamics, cost structures, and growth opportunities in catalyst regeneration.
To Get more information on Catalyst Regeneration Market - Request Free Sample Report
Drivers
Growing adoption in petrochemical and chemical industries which drives market growth.
Catalyst regeneration has become a common practice in the petrochemical and chemical industries, where the process relies heavily on catalyst efficiency, thereby driving market growth. The growing need for specialty chemicals, polymers, and refined products is forcing industries to look for effective replacement solutions for their downstream units, while keeping their catalyst performance intact without incurring high replacement costs. Catalysts that can be regenerated are a sustainable solution because they prolong the life of the catalyst, reduce waste, and lower operating costs. Moreover, stringent environmental regulations on waste disposal and emissions are also pushing chemical producers to adopt regeneration activities.
Restraint
High initial investment and setup costs may hamper the market growth.
The high capital & operational expenditures and installation costs represent one of the major restraints for catalyst regeneration market growth, owing to catalyst regeneration facilities requiring new infrastructure, refrigeration, and specialized personnel, as well as extensive capital & operational expenditures. There are also financial burdens for companies that need to invest in processing units, emission control devices, and quality testing systems to meet industry standards, particularly for Small and Medium-Sized Enterprises (SMEs). Compliance with regulations also adds to the costs, since environmental and safety standards are often stringent, necessitating a lot of monitoring and upgrades. Such capital expenditure makes it difficult for new players to enter the market and even slows the expansion of current market players restricting the overall growth of the market.
Opportunity
Technological advancements in regeneration techniques create an opportunity in the market.
Regeneration techniques are being modernized through technology, and they are becoming the backbone of the catalyst regeneration market by providing efficient, economical turnaround, and a wider range of catalyst types that can be regenerated. Innovations in thermal, chemical, and wet regeneration processes are increasing catalyst contact times, leading to improved activity and selectivity retention of the regenerated catalysts. Moreover, the adoption of artificial intelligence (AI) and automation in regeneration plants are improving process control, and lowering energy consumption and waste. The growing ability to regenerate even high-performance catalysts used in the petrochemical, refining, and chemical industries also fosters the market adoption of advanced regeneration techniques. It is driven by sustainability and cost reduction trends in many industries, these technological advances not only reinforce the environmentally friendly and economically attractive nature of catalyst regeneration but also enhance its sustainability profile relative to fresh catalyst replacement.
Challenges
Technological barriers in purification and refining may create a challenge for the market.
Technological barriers can be a major challenge to the Catalyst Regeneration market especially in industries that require high-purity grades for application in pharmaceuticals, specialty chemicals, and high-performance polymers. Common purification techniques are distillation and crystallization; however, they tend to be ineffective at achieving the ultra-high purities required for higher-end applications. Impurities like sulfur compounds and other polycyclic aromatic hydrocarbons (PAHs) are present in the product, affecting product quality and its use in stringent industries. Furthermore, implementing new refining technologies requires very high capital investments against which small and mid-sized manufacturers cannot compete. Stringent quality standards imposed by regulatory authorities require firms to develop advanced purification technologies, leading to higher operating costs and increasing entry barriers for new players entering this market.
By Type
The off-site regeneration segment held the largest market share around 68% in 2023. It has the ability to provide high-quality regeneration with advanced processing techniques for optimal catalyst performance. The facility located away from manufacturers is outfitted with sophisticated technology, high-level quality control, and specific tools, that improve the durability and performance of recycled catalysts. Industries such as oil refining, petrochemicals, and chemicals, where the catalyst is key to smooth operation, prefer this method. It also does not require any investments in on-site infrastructure as the rare elements are separated in a dedicated facility thus offering companies a competitive advantage in the design of their catalysts towards longer life regimes without on-site compromises in quality. The off-site regeneration segment is projected to further dominate the market due to advantages such as high-scale regeneration capacity, low downtime, & meeting harsh environmental regulations.
By Application
Refineries held the largest market share around 42% in 2023. The catalysts are extensively used in the refining processes including fluid catalytic cracking (FCC), hydrocracking, and hydrotreating. Refineries need continuous catalyst regeneration to achieve processing efficiency, lower operational cost, and comply with stricter economic regulations focused on decreasing emissions and waste generation. The growing global demand for clean fuels and low-sulfur petroleum products has led refiners to use regenerated catalysts to maximize process efficiency and sustainability. As the implementation of circular economy practices worldwide increases, as well as the need to reduce fresh catalyst production, refineries have sought to achieve high performance while saving costs by expanding the use of off-site catalyst regeneration services.
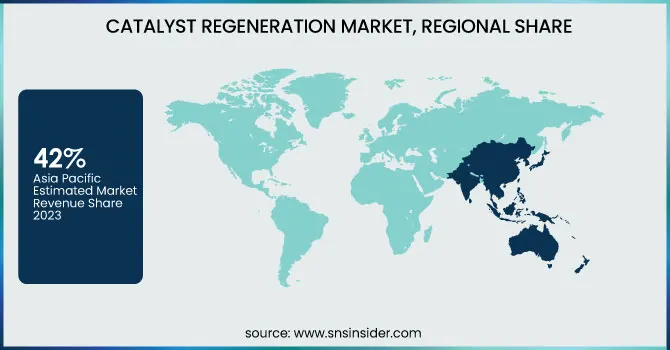
Asia Pacific held the largest market share around 42% in 2023. It is owing to the swift development of refining, petrochemical, and chemical industries in this region. The industrial growth in China, India, Japan, and South Korea is likely to contribute to the growth of the market where the market offers countries in the region an increased need to use restored drivers to become more efficient and cost-effective. Stringent emission and waste disposal regulations in the region have further propelled the concept of catalyst regeneration as a sustainable alternative to newly manufactured catalysts. Moreover, the increase in demand for energy, the expansion of refineries on a large scale, and investments in petrochemicals also drive market growth. Asia Pacific is again the market leader due to the presence of the leading catalyst regeneration service provider and the development of regeneration technology. In addition, its cost-effective regeneration services coupled with the availability of skilled manpower and advanced infrastructure act as a hub of catalyst regeneration services.
North America held a significant market share in 2023. It is a highly developed refining, petrochemical, and chemical industry in the region, specifically in the U.S. and Canada. Over the coming years, the demand for regenerated catalysts is expected to rise with a growing emphasis on lowering operational costs, improving sustainability, and complying with stringent environmental regulations in various industries. The market growth is further supported by the presence of various leading refinery operators and petrochemical companies, along with several advanced R&D initiatives related to catalyst regeneration technologies. Finally, government regulation from such agencies as the U.S. Environmental Protection Agency (EPA) and the Canadian Environmental Protection Act (CEPA) has been urging industries to practice some form of regeneration for waste and emission control. Despite continued development in refinery upgrades investments in clean energy projects and the growth of principles walks on the circular economy, North America has remained the leading player in the catalyst regeneration market.
Get Customized Report as per Your Business Requirement - Enquiry Now
Key Players
Eurecat (RAISE Hydrogenation Catalyst Regeneration, Catalyst Pretreatment Services)
CORMETECH (SCR Catalyst Regeneration, Catalyst Management Services)
BASF SE (FCC Catalyst Regeneration, Environmental Catalyst Services)
Zibo Hengji Chemical Co., Ltd. (Hydroprocessing Catalyst Regeneration, Petrochemical Catalyst Services)
Evonik Industries AG (Porocel) (actiCAT Presulfurization Treatment, Activated Alumina Regeneration)
Advanced Catalyst Systems LLC (Catalyst Rejuvenation Services, Custom Catalyst Solutions)
Al Bilad Catalyst Company (Catalyst Recycling Services, Hydrocracking Catalyst Regeneration)
AMETEK, Inc. (Catalyst Regeneration Systems, Process Instrumentation for Catalysts)
Axens (Catalyst Regeneration Solutions, Process Licensing Services)
EBINGER Katalysatorservice GmbH & Co. KG (Industrial Catalyst Regeneration, Catalyst Handling Services)
NIPPON KETJEN Co., Ltd. (Hydroprocessing Catalyst Services, Catalyst Performance Optimization)
Yokogawa Corporation of America (Catalyst Performance Monitoring, Process Automation Solutions)
Johnson Matthey (Hydroprocessing Catalyst Regeneration, Emission Control Catalyst Services)
Haldor Topsoe (AR-401 Activated Nickel Catalyst, Catalyst Management Services)
Honeywell UOP (CCR Platforming Catalyst Regeneration, Catalyst Support Services)
GlobeCore (Oil Regeneration Units, Transformer Maintenance Equipment)
Albemarle Corporation (FCC Catalyst Regeneration, Hydroprocessing Catalyst Services)
Porocel (actiCAT Presulfurization Treatment, Activated Alumina Regeneration)
Axens (Octanizing Catalyst Regeneration, Process Licensing Services)
Engelhard Corporation (BASF) (Magnaforming Catalyst Regeneration, Environmental Catalyst Services)
Recent Development:
In March 2024, Evonik introduced Octamax, an advanced sustainable catalyst solution designed to enhance sulfur removal efficiency while preserving octane levels. This cost-effective innovation applies proven hydroprocessing catalyst reuse technology to cracked gasoline hydrodesulfurization units, providing a more sustainable alternative to conventional fresh catalysts.
In November 2024, Clariant launched its Plus series syngas catalysts, featuring ReforMax LDP Plus, ShiftMax 217 Plus, and AmoMax 10 Plus. These advanced catalysts are engineered to improve plant efficiency and lower carbon emissions, playing a crucial role in the production of blue hydrogen and green ammonia.
| Report Attributes | Details |
| Market Size in 2023 | USD 5.77 Billion |
| Market Size by 2032 | USD 9.07 Billion |
| CAGR | CAGR of 5.16% From 2024 to 2032 |
| Base Year | 2023 |
| Forecast Period | 2024-2032 |
| Historical Data | 2020-2022 |
| Report Scope & Coverage | Market Size, Segments Analysis, Competitive Landscape, Regional Analysis, DROC & SWOT Analysis, Forecast Outlook |
| Key Segments | •By Source (Coal Tar, Petroleum) •By Application (Phthalic Anhydride, Catalyst Regeneration Sulfonates, Low-Volatility Solvents, Moth Repellent, Pesticides, Others) |
| Regional Analysis/Coverage | North America (US, Canada, Mexico), Europe (Eastern Europe [Poland, Romania, Hungary, Turkey, Rest of Eastern Europe] Western Europe] Germany, France, UK, Italy, Spain, Netherlands, Switzerland, Austria, Rest of Western Europe]), Asia Pacific (China, India, Japan, South Korea, Vietnam, Singapore, Australia, Rest of Asia Pacific), Middle East & Africa (Middle East [UAE, Egypt, Saudi Arabia, Qatar, Rest of Middle East], Africa [Nigeria, South Africa, Rest of Africa], Latin America (Brazil, Argentina, Colombia, Rest of Latin America) |
| Company Profiles | Eurecat, CORMETECH, BASF SE, Zibo Hengji Chemical Co., Ltd., Evonik Industries AG (Porocel), Advanced Catalyst Systems LLC, Al Bilad Catalyst Company, AMETEK, Inc., Axens, EBINGER Katalysatorservice GmbH & Co. KG, NIPPON KETJEN Co., Ltd., Yokogawa Corporation of America, Johnson Matthey, Haldor Topsoe, Honeywell UOP, GlobeCore, Albemarle Corporation, Porocel, Engelhard Corporation (BASF) |
Ans: The Catalyst Regeneration Market was valued at USD 5.77 Billion in 2023.
Ans: The expected CAGR of the global Catalyst Regeneration Market during the forecast period is 5.16%
Ans: The Off-site regeneration will grow rapidly in the Catalyst Regeneration Market from 2024-2032.
Ans: Growing adoption in petrochemical and chemical industries which drives market growth.
Ans: Asia Pacific led the Catalyst Regeneration Market in the region with the highest revenue share in 2023.
Table of Contents:
1. Introduction
1.1 Market Definition
1.2 Scope (Inclusion and Exclusions)
1.3 Research Assumptions
2. Executive Summary
2.1 Market Overview
2.2 Regional Synopsis
2.3 Competitive Summary
3. Research Methodology
3.1 Top-Down Approach
3.2 Bottom-up Approach
3.3. Data Validation
3.4 Primary Interviews
4. Market Dynamics Impact Analysis
4.1 Market Driving Factors Analysis
4.1.2 Drivers
4.1.2 Restraints
4.1.3 Opportunities
4.1.4 Challenges
4.2 PESTLE Analysis
4.3 Porter’s Five Forces Model
5. Statistical Insights and Trends Reporting
5.1 Production Capacity and Utilization, by Country, By Type, 2023
5.2 Feedstock Prices, by Country, By Type, 2023
5.3 Regulatory Impact, by Country, By Type 2023.
5.4 Environmental Metrics: Emissions Data, Waste Management Practices, and Sustainability Initiatives, by Region
5.5 Innovation and R&D, Type, 2023
6. Competitive Landscape
6.1 List of Major Companies, By Region
6.2 Market Share Analysis, By Region
6.3 Product Benchmarking
6.3.1 Product specifications and features
6.3.2 Pricing
6.4 Strategic Initiatives
6.4.1 Marketing and promotional activities
6.4.2 Distribution and Supply Chain Strategies
6.4.3 Expansion Plans and New Product Launches
6.4.4 Strategic partnerships and collaborations
6.5 Technological Advancements
6.6 Market Positioning and Branding
7. Catalyst Regeneration Market Segmentation, By Type
7.1 Chapter Overview
7.2 Off-site regeneration
7.2.1 Off-site Regeneration Trends Analysis (2020-2032)
7.2.2 Off-site Regeneration Market Size Estimates and Forecasts to 2032 (USD Billion)
7.3 On-site regeneration
7.3.1 On-site Regeneration Market Trends Analysis (2020-2032)
7.3.2 On-site Regeneration Market Size Estimates and Forecasts to 2032 (USD Billion)
8. Catalyst Regeneration Market Segmentation, by Application
8.1 Chapter Overview
8.2 Refineries
8.2.1 Refineries Market Trends Analysis (2020-2032)
8.2.2 Refineries Market Size Estimates and Forecasts to 2032 (USD Billion)
8.3 Chemicals and Petrochemicals
8.3.1 Chemicals and Petrochemicals Market Trends Analysis (2020-2032)
8.3.2 Chemicals and Petrochemicals Market Size Estimates and Forecasts to 2032 (USD Billion)
8.4 Others
8.4.1 Others Market Trends Analysis (2020-2032)
8.4.2 Others Market Size Estimates and Forecasts to 2032 (USD Billion)
9. Regional Analysis
9.1 Chapter Overview
9.2 North America
9.2.1 Trends Analysis
9.2.2 North America Catalyst Regeneration Market Estimates and Forecasts, by Country (2020-2032) (USD Billion)
9.2.3 North America Catalyst Regeneration Market Estimates and Forecasts, By Type (2020-2032) (USD Billion)
9.2.4 North America Catalyst Regeneration Market Estimates and Forecasts, by Application (2020-2032) (USD Billion)
9.2.5 USA
9.2.5.1 USA Catalyst Regeneration Market Estimates and Forecasts, By Type (2020-2032) (USD Billion)
9.2.5.2 USA Catalyst Regeneration Market Estimates and Forecasts, by Application (2020-2032) (USD Billion)
9.2.6 Canada
9.2.6.1 Canada Catalyst Regeneration Market Estimates and Forecasts, By Type (2020-2032) (USD Billion)
9.2.6.2 Canada Catalyst Regeneration Market Estimates and Forecasts, by Application (2020-2032) (USD Billion)
9.2.7 Mexico
9.2.7.1 Mexico Catalyst Regeneration Market Estimates and Forecasts, By Type (2020-2032) (USD Billion)
9.2.7.2 Mexico Catalyst Regeneration Market Estimates and Forecasts, by Application (2020-2032) (USD Billion)
9.3 Europe
9.3.1 Eastern Europe
9.3.1.1 Trends Analysis
9.3.1.2 Eastern Europe Catalyst Regeneration Market Estimates and Forecasts, by Country (2020-2032) (USD Billion)
9.3.1.3 Eastern Europe Catalyst Regeneration Market Estimates and Forecasts, By Type (2020-2032) (USD Billion)
9.3.1.4 Eastern Europe Catalyst Regeneration Market Estimates and Forecasts, by Application (2020-2032) (USD Billion)
9.3.1.5 Poland
9.3.1.5.1 Poland Catalyst Regeneration Market Estimates and Forecasts, By Type (2020-2032) (USD Billion)
9.3.1.5.2 Poland Catalyst Regeneration Market Estimates and Forecasts, by Application (2020-2032) (USD Billion)
9.3.1.6 Romania
9.3.1.6.1 Romania Catalyst Regeneration Market Estimates and Forecasts, By Type (2020-2032) (USD Billion)
9.3.1.6.2 Romania Catalyst Regeneration Market Estimates and Forecasts, by Application (2020-2032) (USD Billion)
9.3.1.7 Hungary
9.3.1.7.1 Hungary Catalyst Regeneration Market Estimates and Forecasts, By Type (2020-2032) (USD Billion)
9.3.1.7.2 Hungary Catalyst Regeneration Market Estimates and Forecasts, by Application (2020-2032) (USD Billion)
9.3.1.8 Turkey
9.3.1.8.1 Turkey Catalyst Regeneration Market Estimates and Forecasts, By Type (2020-2032) (USD Billion)
9.3.1.8.2 Turkey Catalyst Regeneration Market Estimates and Forecasts, by Application (2020-2032) (USD Billion)
9.3.1.9 Rest of Eastern Europe
9.3.1.9.1 Rest of Eastern Europe Catalyst Regeneration Market Estimates and Forecasts, By Type (2020-2032) (USD Billion)
9.3.1.9.2 Rest of Eastern Europe Catalyst Regeneration Market Estimates and Forecasts, by Application (2020-2032) (USD Billion)
9.3.2 Western Europe
9.3.2.1 Trends Analysis
9.3.2.2 Western Europe Catalyst Regeneration Market Estimates and Forecasts, by Country (2020-2032) (USD Billion)
9.3.2.3 Western Europe Catalyst Regeneration Market Estimates and Forecasts, By Type (2020-2032) (USD Billion)
9.3.2.4 Western Europe Catalyst Regeneration Market Estimates and Forecasts, by Application (2020-2032) (USD Billion)
9.3.2.5 Germany
9.3.2.5.1 Germany Catalyst Regeneration Market Estimates and Forecasts, By Type (2020-2032) (USD Billion)
9.3.2.5.2 Germany Catalyst Regeneration Market Estimates and Forecasts, by Application (2020-2032) (USD Billion)
9.3.2.6 France
9.3.2.6.1 France Catalyst Regeneration Market Estimates and Forecasts, By Type (2020-2032) (USD Billion)
9.3.2.6.2 France Catalyst Regeneration Market Estimates and Forecasts, by Application (2020-2032) (USD Billion)
9.3.2.7 UK
9.3.2.7.1 UK Catalyst Regeneration Market Estimates and Forecasts, By Type (2020-2032) (USD Billion)
9.3.2.7.2 UK Catalyst Regeneration Market Estimates and Forecasts, by Application (2020-2032) (USD Billion)
9.3.2.8 Italy
9.3.2.8.1 Italy Catalyst Regeneration Market Estimates and Forecasts, By Type (2020-2032) (USD Billion)
9.3.2.8.2 Italy Catalyst Regeneration Market Estimates and Forecasts, by Application (2020-2032) (USD Billion)
9.3.2.9 Spain
9.3.2.9.1 Spain Catalyst Regeneration Market Estimates and Forecasts, By Type (2020-2032) (USD Billion)
9.3.2.9.2 Spain Catalyst Regeneration Market Estimates and Forecasts, by Application (2020-2032) (USD Billion)
9.3.2.10 Netherlands
9.3.2.10.1 Netherlands Catalyst Regeneration Market Estimates and Forecasts, By Type (2020-2032) (USD Billion)
9.3.2.10.2 Netherlands Catalyst Regeneration Market Estimates and Forecasts, by Application (2020-2032) (USD Billion)
9.3.2.11 Switzerland
9.3.2.11.1 Switzerland Catalyst Regeneration Market Estimates and Forecasts, By Type (2020-2032) (USD Billion)
9.3.2.11.2 Switzerland Catalyst Regeneration Market Estimates and Forecasts, by Application (2020-2032) (USD Billion)
9.3.2.12 Austria
9.3.2.12.1 Austria Catalyst Regeneration Market Estimates and Forecasts, By Type (2020-2032) (USD Billion)
9.3.2.12.2 Austria Catalyst Regeneration Market Estimates and Forecasts, by Application (2020-2032) (USD Billion)
9.3.2.13 Rest of Western Europe
9.3.2.13.1 Rest of Western Europe Catalyst Regeneration Market Estimates and Forecasts, By Type (2020-2032) (USD Billion)
9.3.2.13.2 Rest of Western Europe Catalyst Regeneration Market Estimates and Forecasts, by Application (2020-2032) (USD Billion)
9.4 Asia Pacific
9.4.1 Trends Analysis
9.4.2 Asia Pacific Catalyst Regeneration Market Estimates and Forecasts, by Country (2020-2032) (USD Billion)
9.4.3 Asia Pacific Catalyst Regeneration Market Estimates and Forecasts, By Type (2020-2032) (USD Billion)
9.4.4 Asia Pacific Catalyst Regeneration Market Estimates and Forecasts, by Application (2020-2032) (USD Billion)
9.4.5 China
9.4.5.1 China Catalyst Regeneration Market Estimates and Forecasts, By Type (2020-2032) (USD Billion)
9.4.5.2 China Catalyst Regeneration Market Estimates and Forecasts, by Application (2020-2032) (USD Billion)
9.4.6 India
9.4.5.1 India Catalyst Regeneration Market Estimates and Forecasts, By Type (2020-2032) (USD Billion)
9.4.5.2 India Catalyst Regeneration Market Estimates and Forecasts, by Application (2020-2032) (USD Billion)
9.4.5 Japan
9.4.5.1 Japan Catalyst Regeneration Market Estimates and Forecasts, By Type (2020-2032) (USD Billion)
9.4.5.2 Japan Catalyst Regeneration Market Estimates and Forecasts, by Application (2020-2032) (USD Billion)
9.4.6 South Korea
9.4.6.1 South Korea Catalyst Regeneration Market Estimates and Forecasts, By Type (2020-2032) (USD Billion)
9.4.6.2 South Korea Catalyst Regeneration Market Estimates and Forecasts, by Application (2020-2032) (USD Billion)
9.4.7 Vietnam
9.4.7.1 Vietnam Catalyst Regeneration Market Estimates and Forecasts, By Type (2020-2032) (USD Billion)
9.2.7.2 Vietnam Catalyst Regeneration Market Estimates and Forecasts, by Application (2020-2032) (USD Billion)
9.4.8 Singapore
9.4.8.1 Singapore Catalyst Regeneration Market Estimates and Forecasts, By Type (2020-2032) (USD Billion)
9.4.8.2 Singapore Catalyst Regeneration Market Estimates and Forecasts, by Application (2020-2032) (USD Billion)
9.4.9 Australia
9.4.9.1 Australia Catalyst Regeneration Market Estimates and Forecasts, By Type (2020-2032) (USD Billion)
9.4.9.2 Australia Catalyst Regeneration Market Estimates and Forecasts, by Application (2020-2032) (USD Billion)
9.4.10 Rest of Asia Pacific
9.4.10.1 Rest of Asia Pacific Catalyst Regeneration Market Estimates and Forecasts, By Type (2020-2032) (USD Billion)
9.4.10.2 Rest of Asia Pacific Catalyst Regeneration Market Estimates and Forecasts, by Application (2020-2032) (USD Billion)
9.5 Middle East and Africa
9.5.1 Middle East
9.5.1.1 Trends Analysis
9.5.1.2 Middle East Catalyst Regeneration Market Estimates and Forecasts, by Country (2020-2032) (USD Billion)
9.5.1.3 Middle East Catalyst Regeneration Market Estimates and Forecasts, By Type (2020-2032) (USD Billion)
9.5.1.4 Middle East Catalyst Regeneration Market Estimates and Forecasts, by Application (2020-2032) (USD Billion)
9.5.1.5 UAE
9.5.1.5.1 UAE Catalyst Regeneration Market Estimates and Forecasts, By Type (2020-2032) (USD Billion)
9.5.1.5.2 UAE Catalyst Regeneration Market Estimates and Forecasts, by Application (2020-2032) (USD Billion)
9.5.1.6 Egypt
9.5.1.6.1 Egypt Catalyst Regeneration Market Estimates and Forecasts, By Type (2020-2032) (USD Billion)
9.5.1.6.2 Egypt Catalyst Regeneration Market Estimates and Forecasts, by Application (2020-2032) (USD Billion)
9.5.1.7 Saudi Arabia
9.5.1.7.1 Saudi Arabia Catalyst Regeneration Market Estimates and Forecasts, By Type (2020-2032) (USD Billion)
9.5.1.7.2 Saudi Arabia Catalyst Regeneration Market Estimates and Forecasts, by Application (2020-2032) (USD Billion)
9.5.1.8 Qatar
9.5.1.8.1 Qatar Catalyst Regeneration Market Estimates and Forecasts, By Type (2020-2032) (USD Billion)
9.5.1.8.2 Qatar Catalyst Regeneration Market Estimates and Forecasts, by Application (2020-2032) (USD Billion)
9.5.1.9 Rest of Middle East
9.5.1.9.1 Rest of Middle East Catalyst Regeneration Market Estimates and Forecasts, By Type (2020-2032) (USD Billion)
9.5.1.9.2 Rest of Middle East Catalyst Regeneration Market Estimates and Forecasts, by Application (2020-2032) (USD Billion)
9.5.2 Africa
9.5.2.1 Trends Analysis
9.5.2.2 Africa Catalyst Regeneration Market Estimates and Forecasts, by Country (2020-2032) (USD Billion)
9.5.2.3 Africa Catalyst Regeneration Market Estimates and Forecasts, By Type (2020-2032) (USD Billion)
9.5.2.4 Africa Catalyst Regeneration Market Estimates and Forecasts, by Application (2020-2032) (USD Billion)
9.5.2.5 South Africa
9.5.2.5.1 South Africa Catalyst Regeneration Market Estimates and Forecasts, By Type (2020-2032) (USD Billion)
9.5.2.5.2 South Africa Catalyst Regeneration Market Estimates and Forecasts, by Application (2020-2032) (USD Billion)
9.5.2.6 Nigeria
9.5.2.6.1 Nigeria Catalyst Regeneration Market Estimates and Forecasts, By Type (2020-2032) (USD Billion)
9.5.2.6.2 Nigeria Catalyst Regeneration Market Estimates and Forecasts, by Application (2020-2032) (USD Billion)
9.6 Latin America
9.6.1 Trends Analysis
9.6.2 Latin America Catalyst Regeneration Market Estimates and Forecasts, by Country (2020-2032) (USD Billion)
9.6.3 Latin America Catalyst Regeneration Market Estimates and Forecasts, By Type (2020-2032) (USD Billion)
9.6.4 Latin America Catalyst Regeneration Market Estimates and Forecasts, by Application (2020-2032) (USD Billion)
9.6.5 Brazil
9.6.5.1 Brazil Catalyst Regeneration Market Estimates and Forecasts, By Type (2020-2032) (USD Billion)
9.6.5.2 Brazil Catalyst Regeneration Market Estimates and Forecasts, by Application (2020-2032) (USD Billion)
9.6.6 Argentina
9.6.6.1 Argentina Catalyst Regeneration Market Estimates and Forecasts, By Type (2020-2032) (USD Billion)
9.6.6.2 Argentina Catalyst Regeneration Market Estimates and Forecasts, by Application (2020-2032) (USD Billion)
9.6.7 Colombia
9.6.7.1 Colombia Catalyst Regeneration Market Estimates and Forecasts, By Type (2020-2032) (USD Billion)
9.6.7.2 Colombia Catalyst Regeneration Market Estimates and Forecasts, by Application (2020-2032) (USD Billion)
9.6.8 Rest of Latin America
9.6.8.1 Rest of Latin America Catalyst Regeneration Market Estimates and Forecasts, By Type (2020-2032) (USD Billion)
9.6.8.2 Rest of Latin America Catalyst Regeneration Market Estimates and Forecasts, by Application (2020-2032) (USD Billion)
10. Company Profiles
10.1 Eurecat
10.1.1 Company Overview
10.1.2 Financial
10.1.3 Product / Services Offered
10.1.4 SWOT Analysis
10.2 CORMETECH
10.2.1 Company Overview
10.2.2 Financial
10.2.3 Product/ Services Offered
10.2.4 SWOT Analysis
10.3 BASF SE
10.3.1 Company Overview
10.3.2 Financial
10.3.3 Product/ Services Offered
10.3.4 SWOT Analysis
10.4 Zibo Hengji Chemical Co., Ltd.
10.4.1 Company Overview
10.4.2 Financial
10.4.3 Product/ Services Offered
10.4.4 SWOT Analysis
10.5 Evonik Industries AG
10.5.1 Company Overview
10.5.2 Financial
10.5.3 Product/ Services Offered
10.5.4 SWOT Analysis
10.6 Advanced Catalyst Systems LLC
10.6.1 Company Overview
10.6.2 Financial
10.6.3 Product/ Services Offered
10.6.4 SWOT Analysis
10.7 Al Bilad Catalyst Company
10.7.1 Company Overview
10.7.2 Financial
10.7.3 Product/ Services Offered
10.7.4 SWOT Analysis
10.8 AMETEK, Inc.
10.8.1 Company Overview
10.8.2 Financial
10.8.3 Product/ Services Offered
10.8.4 SWOT Analysis
10.9 Axens
10.9.1 Company Overview
10.9.2 Financial
10.9.3 Product/ Services Offered
10.9.4 SWOT Analysis
10.10 Nippon Ketjen Co., Ltd.
10.10.1 Company Overview
10.10.2 Financial
10.10.3 Product/ Services Offered
10.10.4 SWOT Analysis
11. Use Cases and Best Practices
12. Conclusion
An accurate research report requires proper strategizing as well as implementation. There are multiple factors involved in the completion of good and accurate research report and selecting the best methodology to compete the research is the toughest part. Since the research reports we provide play a crucial role in any company’s decision-making process, therefore we at SNS Insider always believe that we should choose the best method which gives us results closer to reality. This allows us to reach at a stage wherein we can provide our clients best and accurate investment to output ratio.
Each report that we prepare takes a timeframe of 350-400 business hours for production. Starting from the selection of titles through a couple of in-depth brain storming session to the final QC process before uploading our titles on our website we dedicate around 350 working hours. The titles are selected based on their current market cap and the foreseen CAGR and growth.
The 5 steps process:
Step 1: Secondary Research:
Secondary Research or Desk Research is as the name suggests is a research process wherein, we collect data through the readily available information. In this process we use various paid and unpaid databases which our team has access to and gather data through the same. This includes examining of listed companies’ annual reports, Journals, SEC filling etc. Apart from this our team has access to various associations across the globe across different industries. Lastly, we have exchange relationships with various university as well as individual libraries.

Step 2: Primary Research
When we talk about primary research, it is a type of study in which the researchers collect relevant data samples directly, rather than relying on previously collected data. This type of research is focused on gaining content specific facts that can be sued to solve specific problems. Since the collected data is fresh and first hand therefore it makes the study more accurate and genuine.
We at SNS Insider have divided Primary Research into 2 parts.
Part 1 wherein we interview the KOLs of major players as well as the upcoming ones across various geographic regions. This allows us to have their view over the market scenario and acts as an important tool to come closer to the accurate market numbers. As many as 45 paid and unpaid primary interviews are taken from both the demand and supply side of the industry to make sure we land at an accurate judgement and analysis of the market.
This step involves the triangulation of data wherein our team analyses the interview transcripts, online survey responses and observation of on filed participants. The below mentioned chart should give a better understanding of the part 1 of the primary interview.

Part 2: In this part of primary research the data collected via secondary research and the part 1 of the primary research is validated with the interviews from individual consultants and subject matter experts.
Consultants are those set of people who have at least 12 years of experience and expertise within the industry whereas Subject Matter Experts are those with at least 15 years of experience behind their back within the same space. The data with the help of two main processes i.e., FGDs (Focused Group Discussions) and IDs (Individual Discussions). This gives us a 3rd party nonbiased primary view of the market scenario making it a more dependable one while collation of the data pointers.
Step 3: Data Bank Validation
Once all the information is collected via primary and secondary sources, we run that information for data validation. At our intelligence centre our research heads track a lot of information related to the market which includes the quarterly reports, the daily stock prices, and other relevant information. Our data bank server gets updated every fortnight and that is how the information which we collected using our primary and secondary information is revalidated in real time.

Step 4: QA/QC Process
After all the data collection and validation our team does a final level of quality check and quality assurance to get rid of any unwanted or undesired mistakes. This might include but not limited to getting rid of the any typos, duplication of numbers or missing of any important information. The people involved in this process include technical content writers, research heads and graphics people. Once this process is completed the title gets uploader on our platform for our clients to read it.
Step 5: Final QC/QA Process:
This is the last process and comes when the client has ordered the study. In this process a final QA/QC is done before the study is emailed to the client. Since we believe in giving our clients a good experience of our research studies, therefore, to make sure that we do not lack at our end in any way humanly possible we do a final round of quality check and then dispatch the study to the client.
Key Segments:
By Type
Off-site regeneration
On-site regeneration
By Application
Refineries
Chemicals and Petrochemicals
Others
Request for Segment Customization as per your Business Requirement: Segment Customization Request
Regional Coverage:
North America
US
Canada
Mexico
Europe
Eastern Europe
Poland
Romania
Hungary
Turkey
Rest of Eastern Europe
Western Europe
Germany
France
UK
Italy
Spain
Netherlands
Switzerland
Austria
Rest of Western Europe
Asia Pacific
China
India
Japan
South Korea
Vietnam
Singapore
Australia
Rest of Asia Pacific
Middle East & Africa
Middle East
UAE
Egypt
Saudi Arabia
Qatar
Rest of Middle East
Africa
Nigeria
South Africa
Rest of Africa
Latin America
Brazil
Argentina
Colombia
Rest of Latin America
Request for Country Level Research Report: Country Level Customization Request
Available Customization
With the given market data, SNS Insider offers customization as per the company’s specific needs. The following customization options are available for the report:
Detailed Volume Analysis
Criss-Cross segment analysis (e.g. Product X Application)
Competitive Product Benchmarking
Geographic Analysis
Additional countries in any of the regions
Customized Data Representation
Detailed analysis and profiling of additional market players
The Nano Calcium Carbonate Market size was USD 8.59 billion in 2023 and is expected to reach USD 19.53 billion by 2032 and grow at a CAGR of 9.56% over the forecast period of 2024-2032.
The Photoinitiator Market size was USD 2.40 billion in 2023 and is expected to reach USD 4.39 billion by 2032 and grow at a CAGR of 6.92% over the forecast period of 2024-2032.
The plant growth regulators market size was valued at USD 3.29 billion in 2023 and is expected to reach USD 6.45 billion by 2032, growing at a CAGR of 7.77% over the forecast period of 2024-2032.
The Green and Bio Polyols market size was valued at USD 5.11 billion in 2023 and is expected to reach USD 10.87 billion by 2032 and grow at a CAGR of 8.75% over the forecast period 2024-2032.
Copper Mining Market size was valued at USD 8.9 billion in 2023 and is expected to reach USD 12.1 billion by 2032, growing at a CAGR of 3.5% from 2024-2032.
Advanced Composites Market was valued at USD 38.5 billion in 2023 and is expected to reach USD 91.1 Billion by 2032, growing at a CAGR of 10.07% from 2024-2032.

Hi! Click one of our member below to chat on Phone
© 2025 All Rights Reserved by SNS Insider Pvt Ltd


