image

Cash Flow Management Marke Report Scope & Overview:

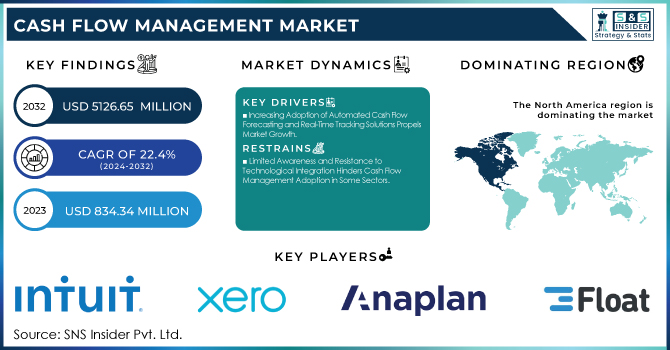
The Cash Flow Management Market Size was valued at USD 834.34 Million in 2023 and is expected to reach USD 5126.65 Million by 2032 and grow at a CAGR of 22.4% over the forecast period 2024-2032. The Market is evolving with increasing adoption of automated solutions across industries. 82% of small businesses fail due to poor cash flow management, highlighting the demand for efficient tools. Delayed payments impact over 60% of SMEs globally, making Days Sales Outstanding (DSO) a crucial metric. 40% of financial firms use AI-driven cash flow analytics, improving liquidity management by 20-30%. Cloud-based solutions are growing, alongside a 25% annual increase in API-based integrations. These trends reflect the market’s digital transformation, emphasizing the need for advanced financial planning and forecasting solutions.

Cash Flow Management Market Revenue Analysis

To Get More Information on Cash Flow Management Market - Request Sample Report

Market Dynamics

Key Driver:

  • Increasing Adoption of Automated Cash Flow Forecasting and Real-Time Tracking Solutions Propels Market Growth

The growing demand for automated cash flow forecasting and real-time tracking solutions is a key driver for the Cash Flow Management Market. Businesses are increasingly recognizing the importance of accurate, timely cash flow insights to ensure liquidity and business continuity. By leveraging advanced technologies such as cloud-based solutions and AI-powered forecasting tools, organizations can improve cash flow management, reduce operational inefficiencies, and make more informed financial decisions. Small and medium-sized enterprises (SMEs), along with large enterprises, are adopting these tools to gain greater visibility into their cash flow, reduce human errors, and enhance financial planning. The global push for digitization across industries, coupled with the increasing reliance on data-driven decision-making, is boosting the demand for automated solutions. As these technologies become more accessible and affordable, the adoption rate continues to grow, further accelerating market growth.

Restraint:

  • Limited Awareness and Resistance to Technological Integration Hinders Cash Flow Management Adoption in Some Sectors

A significant restraint in the Cash Flow Management Market is the limited awareness and resistance to adopting new technologies in certain sectors. Small businesses and traditional industries often face challenges when transitioning to automated cash flow management solutions, primarily due to a lack of knowledge about available tools and the perceived complexity of integration. Many businesses, especially in developing regions, continue to rely on manual methods or outdated software for financial management, hindering their ability to fully capitalize on advanced cash flow management solutions. Additionally, the reluctance to shift from legacy systems to cloud-based solutions or embrace AI and machine learning technologies further slows down adoption. As businesses fear the upfront costs and technical challenges of transitioning, this resistance remains a significant barrier to the broader market's growth.

Opportunity:

  • Growing Integration of Artificial Intelligence and Machine Learning Presents New Opportunities for Cash Flow Optimization

The integration of artificial intelligence (AI) and machine learning (ML) presents a significant opportunity for the Cash Flow Management Market. AI and ML algorithms can process vast amounts of financial data and generate accurate cash flow forecasts, making them essential tools for businesses aiming to optimize liquidity management. These technologies can help businesses predict cash flow patterns more accurately, detect anomalies, and provide insights for better financial decision-making. Additionally, AI can be used to automate routine tasks, reducing human error and enhancing overall efficiency. As AI and ML technologies continue to evolve, they provide substantial opportunities for financial firms and businesses to enhance forecasting, liquidity planning, and risk management. By embracing these technologies, companies can gain a competitive edge and achieve more precise control over their financial operations, ultimately driving market growth.

Challenge:

  • Data Security and Privacy Concerns in Cloud-Based Solutions Pose Challenges for Widespread Cash Flow Management Adoption

Data security and privacy concerns in cloud-based solutions are a major challenge for the Cash Flow Management Market. As businesses increasingly adopt cloud platforms for managing sensitive financial data, concerns about the security of financial information and the risk of data breaches are growing. Companies worry about the potential exposure of proprietary data and financial records to cyberattacks. Despite advancements in encryption and security protocols, businesses remain cautious about moving their financial operations to the cloud, especially in sectors dealing with highly sensitive information such as healthcare and BFSI (Banking, Financial Services, and Insurance). As regulatory requirements for data protection become stricter, businesses must ensure compliance with global standards like GDPR and others. This challenge could slow the adoption of cloud-based cash flow management solutions unless providers can offer robust security measures and assurances regarding data protection.

Segments Analysis

By Component

In 2023, the Solution segment dominated the Cash Flow Management Market with a substantial revenue share of 62%. This growth can be attributed to the increasing demand for automated tools and software that offer advanced cash flow forecasting, liquidity management, and financial planning capabilities. These solutions help businesses streamline financial operations, offering real-time tracking and AI-powered forecasting, which significantly improves decision-making. The focus is shifting towards cloud-based solutions due to their scalability, accessibility, and ease of integration into existing systems.

The Services segment in the Cash Flow Management Market is experiencing the largest growth, with a remarkable CAGR of 23.3% during the forecast period. This growth is driven by the increasing demand for consulting, implementation, and support services related to cash flow management tools. Companies such as Float, which offers real-time cash flow forecasting combined with expert financial advisory services, have helped businesses maximize their liquidity management.

Similarly, Finagraph provides cloud-based financial analysis services to help businesses optimize their cash flow strategy. The need for comprehensive services is rising as organizations increasingly adopt complex financial management tools and require professional guidance for seamless integration.

By Deployment Mode

In 2023, the On-Premise segment accounted for the largest revenue share in the Cash Flow Management Market. This dominance can be attributed to organizations' preference for secure, customized solutions where data privacy and control are paramount. Large enterprises, especially those in industries like banking, healthcare, and government, favor on-premise deployments due to strict regulatory requirements and the need for direct control over sensitive financial data. Companies such as Sage with its Sage Intacct Cash Management solution and Anaplan with its Anaplan Cash Flow Planning have been key players in this segment, providing on-premise solutions tailored to large enterprises with complex financial structures.

The Cloud-Based segment is projected to grow at the highest CAGR during the forecast period in the Cash Flow Management Market, driven by businesses' increasing shift towards digital solutions. Cloud-based cash flow management solutions provide scalability, accessibility, and integration capabilities that on-premise solutions cannot match. The demand for these solutions is further propelled by their ability to provide real-time cash flow forecasting, automated reporting, and AI-driven insights.

By End-User

In 2023, the SME segment held the largest revenue share in the Cash Flow Management Market, driven by the increasing need for efficient, scalable, and affordable financial management tools. SMEs are often more vulnerable to cash flow disruptions due to their limited financial resources, which makes effective cash flow management crucial for business survival and growth.

Additionally, Float has introduced cash flow forecasting tools aimed at helping small businesses with real-time insights, enabling them to make informed financial decisions. The Sage 50cloud Cash Flow Manager and Agicap have also emerged as strong players, offering comprehensive solutions that integrate with accounting software and provide automated forecasting and budgeting tools. As the adoption of digital tools continues to rise among SMEs, especially those in the tech, retail, and service industries, the SME segment is expected to remain dominant in the market.

By Vertical

In 2023, the BFSI segment held the largest revenue share of 24% in the Cash Flow Management Market, driven by the sector’s inherent need for precise liquidity management and financial forecasting. Financial institutions are increasingly adopting cash flow management solutions to enhance risk management, optimize capital allocation, and ensure regulatory compliance. Companies like Sage Intacct and Anaplan offer advanced cash flow forecasting and financial reporting solutions tailored to the needs of the BFSI sector, allowing banks and financial institutions to track cash inflows and outflows accurately.

The Retail segment is projected to grow at the highest CAGR of 24.92% during the forecasted period in the Cash Flow Management Market, driven by the growing need for efficient cash flow tools in a dynamic and highly competitive industry. Retailers face significant challenges in managing cash flow due to fluctuations in sales, seasonal variations, and inventory management. To address these challenges, companies like Float and Agicap have developed advanced cloud-based cash flow forecasting solutions that enable retailers to track cash flow in real-time, manage liquidity, and forecast revenue based on sales patterns.

Regional Analysis

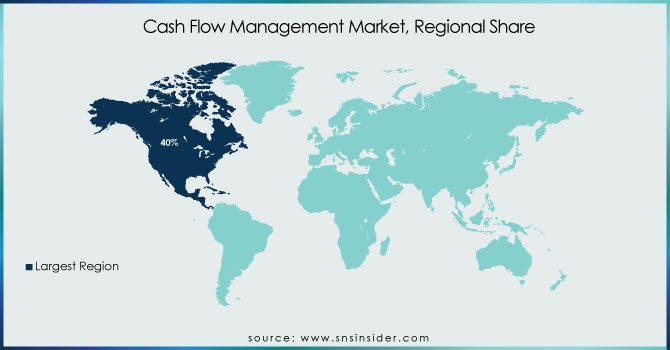
In 2023, North America dominated the Cash Flow Management Market, holding a significant market share of approximately 40%. This dominance is driven by the region's mature financial ecosystem, widespread adoption of advanced financial technologies, and a strong presence of key market players like Intuit, Sage, and Xero. North American businesses, particularly in sectors like BFSI, healthcare, and IT, are early adopters of cloud-based cash flow management solutions, which provide real-time insights, forecasting, and automation to enhance financial operations. The increasing focus on improving operational efficiency, regulatory compliance, and managing liquidity has led to a robust demand for AI-driven forecasting and automated cash flow tracking tools.

The Asia Pacific region is the fastest-growing in the Cash Flow Management Market in 2023, with an estimated CAGR of 25% during the forecast period. This rapid growth can be attributed to the increasing number of small and medium-sized enterprises (SMEs) in countries like China, India, and Japan, which are embracing digital financial tools to manage cash flow more effectively. The region’s rising digital transformation, the surge in e-commerce, and the growing emphasis on financial inclusion have created significant opportunities for cash flow management solution providers. With governments in the region promoting digital financial services and SMEs increasingly seeking more efficient financial management systems, the APAC region is poised for continued growth in the coming years.

Cash-Flow-Management-Market-Regional-Share

Do You Need any Customization Research on Cash Flow Management Market - Enquire Now

Key Players

Some of the major players in the Cash Flow Management Market are:

  • Intuit (QuickBooks Cash Flow, QuickBooks Online)

  • Xero (Xero Cash Flow, Xero Business Finance)

  • Anaplan (Anaplan for Finance, Anaplan Cash Flow Planning)

  • Sage (Sage Intacct Cash Management, Sage 50cloud Cash Flow Manager)

  • Float (Float Cash Flow Forecasting, Float Budgeting & Scenario Planning)

  • Panguru (Planguru Budgeting, Planguru Forecasting)

  • Dryrun (Dryrun Cash Flow Forecasting, Dryrun Scenario Planning)

  • Caflou (Caflou Business Management, Caflou Cash Flow Management)

  • Pulse (Pulse Cash Flow Software, Pulse Forecasting Tool)

  • Cash Analytics (CashAnalytics Cash Flow Forecasting, CashAnalytics Liquidity Planning)

  • Fluidly (Fluidly Intelligent Cash Flow, Fluidly Credit Control)

  • Finagraph (Finagraph CashFlowTool, Finagraph Financial Analysis)

  • Cashflowmapper (Cashflowmapper Forecasting, Cashflowmapper Planning Tool)

  • Finsync (Finsync Cash Flow Management, Finsync Accounting)

  • Cashflow Manager (Cashflow Manager Gold, Cashflow Manager Accounting Software)

  • Agicap (Agicap Cash Flow Management, Agicap Liquidity Planning)

  • Calqulate (Calqulate Cash Flow Forecasting, Calqulate SaaS Financial Planning)

  • Cashbook (Cashbook Cash Flow Automation, Cashbook Treasury Management)

  • Cash Flow Mojo (Cash Flow Mojo Business Planning, Cash Flow Mojo Budgeting)

  • Cashforce (Cashforce Smart Cash Flow, Cashforce Liquidity Forecasting)

Recent Trends

  • September 2024Intuit launched the Intuit Enterprise Suite to help businesses streamline operations, manage cash flow, and scale efficiently. The suite integrated AI-driven financial tools to enhance forecasting and liquidity management.

  • February 2025Xero partnered with Bluevine to provide small businesses with enhanced banking solutions. The collaboration aimed to improve cash flow management by offering integrated banking, lending, and payment services within the Xero platform.

Cash Flow Management Market Report Scope:

Report Attributes Details
Market Size in 2023 USD 834.34 Million
Market Size by 2032 USD 5126.65 Million
CAGR CAGR of 22.4% From 2024 to 2032
Base Year 2023
Forecast Period 2024-2032
Historical Data 2020-2022
Report Scope & Coverage Market Size, Segments Analysis, Competitive  Landscape, Regional Analysis, DROC & SWOT Analysis, Forecast Outlook
Key Segments • By Component (Solution, Services)
• By Deployment Mode (Cloud-Based, On-Premise)
• By End-User (SMEs, Professionals)
• By Vertical (BFSI, IT & Telecom, Media, Entertainment, Healthcare, Retail, Manufacturing, Government, Others)
Regional Analysis/Coverage North America (US, Canada, Mexico), Europe (Eastern Europe [Poland, Romania, Hungary, Turkey, Rest of Eastern Europe] Western Europe] Germany, France, UK, Italy, Spain, Netherlands, Switzerland, Austria, Rest of Western Europe]), Asia Pacific (China, India, Japan, South Korea, Vietnam, Singapore, Australia, Rest of Asia Pacific), Middle East & Africa (Middle East [UAE, Egypt, Saudi Arabia, Qatar, Rest of Middle East], Africa [Nigeria, South Africa, Rest of Africa], Latin America (Brazil, Argentina, Colombia, Rest of Latin America)
Company Profiles Intuit, Xero, Anaplan, Sage, Float, Planguru, Dryrun, Caflou, Pulse, Cash Analytics, Fluidly, Finagraph, Cashflowmapper, Finsync, Cashflow Manager, Agicap, Calqulate, Cashbook, Cash Flow Mojo, Cashforce.


Frequently Asked Questions

Ans: The Cash Flow Management Market is expected to grow at a CAGR of 22.4% during 2024-2032.

Ans: The Cash Flow Management Market size was USD 834.34 million in 2023 and is expected to Reach USD 5126.65 million by 2032.

Ans: The major growth factor of the Cash Flow Management Market is the increasing adoption of automated, cloud-based solutions for real-time cash flow forecasting and liquidity management.

Ans: The BFSI segment dominated the Cash Flow Management Market.

Ans: North America dominated the Cash Flow Management Market in 2023.

Table Of Content

1. Introduction

1.1 Market Definition

1.2 Scope (Inclusion and Exclusions)

1.3 Research Assumptions

2. Executive Summary

2.1 Market Overview

2.2 Regional Synopsis

2.3 Competitive Summary

3. Research Methodology

3.1 Top-Down Approach

3.2 Bottom-up Approach

3.3. Data Validation

3.4 Primary Interviews

4. Market Dynamics Impact Analysis

4.1 Market Driving Factors Analysis

4.1.1 Drivers

4.1.2 Restraints

4.1.3 Opportunities

4.1.4 Challenges

4.2 PESTLE Analysis

4.3 Porter’s Five Forces Model

5. Statistical Insights and Trends Reporting

5.1 API Integration Growth

5.2 User Demographics, 2023

5.3 Market Share of Deployment Modes, 2023

5.4 Cost Savings from Automation

6. Competitive Landscape

6.1 List of Major Companies, By Region

6.2 Market Share Analysis, By Region

6.3 Product Benchmarking

6.3.1 Product specifications and features

6.3.2 Pricing

6.4 Strategic Initiatives

6.4.1 Marketing and promotional activities

6.4.2 Distribution and Supply Chain Strategies

6.4.3 Expansion plans and new product launches

6.4.4 Strategic partnerships and collaborations

6.5 Technological Advancements

6.6 Market Positioning and Branding

7. Cash Flow Management Market Segmentation, By Vertical

7.1 Chapter Overview

7.2 BFSI

7.2.1 BFSI Market Trends Analysis (2020-2032)

7.2.2 BFSI Market Size Estimates and Forecasts to 2032 (USD Million)

7.3 Healthcare

7.3.1 Healthcare Market Trends Analysis (2020-2032)

7.3.2 Healthcare Market Size Estimates and Forecasts to 2032 (USD Million)

7.4 Media

7.4.1 Media Market Trends Analysis (2020-2032)

7.4.2 Media Market Size Estimates and Forecasts to 2032 (USD Million)

7.5 IT and Telecom

7.5.1 IT and Telecom Market Trends Analysis (2020-2032)

7.5.2 IT and Telecom Market Size Estimates and Forecasts to 2032 (USD Million)

7.6 Government

7.6.1 Government Market Trends Analysis (2020-2032)

7.6.2 Government Market Size Estimates and Forecasts to 2032 (USD Million)

7.7 Entertainment

7.7.1 Entertainment Market Trends Analysis (2020-2032)

7.7.2 Entertainment Market Size Estimates and Forecasts to 2032 (USD Million)

7.8 Retail

7.8.1 Retail Market Trends Analysis (2020-2032)

7.8.2 Retail Market Size Estimates and Forecasts to 2032 (USD Million)

7.9 Manufacturing

7.9.1 Manufacturing Market Trends Analysis (2020-2032)

7.9.2 Manufacturing Market Size Estimates and Forecasts to 2032 (USD Million)

7.10 Others

7.10.1 Others Market Trends Analysis (2020-2032)

7.10.2 Others Market Size Estimates and Forecasts to 2032 (USD Million)

8. Cash Flow Management Market Segmentation, By Component

8.1 Chapter Overview

8.2 Solutions

8.2.1 Solutions Market Trends Analysis (2020-2032)

8.2.2 Solutions Market Size Estimates and Forecasts to 2032 (USD Million)

8.3 Services

8.3.1 Services Market Trends Analysis (2020-2032)

8.3.2 Services Market Size Estimates and Forecasts to 2032 (USD Million)

9. Cash Flow Management Market Segmentation, By Deployment

9.1 Chapter Overview

9.2 Cloud Based

9.2.1 Cloud-Based Market Trends Analysis (2020-2032)

9.2.2 Cloud-Based Market Size Estimates and Forecasts to 2032 (USD Million)

9.3 On-premise

9.3.1 On-premise Market Trends Analysis (2020-2032)

9.3.2 On-premise Market Size Estimates and Forecasts to 2032 (USD Million)

10. Cash Flow Management Market Segmentation, By End-User

10.1 Chapter Overview

10.2 SME’s

10.2.1 SME’s Market Trends Analysis (2020-2032)

10.2.2 SME’s Market Size Estimates and Forecasts to 2032 (USD Million)

10.3 Professionals

10.3.1 Professionals Market Trends Analysis (2020-2032)

10.3.2 Professionals Market Size Estimates and Forecasts to 2032 (USD Million)

11. Regional Analysis

11.1 Chapter Overview

11.2 North America

11.2.1 Trends Analysis

11.2.2 North America Cash Flow Management Market Estimates and Forecasts, by Country (2020-2032) (USD Million)

11.2.3 North America Cash Flow Management Market Estimates and Forecasts, By Vertical (2020-2032) (USD Million) 

11.2.4 North America Cash Flow Management Market Estimates and Forecasts, By Component (2020-2032) (USD Million)

11.2.5 North America Cash Flow Management Market Estimates and Forecasts, By Deployment (2020-2032) (USD Million)

11.2.6 North America Cash Flow Management Market Estimates and Forecasts,  By End-User(2020-2032) (USD Million)

11.2.7 USA

11.2.7.1 USA Cash Flow Management Market Estimates and Forecasts, By Vertical (2020-2032) (USD Million)

11.2.7.2 USA Cash Flow Management Market Estimates and Forecasts, By Component (2020-2032) (USD Million)

11.2.7.3 USA Cash Flow Management Market Estimates and Forecasts, By Deployment (2020-2032) (USD Million)

11.2.7.4 USA Cash Flow Management Market Estimates and Forecasts,  By End-User(2020-2032) (USD Million)

11.2.8 Canada

11.2.8.1 Canada Cash Flow Management Market Estimates and Forecasts, By Vertical (2020-2032) (USD Million)

11.2.8.2 Canada Cash Flow Management Market Estimates and Forecasts, By Component (2020-2032) (USD Million)

11.2.8.3 Canada Cash Flow Management Market Estimates and Forecasts, By Deployment (2020-2032) (USD Million)

11.2.8.4 Canada Cash Flow Management Market Estimates and Forecasts,  By End-User (2020-2032) (USD Million)

11.2.9 Mexico

11.2.9.1 Mexico Cash Flow Management Market Estimates and Forecasts, By Vertical (2020-2032) (USD Million)

11.2.9.2 Mexico Cash Flow Management Market Estimates and Forecasts, By Component (2020-2032) (USD Million)

11.2.9.3 Mexico Cash Flow Management Market Estimates and Forecasts, By Deployment (2020-2032) (USD Million)

11.2.9.4 Mexico Cash Flow Management Market Estimates and Forecasts,  By End-User (2020-2032) (USD Million)

11.3 Europe

11.3.1 Eastern Europe

11.3.1.1 Trends Analysis

11.3.1.2 Eastern Europe Cash Flow Management Market Estimates and Forecasts, by Country (2020-2032) (USD Million)

11.3.1.3 Eastern Europe Cash Flow Management Market Estimates and Forecasts, By Vertical (2020-2032) (USD Million) 

11.3.1.4 Eastern Europe Cash Flow Management Market Estimates and Forecasts, By Component (2020-2032) (USD Million)

11.3.1.5 Eastern Europe Cash Flow Management Market Estimates and Forecasts, By Deployment (2020-2032) (USD Million)

11.3.1.6 Eastern Europe Cash Flow Management Market Estimates and Forecasts,  By End-User(2020-2032) (USD Million)

11.3.1.7 Poland

11.3.1.7.1 Poland Cash Flow Management Market Estimates and Forecasts, By Vertical (2020-2032) (USD Million)

11.3.1.7.2 Poland Cash Flow Management Market Estimates and Forecasts, By Component (2020-2032) (USD Million)

11.3.1.7.3 Poland Cash Flow Management Market Estimates and Forecasts, By Deployment (2020-2032) (USD Million)

11.3.1.7.4 Poland Cash Flow Management Market Estimates and Forecasts,  By End-User(2020-2032) (USD Million)

11.3.1.8 Romania

11.3.1.8.1 Romania Cash Flow Management Market Estimates and Forecasts, By Vertical (2020-2032) (USD Million)

11.3.1.8.2 Romania Cash Flow Management Market Estimates and Forecasts, By Component (2020-2032) (USD Million)

11.3.1.8.3 Romania Cash Flow Management Market Estimates and Forecasts, By Deployment (2020-2032) (USD Million)

11.3.1.8.4 Romania Cash Flow Management Market Estimates and Forecasts,  By End-User (2020-2032) (USD Million)

11.3.1.9 Hungary

11.3.1.9.1 Hungary Cash Flow Management Market Estimates and Forecasts, By Vertical (2020-2032) (USD Million)

11.3.1.9.2 Hungary Cash Flow Management Market Estimates and Forecasts, By Component (2020-2032) (USD Million)

11.3.1.9.3 Hungary Cash Flow Management Market Estimates and Forecasts, By Deployment (2020-2032) (USD Million)

11.3.1.9.4 Hungary Cash Flow Management Market Estimates and Forecasts,  By End-User  (2020-2032) (USD Million)

11.3.1.10 Turkey

11.3.1.10.1 Turkey Cash Flow Management Market Estimates and Forecasts, By Vertical (2020-2032) (USD Million)

11.3.1.10.2 Turkey Cash Flow Management Market Estimates and Forecasts, By Component (2020-2032) (USD Million)

11.3.1.10.3 Turkey Cash Flow Management Market Estimates and Forecasts, By Deployment (2020-2032) (USD Million)

11.3.1.10.4 Turkey Cash Flow Management Market Estimates and Forecasts,  By End-User (2020-2032) (USD Million)

11.3.1.11 Rest of Eastern Europe

11.3.1.11.1 Rest of Eastern Europe Cash Flow Management Market Estimates and Forecasts, By Vertical (2020-2032) (USD Million)

11.3.1.11.2 Rest of Eastern Europe Cash Flow Management Market Estimates and Forecasts, By Component (2020-2032) (USD Million)

11.3.1.11.3 Rest of Eastern Europe Cash Flow Management Market Estimates and Forecasts, By Deployment (2020-2032) (USD Million)

11.3.1.11.4 Rest of Eastern Europe Cash Flow Management Market Estimates and Forecasts,  By End-User (2020-2032) (USD Million)

11.3.2 Western Europe

11.3.2.1 Trends Analysis

11.3.2.2 Western Europe Cash Flow Management Market Estimates and Forecasts, by Country (2020-2032) (USD Million)

11.3.2.3 Western Europe Cash Flow Management Market Estimates and Forecasts, By Vertical (2020-2032) (USD Million) 

11.3.2.4 Western Europe Cash Flow Management Market Estimates and Forecasts, By Component (2020-2032) (USD Million)

11.3.2.5 Western Europe Cash Flow Management Market Estimates and Forecasts, By Deployment (2020-2032) (USD Million)

11.3.2.6 Western Europe Cash Flow Management Market Estimates and Forecasts,  By End-User (2020-2032) (USD Million)

11.3.2.7 Germany

11.3.2.7.1 Germany Cash Flow Management Market Estimates and Forecasts, By Vertical (2020-2032) (USD Million)

11.3.2.7.2 Germany Cash Flow Management Market Estimates and Forecasts, By Component (2020-2032) (USD Million)

11.3.2.7.3 Germany Cash Flow Management Market Estimates and Forecasts, By Deployment (2020-2032) (USD Million)

11.3.2.7.4 Germany Cash Flow Management Market Estimates and Forecasts,  By End-User (2020-2032) (USD Million)

11.3.2.8 France

11.3.2.8.1 France Cash Flow Management Market Estimates and Forecasts, By Vertical (2020-2032) (USD Million)

11.3.2.8.2 France Cash Flow Management Market Estimates and Forecasts, By Component (2020-2032) (USD Million)

11.3.2.8.3 France Cash Flow Management Market Estimates and Forecasts, By Deployment (2020-2032) (USD Million)

11.3.2.8.4 France Cash Flow Management Market Estimates and Forecasts,  By End-User (2020-2032) (USD Million)

11.3.2.9 UK

11.3.2.9.1 UK Cash Flow Management Market Estimates and Forecasts, By Vertical (2020-2032) (USD Million)

11.3.2.9.2 UK Cash Flow Management Market Estimates and Forecasts, By Component (2020-2032) (USD Million)

11.3.2.9.3 UK Cash Flow Management Market Estimates and Forecasts, By Deployment (2020-2032) (USD Million)

11.3.2.9.4 UK Cash Flow Management Market Estimates and Forecasts,  By End-User (2020-2032) (USD Million)

11.3.2.10 Italy

11.3.2.10.1 Italy Cash Flow Management Market Estimates and Forecasts, By Vertical (2020-2032) (USD Million)

11.3.2.10.2 Italy Cash Flow Management Market Estimates and Forecasts, By Component (2020-2032) (USD Million)

11.3.2.10.3 Italy Cash Flow Management Market Estimates and Forecasts, By Deployment (2020-2032) (USD Million)

11.3.2.10.4 Italy Cash Flow Management Market Estimates and Forecasts,  By End-User (2020-2032) (USD Million)

11.3.2.11 Spain

11.3.2.11.1 Spain Cash Flow Management Market Estimates and Forecasts, By Vertical (2020-2032) (USD Million)

11.3.2.11.2 Spain Cash Flow Management Market Estimates and Forecasts, By Component (2020-2032) (USD Million)

11.3.2.11.3 Spain Cash Flow Management Market Estimates and Forecasts, By Deployment (2020-2032) (USD Million)

11.3.2.11.4 Spain Cash Flow Management Market Estimates and Forecasts,  By End-User (2020-2032) (USD Million)

11.3.2.12 Netherlands

11.3.2.12.1 Netherlands Cash Flow Management Market Estimates and Forecasts, By Vertical (2020-2032) (USD Million)

11.3.2.12.2 Netherlands Cash Flow Management Market Estimates and Forecasts, By Component (2020-2032) (USD Million)

11.3.2.12.3 Netherlands Cash Flow Management Market Estimates and Forecasts, By Deployment (2020-2032) (USD Million)

11.3.2.12.4 Netherlands Cash Flow Management Market Estimates and Forecasts,  By End-User (2020-2032) (USD Million)

11.3.2.13 Switzerland

11.3.2.13.1 Switzerland Cash Flow Management Market Estimates and Forecasts, By Vertical (2020-2032) (USD Million)

11.3.2.13.2 Switzerland Cash Flow Management Market Estimates and Forecasts, By Component (2020-2032) (USD Million)

11.3.2.13.3 Switzerland Cash Flow Management Market Estimates and Forecasts, By Deployment (2020-2032) (USD Million)

11.3.2.13.4 Switzerland Cash Flow Management Market Estimates and Forecasts,  By End-User (2020-2032) (USD Million)

11.3.2.14 Austria

11.3.2.14.1 Austria Cash Flow Management Market Estimates and Forecasts, By Vertical (2020-2032) (USD Million)

11.3.2.14.2 Austria Cash Flow Management Market Estimates and Forecasts, By Component (2020-2032) (USD Million)

11.3.2.14.3 Austria Cash Flow Management Market Estimates and Forecasts, By Deployment (2020-2032) (USD Million)

11.3.2.14.4 Austria Cash Flow Management Market Estimates and Forecasts,  By End-User (2020-2032) (USD Million)

11.3.2.15 Rest of Western Europe

11.3.2.15.1 Rest of Western Europe Cash Flow Management Market Estimates and Forecasts, By Vertical (2020-2032) (USD Million)

11.3.2.15.2 Rest of Western Europe Cash Flow Management Market Estimates and Forecasts, By Component (2020-2032) (USD Million)

11.3.2.15.3 Rest of Western Europe Cash Flow Management Market Estimates and Forecasts, By Deployment (2020-2032) (USD Million)

11.3.2.15.4 Rest of Western Europe Cash Flow Management Market Estimates and Forecasts,  By End-User (2020-2032) (USD Million)

11.4 Asia Pacific

11.4.1 Trends Analysis

11.4.2 Asia Pacific Cash Flow Management Market Estimates and Forecasts, by Country (2020-2032) (USD Million)

11.4.3 Asia Pacific Cash Flow Management Market Estimates and Forecasts, By Vertical (2020-2032) (USD Million) 

11.4.4 Asia Pacific Cash Flow Management Market Estimates and Forecasts, By Component (2020-2032) (USD Million)

11.4.5 Asia Pacific Cash Flow Management Market Estimates and Forecasts, By Deployment (2020-2032) (USD Million)

11.4.6 Asia Pacific Cash Flow Management Market Estimates and Forecasts,  By End-User (2020-2032) (USD Million)

11.4.7 China

11.4.7.1 China Cash Flow Management Market Estimates and Forecasts, By Vertical (2020-2032) (USD Million)

11.4.7.2 China Cash Flow Management Market Estimates and Forecasts, By Component (2020-2032) (USD Million)

11.4.7.3 China Cash Flow Management Market Estimates and Forecasts, By Deployment (2020-2032) (USD Million)

11.4.7.4 China Cash Flow Management Market Estimates and Forecasts,  By End-User (2020-2032) (USD Million)

11.4.8 India

11.4.8.1 India Cash Flow Management Market Estimates and Forecasts, By Vertical (2020-2032) (USD Million)

11.4.8.2 India Cash Flow Management Market Estimates and Forecasts, By Component (2020-2032) (USD Million)

11.4.8.3 India Cash Flow Management Market Estimates and Forecasts, By Deployment (2020-2032) (USD Million)

11.4.8.4 India Cash Flow Management Market Estimates and Forecasts,  By End-User (2020-2032) (USD Million)

11.4.9 Japan

11.4.9.1 Japan Cash Flow Management Market Estimates and Forecasts, By Vertical (2020-2032) (USD Million)

11.4.9.2 Japan Cash Flow Management Market Estimates and Forecasts, By Component (2020-2032) (USD Million)

11.4.9.3 Japan Cash Flow Management Market Estimates and Forecasts, By Deployment (2020-2032) (USD Million)

11.4.9.4 Japan Cash Flow Management Market Estimates and Forecasts,  By End-User (2020-2032) (USD Million)

11.4.10 South Korea

11.4.10.1 South Korea Cash Flow Management Market Estimates and Forecasts, By Vertical (2020-2032) (USD Million)

11.4.10.2 South Korea Cash Flow Management Market Estimates and Forecasts, By Component (2020-2032) (USD Million)

11.4.10.3 South Korea Cash Flow Management Market Estimates and Forecasts, By Deployment (2020-2032) (USD Million)

11.4.10.4 South Korea Cash Flow Management Market Estimates and Forecasts,  By End-User (2020-2032) (USD Million)

11.4.11 Vietnam

11.4.11.1 Vietnam Cash Flow Management Market Estimates and Forecasts, By Vertical (2020-2032) (USD Million)

11.4.11.2 Vietnam Cash Flow Management Market Estimates and Forecasts, By Component (2020-2032) (USD Million)

11.4.11.3 Vietnam Cash Flow Management Market Estimates and Forecasts, By Deployment (2020-2032) (USD Million)

11.4.11.4 Vietnam Cash Flow Management Market Estimates and Forecasts,  By End-User (2020-2032) (USD Million)

11.4.12 Singapore

11.4.12.1 Singapore Cash Flow Management Market Estimates and Forecasts, By Vertical (2020-2032) (USD Million)

11.4.12.2 Singapore Cash Flow Management Market Estimates and Forecasts, By Component (2020-2032) (USD Million)

11.4.12.3 Singapore Cash Flow Management Market Estimates and Forecasts, By Deployment (2020-2032) (USD Million)

11.4.12.4 Singapore Cash Flow Management Market Estimates and Forecasts,  By End-User (2020-2032) (USD Million)

11.4.13 Australia

11.4.13.1 Australia Cash Flow Management Market Estimates and Forecasts, By Vertical (2020-2032) (USD Million)

11.4.13.2 Australia Cash Flow Management Market Estimates and Forecasts, By Component (2020-2032) (USD Million)

11.4.13.3 Australia Cash Flow Management Market Estimates and Forecasts, By Deployment (2020-2032) (USD Million)

11.4.13.4 Australia Cash Flow Management Market Estimates and Forecasts,  By End-User (2020-2032) (USD Million)

11.4.14 Rest of Asia Pacific

11.4.14.1 Rest of Asia Pacific Cash Flow Management Market Estimates and Forecasts, By Vertical (2020-2032) (USD Million)

11.4.14.2 Rest of Asia Pacific Cash Flow Management Market Estimates and Forecasts, By Component (2020-2032) (USD Million)

11.4.14.3 Rest of Asia Pacific Cash Flow Management Market Estimates and Forecasts, By Deployment (2020-2032) (USD Million)

11.4.14.4 Rest of Asia Pacific Cash Flow Management Market Estimates and Forecasts,  By End-User (2020-2032) (USD Million)

11.5 Middle East and Africa

11.5.1 Middle East

11.5.1.1 Trends Analysis

11.5.1.2 Middle East Cash Flow Management Market Estimates and Forecasts, by Country (2020-2032) (USD Million)

11.5.1.3 Middle East Cash Flow Management Market Estimates and Forecasts, By Vertical (2020-2032) (USD Million) 

11.5.1.4 Middle East Cash Flow Management Market Estimates and Forecasts, By Component (2020-2032) (USD Million)

11.5.1.5 Middle East Cash Flow Management Market Estimates and Forecasts, By Deployment (2020-2032) (USD Million)

11.5.1.6 Middle East Cash Flow Management Market Estimates and Forecasts,  By End-User (2020-2032) (USD Million)

11.5.1.7 UAE

11.5.1.7.1 UAE Cash Flow Management Market Estimates and Forecasts, By Vertical (2020-2032) (USD Million)

11.5.1.7.2 UAE Cash Flow Management Market Estimates and Forecasts, By Component (2020-2032) (USD Million)

11.5.1.7.3 UAE Cash Flow Management Market Estimates and Forecasts, By Deployment (2020-2032) (USD Million)

11.5.1.7.4 UAE Cash Flow Management Market Estimates and Forecasts,  By End-User (2020-2032) (USD Million)

11.5.1.8 Egypt

11.5.1.8.1 Egypt Cash Flow Management Market Estimates and Forecasts, By Vertical (2020-2032) (USD Million)

11.5.1.8.2 Egypt Cash Flow Management Market Estimates and Forecasts, By Component (2020-2032) (USD Million)

11.5.1.8.3 Egypt Cash Flow Management Market Estimates and Forecasts, By Deployment (2020-2032) (USD Million)

11.5.1.8.4 Egypt Cash Flow Management Market Estimates and Forecasts,  By End-User (2020-2032) (USD Million)

11.5.1.9 Saudi Arabia

11.5.1.9.1 Saudi Arabia Cash Flow Management Market Estimates and Forecasts, By Vertical (2020-2032) (USD Million)

11.5.1.9.2 Saudi Arabia Cash Flow Management Market Estimates and Forecasts, By Component (2020-2032) (USD Million)

11.5.1.9.3 Saudi Arabia Cash Flow Management Market Estimates and Forecasts, By Deployment (2020-2032) (USD Million)

11.5.1.9.4 Saudi Arabia Cash Flow Management Market Estimates and Forecasts,  By End-User (2020-2032) (USD Million)

11.5.1.10 Qatar

11.5.1.10.1 Qatar Cash Flow Management Market Estimates and Forecasts, By Vertical (2020-2032) (USD Million)

11.5.1.10.2 Qatar Cash Flow Management Market Estimates and Forecasts, By Component (2020-2032) (USD Million)

11.5.1.10.3 Qatar Cash Flow Management Market Estimates and Forecasts, By Deployment (2020-2032) (USD Million)

11.5.1.10.4 Qatar Cash Flow Management Market Estimates and Forecasts,  By End-User (2020-2032) (USD Million)

11.5.1.11 Rest of Middle East

11.5.1.11.1 Rest of Middle East Cash Flow Management Market Estimates and Forecasts, By Vertical (2020-2032) (USD Million)

11.5.1.11.2 Rest of Middle East Cash Flow Management Market Estimates and Forecasts, By Component (2020-2032) (USD Million)

11.5.1.11.3 Rest of Middle East Cash Flow Management Market Estimates and Forecasts, By Deployment (2020-2032) (USD Million)

11.5.1.11.4 Rest of Middle East Cash Flow Management Market Estimates and Forecasts,  By End-User (2020-2032) (USD Million)

11.5.2 Africa

11.5.2.1 Trends Analysis

11.5.2.2 Africa Cash Flow Management Market Estimates and Forecasts, by Country (2020-2032) (USD Million)

11.5.2.3 Africa Cash Flow Management Market Estimates and Forecasts, By Vertical (2020-2032) (USD Million) 

11.5.2.4 Africa Cash Flow Management Market Estimates and Forecasts, By Component (2020-2032) (USD Million)

11.5.2.5 Africa Cash Flow Management Market Estimates and Forecasts, By Deployment (2020-2032) (USD Million)

11.5.2.6 Africa Cash Flow Management Market Estimates and Forecasts,  By End-User (2020-2032) (USD Million)

11.5.2.7 South Africa

11.5.2.7.1 South Africa Cash Flow Management Market Estimates and Forecasts, By Vertical (2020-2032) (USD Million)

11.5.2.7.2 South Africa Cash Flow Management Market Estimates and Forecasts, By Component (2020-2032) (USD Million)

11.5.2.7.3 South Africa Cash Flow Management Market Estimates and Forecasts, By Deployment (2020-2032) (USD Million)

11.5.2.7.4 South Africa Cash Flow Management Market Estimates and Forecasts,  By End-User (2020-2032) (USD Million)

11.5.2.8 Nigeria

11.5.2.8.1 Nigeria Cash Flow Management Market Estimates and Forecasts, By Vertical (2020-2032) (USD Million)

11.5.2.8.2 Nigeria Cash Flow Management Market Estimates and Forecasts, By Component (2020-2032) (USD Million)

11.5.2.8.3 Nigeria Cash Flow Management Market Estimates and Forecasts, By Deployment (2020-2032) (USD Million)

11.5.2.8.4 Nigeria Cash Flow Management Market Estimates and Forecasts,  By End-User (2020-2032) (USD Million)

11.5.2.9 Rest of Africa

11.5.2.9.1 Rest of Africa Cash Flow Management Market Estimates and Forecasts, By Vertical (2020-2032) (USD Million)

11.5.2.9.2 Rest of Africa Cash Flow Management Market Estimates and Forecasts, By Component (2020-2032) (USD Million)

11.5.2.9.3 Rest of Africa Cash Flow Management Market Estimates and Forecasts, By Deployment (2020-2032) (USD Million)

11.5.2.9.4 Rest of Africa Cash Flow Management Market Estimates and Forecasts,  By End-User (2020-2032) (USD Million)

11.6 Latin America

11.6.1 Trends Analysis

11.6.2 Latin America Cash Flow Management Market Estimates and Forecasts, by Country (2020-2032) (USD Million)

11.6.3 Latin America Cash Flow Management Market Estimates and Forecasts, By Vertical (2020-2032) (USD Million) 

11.6.4 Latin America Cash Flow Management Market Estimates and Forecasts, By Component (2020-2032) (USD Million)

11.6.5 Latin America Cash Flow Management Market Estimates and Forecasts, By Deployment (2020-2032) (USD Million)

11.6.6 Latin America Cash Flow Management Market Estimates and Forecasts,  By End-User (2020-2032) (USD Million)

11.6.7 Brazil

11.6.7.1 Brazil Cash Flow Management Market Estimates and Forecasts, By Vertical (2020-2032) (USD Million)

11.6.7.2 Brazil Cash Flow Management Market Estimates and Forecasts, By Component (2020-2032) (USD Million)

11.6.7.3 Brazil Cash Flow Management Market Estimates and Forecasts, By Deployment (2020-2032) (USD Million)

11.6.7.4 Brazil Cash Flow Management Market Estimates and Forecasts,  By End-User (2020-2032) (USD Million)

11.6.8 Argentina

11.6.8.1 Argentina Cash Flow Management Market Estimates and Forecasts, By Vertical (2020-2032) (USD Million)

11.6.8.2 Argentina Cash Flow Management Market Estimates and Forecasts, By Component (2020-2032) (USD Million)

11.6.8.3 Argentina Cash Flow Management Market Estimates and Forecasts, By Deployment (2020-2032) (USD Million)

11.6.8.4 Argentina Cash Flow Management Market Estimates and Forecasts,  By End-User (2020-2032) (USD Million)

11.6.9 Colombia

11.6.9.1 Colombia Cash Flow Management Market Estimates and Forecasts, By Vertical (2020-2032) (USD Million)

11.6.9.2 Colombia Cash Flow Management Market Estimates and Forecasts, By Component (2020-2032) (USD Million)

11.6.9.3 Colombia Cash Flow Management Market Estimates and Forecasts, By Deployment (2020-2032) (USD Million)

11.6.9.4 Colombia Cash Flow Management Market Estimates and Forecasts,  By End-User (2020-2032) (USD Million)

11.6.10 Rest of Latin America

11.6.10.1 Rest of Latin America Cash Flow Management Market Estimates and Forecasts, By Vertical (2020-2032) (USD Million)

11.6.10.2 Rest of Latin America Cash Flow Management Market Estimates and Forecasts, By Component (2020-2032) (USD Million)

11.6.10.3 Rest of Latin America Cash Flow Management Market Estimates and Forecasts, By Deployment (2020-2032) (USD Million)

11.6.10.4 Rest of Latin America Cash Flow Management Market Estimates and Forecasts,  By End-User (2020-2032) (USD Million)

12. Company Profiles

12.1 Intuit

12.1.1 Company Overview

12.1.2 Financial

12.1.3 Products/ Services Offered

12.1.4 SWOT Analysis

12.2 Xero

12.2.1 Company Overview

12.2.2 Financial

12.2.3 Products/ Services Offered

12.2.4 SWOT Analysis

12.3 Anaplan

12.3.1 Company Overview

12.3.2 Financial

12.3.3 Products/ Services Offered

12.3.4 SWOT Analysis

12.4 Sage

12.4.1 Company Overview

12.4.2 Financial

12.4.3 Products/ Services Offered

12.4.4 SWOT Analysis

12.5 Float

12.5.1 Company Overview

12.5.2 Financial

12.5.3 Products/ Services Offered

12.5.4 SWOT Analysis

12.6 Planguru

12.6.1 Company Overview

12.6.2 Financial

12.6.3 Products/ Services Offered

12.6.4 SWOT Analysis

12.7 Dryrun

12.7.1 Company Overview

12.7.2 Financial

12.7.3 Products/ Services Offered

12.7.4 SWOT Analysis

12.8 Caflou

12.8.1 Company Overview

12.8.2 Financial

12.8.3 Products/ Services Offered

12.8.4 SWOT Analysis

12.9 Pulse

12.9.1 Company Overview

12.9.2 Financial

12.9.3 Products/ Services Offered

12.9.4 SWOT Analysis

12.10 Cash Analytics

12.10.1 Company Overview

12.10.2 Financial

12.10.3 Products/ Services Offered

12.10.4 SWOT Analysis

13. Use Cases and Best Practices

14. Conclusion

An accurate research report requires proper strategizing as well as implementation. There are multiple factors involved in the completion of good and accurate research report and selecting the best methodology to compete the research is the toughest part. Since the research reports we provide play a crucial role in any company’s decision-making process, therefore we at SNS Insider always believe that we should choose the best method which gives us results closer to reality. This allows us to reach at a stage wherein we can provide our clients best and accurate investment to output ratio.

Each report that we prepare takes a timeframe of 350-400 business hours for production. Starting from the selection of titles through a couple of in-depth brain storming session to the final QC process before uploading our titles on our website we dedicate around 350 working hours. The titles are selected based on their current market cap and the foreseen CAGR and growth.


The 5 steps process:

Step 1: Secondary Research:

Secondary Research or Desk Research is as the name suggests is a research process wherein, we collect data through the readily available information. In this process we use various paid and unpaid databases which our team has access to and gather data through the same. This includes examining of listed companies’ annual reports, Journals, SEC filling etc. Apart from this our team has access to various associations across the globe across different industries. Lastly, we have exchange relationships with various university as well as individual libraries.

Secondary Research

Step 2: Primary Research

When we talk about primary research, it is a type of study in which the researchers collect relevant data samples directly, rather than relying on previously collected data.  This type of research is focused on gaining content specific facts that can be sued to solve specific problems. Since the collected data is fresh and first hand therefore it makes the study more accurate and genuine.

We at SNS Insider have divided Primary Research into 2 parts.

Part 1 wherein we interview the KOLs of major players as well as the upcoming ones across various geographic regions. This allows us to have their view over the market scenario and acts as an important tool to come closer to the accurate market numbers. As many as 45 paid and unpaid primary interviews are taken from both the demand and supply side of the industry to make sure we land at an accurate judgement and analysis of the market.

This step involves the triangulation of data wherein our team analyses the interview transcripts, online survey responses and observation of on filed participants. The below mentioned chart should give a better understanding of the part 1 of the primary interview.

Primary Research

Part 2: In this part of primary research the data collected via secondary research and the part 1 of the primary research is validated with the interviews from individual consultants and subject matter experts.

Consultants are those set of people who have at least 12 years of experience and expertise within the industry whereas Subject Matter Experts are those with at least 15 years of experience behind their back within the same space. The data with the help of two main processes i.e., FGDs (Focused Group Discussions) and IDs (Individual Discussions). This gives us a 3rd party nonbiased primary view of the market scenario making it a more dependable one while collation of the data pointers.

Step 3: Data Bank Validation

Once all the information is collected via primary and secondary sources, we run that information for data validation. At our intelligence centre our research heads track a lot of information related to the market which includes the quarterly reports, the daily stock prices, and other relevant information. Our data bank server gets updated every fortnight and that is how the information which we collected using our primary and secondary information is revalidated in real time.

Data Bank Validation

Step 4: QA/QC Process

After all the data collection and validation our team does a final level of quality check and quality assurance to get rid of any unwanted or undesired mistakes. This might include but not limited to getting rid of the any typos, duplication of numbers or missing of any important information. The people involved in this process include technical content writers, research heads and graphics people. Once this process is completed the title gets uploader on our platform for our clients to read it.

Step 5: Final QC/QA Process:

This is the last process and comes when the client has ordered the study. In this process a final QA/QC is done before the study is emailed to the client. Since we believe in giving our clients a good experience of our research studies, therefore, to make sure that we do not lack at our end in any way humanly possible we do a final round of quality check and then dispatch the study to the client.

Key Segments:

By Component

  • Solution

  • Services 

By Deployment Mode

  • Cloud Based

  • On-Premise

By End-User

  • SME’s

  • Professionals

By Vertical

  • BFSI

  • IT & Telecom

  • Media

  • Entertainment

  • Healthcare

  • Retail

  • Manufacturing

  • Government

  • Others

Request for Segment Customization as per your Business Requirement: Segment Customization Request

Regional Coverage:

North America

  • US

  • Canada

  • Mexico

Europe

  • Eastern Europe

    • Poland

    • Romania

    • Hungary

    • Turkey

    • Rest of Eastern Europe

  • Western Europe

    • Germany

    • France

    • UK

    • Italy

    • Spain

    • Netherlands

    • Switzerland

    • Austria

    • Rest of Western Europe

Asia Pacific

  • China

  • India

  • Japan

  • South Korea

  • Vietnam

  • Singapore

  • Australia

  • Rest of Asia Pacific

Middle East & Africa

  • Middle East

    • UAE

    • Egypt

    • Saudi Arabia

    • Qatar

    • Rest of Middle East

  • Africa

    • Nigeria

    • South Africa

    • Rest of Africa

Latin America

  • Brazil

  • Argentina

  • Colombia

  • Rest of Latin America

Request for Country Level Research Report: Country Level Customization Request

Available Customization

With the given market data, SNS Insider offers customization as per the company’s specific needs. The following customization options are available for the report:

  • Detailed Volume Analysis

  • Criss-Cross segment analysis (e.g. Product X Application)

  • Competitive Product Benchmarking

  • Geographic Analysis

  • Additional countries in any of the regions

  • Customized Data Representation

  • Detailed analysis and profiling of additional market players


  •            5000 (33% Discount)


  •            8950 (40% Discount)


  •            3050 (23% Discount)

Start a Conversation

Hi! Click one of our member below to chat on Phone