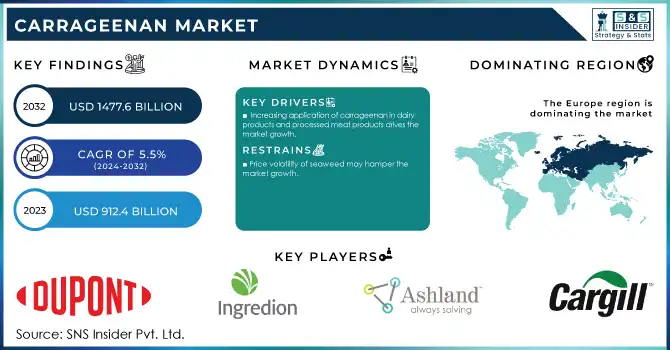
The Carrageenan Market size was USD 912.4 Million in 2023 and is expected to reach USD 1477.6 Million by 2032 and grow at a CAGR of 5.5% over the forecast period of 2024-2032.
Get E-PDF Sample Report on Carrageenan Market - Request Sample Report
The growing consumer influence for natural and clean-label ingredients is the key driver for the global carrageenan market. Today's consumers tend to be more health-conscious and look for food made from natural and minimally processed ingredients that contribute to their health and wellness goals. And carrageenan, a natural, plant-based ingredient from red seaweed, perfectly meets this demand. It does so because of its capacity to act as a stabilizer, thickener, and a gelling agent when no synthetic additives are required. It is gaining the favor of many manufacturers making all efforts to meet the clean-label standards. Moreover, the rise of food standards and protocols encouraging food label transparency and the implementation of sustainable and organic ingredients have spurred its use in expected applications like dairy and plant-based beverages, as well as in highly processed utilities like processed meats and desserts. Such a change towards clean-label formulations emphasizes the need for plant-based hydrocolloids, such as carrageenan, in order to meet changing consumer behavior.
For instance, the U.S. Food and Drug Administration (FDA) has updated the criteria for foods labeled as "healthy," limiting added sugars, saturated fats, and sodium to ensure alignment with dietary recommendations.
The increasing vegan and vegetarian food trend have greatly enhanced the requirement of plant-derived hydrocolloid carrageenan, extracted from red seaweed. As interest in plant-based lifestyles continues to grow, driven by health, environmental, and ethical concerns, the demand for alternatives to animal materials has also increased. An optimal solution has arisen in the form of carrageenan, a widely-utilized ingredient in both vegan & vegetarian products boasting natural thickening, stabilizing, & gelling properties. It is also an ingredient of plant-based milk, vegan cheeses, dairy-free yogurt, and meat alternatives, thereby giving food items the desired texture and amount of consistency without sacrificing propensity quality. Because of its natural origin and ability to meet clean-label trends, it is a go-to for manufacturers targeting the growing global vegan and vegetarian markets.
In Australia, a 2021 survey found that 5% of respondents identified as vegetarian and 2% as vegan. Notably, 55% of those following a vegan or vegetarian diet had adopted it within the preceding five years.
Drivers
Increasing application of carrageenan in dairy products and processed meat products drives the market growth.
One of the major driving factors of the market is the rising usage of carrageenan in dairy product & processed meat products. Carrageenan is most commonly used in dairy products, where it is added as a stabilizer and thickener in chocolate milk, cream, yogurt, and other dairy desserts. The ingredient allows the product texture to be more stable, avoids the separation of all the ingredients, and increases the overall shelf life of the product. Likewise, carrageenan is used in processed meat products to improve water binding, juiciness, and firm texture. Its water-binding and gelling properties make it highly valuable in items such as sausages, hams, and deli meats. The use of carrageenan in these applications has increased due to the growth of accelerating demand for convenience foods and high-quality products from consumers to drive demand for the market. Further, the expressive natural, and clean-label nature suits changing consumer preferences, enhancing its adoption in food formulations.
In April 2022, Bang & Bonsomer, based in Finland, acquired all shares of Eurogum A/S (Denmark) and Eurogum Polska Sp Zoo (Poland). Eurogum specializes in the production of carrageenan and alginate for the food industry.
Restraint
Price volatility of seaweed may hamper the market growth.
Price fluctuation of seaweed is one of the crucial restraining factors for global carrageenan market growth. As carrageenan is sourced from red seaweed, any variations in the supply and price of seaweed, automatically impact the production costs of carrageenan. Weather conditions, natural disasters, and over-harvesting all create uncertainty around seaweed supply. Furthermore, the price volatility can be raised by the variations in the farming practice of seaweed and the amount harvested by specific region. The volatility of these raw material costs, may lead to increased production costs for carrageenan, leading to higher prices where carrageenan is an ingredient in the products. Manufacturers might have to bear these expenses, which could lead to lower profits, or raise the prices they charge to consumers, which could hurt demand for products containing carrageenan (especially in low-margin markets).
By Product Type
The Kappa segment held the largest market share around 65% in 2023. It is owing to significant application across the food and beverage industry coupled with high demand. Kappa carrageenan is prized for its gelling ability and is commonly used in several products including dairy desserts, puddings, and jams. In meat products, it is also used to provide texture and help bind water. The excellent gel strength of kappa carrageenan makes it the first choice of many manufacturers when formulating for consistency. This property of forming stable gels with low concentrations and being compatible with other ingredients has led to its leading position in the market. At the same time, its status as a natural and clean-label product meets increased consumer interest in health-promoting minimally processed foods. All these factors contribute to the largest market share of kappa carrageenan, thus establishing it as a leading variant of the market of carrageenan.
By Processing Technology
The semi-refined carrageenan segment held the largest market share around 48% in 2023. It is owing to its low price and wide application scope. Manufacturers looking to satisfy consumer demand for natural, clean-label products have turned to semi-refined carrageenan, which is less processed than fully refined carrageenan and thus contains more of its natural components. This type of carrageenan is frequently found in dairy, non-dairy drinks, and processed meats, where it acts as a thickener, stabilizer, and gelling agent. It displays great gell properties and texture at a lower price than carrageenan fully refined, which is why this type of carrageenan is used in industries with lower budgets. Moreover, shifting preference towards the natural ingredient in food products also propels the demand for semi-refined carrageenan which is viewed as eco-friendlier and closer to natural form.
By Function
Thickening agents held the largest market share around 35% in 2023. This is due to their significant functional contribution to a variety of industrial applications, especially in food and beverage. Carrageenan is a common thickener due to its property of enhancing a product's viscosity without changing the taste or appearance of the liquid-based product. In the food industry, it’s worth is especially high in sauces, soups, dairy products, and beverages where the right texture and consistency is an important aspect of the product. The gelation and smooth, creamy textural properties of carrageenan render it attractive for many applications including dairy desserts, non-dairy beverages, and plant-based alternatives. Its versatility in use and efficiency at low concentrations also make it an economical option for manufacturers
By Application
Food & Beverage held the largest market share around 65% in 2023. It is used in food and beverage products, carrageenan effectively functions as a thickener, gelling agent, stabilizer, and emulsifier. Frequently used in ice cream, yogurt, and dairy-based goods, it improves a product's texture, keeps ingredients from separating, and enhances shelf life. In processed meats, plant-based substitutes, sauces, soups, and drinks for example, carrageenan is an important texturizing agent that functions to improve body and mouthfeel. Carrageenan is a natural ingredient derived from seaweed and is best suited to meet these consumer demands for clean-label, natural ingredients. Due to its high-quality texture and economic value, it has become a favored food manufacturing option.
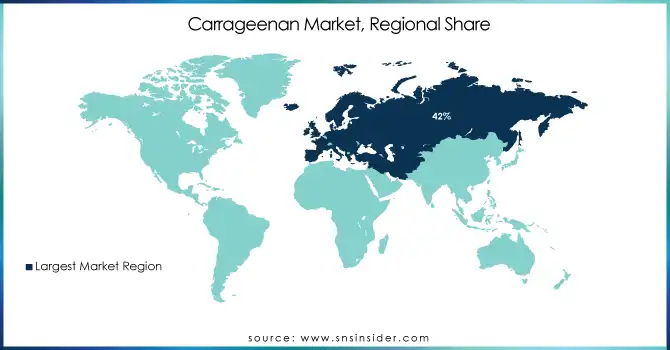
Europe held the largest market share around 42% in 2023. This is due to increased consumption of high functionality in food and beverage industries, pharmaceutical, and cosmetic products in the region, owing to the clean-label and natural product trend. In the European market, carrageenan, a gelling, thickening, and stabilizing agent, is one of the most widely used ingredients in the food and beverage industry, made with a well-established, modern industry in place, covering retail products like dairy, meat, sauces and plant-based foods. In addition, Europe sets very high regulatory standards so the increasing emphasis on natural and safe ingredients has led to an increase in the demand for carrageenan as a preferred food additive. Its market position is also bolstered by the regional growth of plant-based food that needs carrageenan for texture and consistency. Apart from food applications, it is also used in pharmaceuticals and personal care products across Europe, thus increasing its revenue-generation potential. Consequently, the regional market is expected to grow, owing to the increasing preference of manufacturers in Europe for carrageenan (renewable and biodegradable product), as the consumers are very much aware of sustainability.
Get Customized Report as Per Your Business Requirement - Request For Customized Report
Key Players
DuPont (Genencare, Cholecalciferol)
Ingredion Incorporated (Clearblend, Viscosity Control)
Ashland (Keltrol, Polysaccharides)
CP Kelco U.S., Inc. (Gellan Gum, Keltrol)
Cargill, Inc. (Stabilizer, Texturizing Agent)
Ceamsa (Kappa, Iota Carrageenan)
W Hydrocolloids, Inc. (LBG, Seaweed Extracts)
Gelymar (CarraLact VPD, CarraLact VFL)
Caldic B.V. (Gellan Gum, Alginate)
Ina Food Industry Co. Ltd. (Carrageenan Powder, Gel)
PT. Gumindo Perkasa Industries (Semi-Refined Carrageenan, Refined Carrageenan)
TBK Manufacturing Corporation (TBK-20, TBK-25)
FMC Corporation (Alginate, Agar)
Marinochem (Marin Carrageenan, Seaweed Extracts)
Eurogum (Carrageenan, Seaweed Derivatives)
TIC Gums (Ticaloid, Ticaloid Ultra)
Gum Technology Corporation (Xanthan Gum, Guar Gum)
Neogalen (Natural Gels, Gelatin)
Hongmao (Kappa Carrageenan, Iota Carrageenan)
Seaweed Solutions (Seaweed Gel, Hydrosol Carrageenan)
Recent Development:
In 2023: DuPont expanded its range of natural and clean-label ingredients, introducing new bio-based ingredients derived from sustainable sources, which includes carrageenan as a component in its clean-label product offerings aimed at the food and beverage market.
In 2022: Ingredion introduced its line of Clearblend carrageenan products for use in plant-based food applications, responding to the growing demand for vegan and vegetarian alternatives in the food industry. These products focus on delivering excellent texture and mouthfeel.
| Report Attributes | Details |
| Market Size in 2023 | US$ 912.4 Mn |
| Market Size by 2032 | US$ 1477.6 Mn |
| CAGR | CAGR of 5.5% From 2024 to 2032 |
| Base Year | 2023 |
| Forecast Period | 2024-2032 |
| Historical Data | 2020-2022 |
| Report Scope & Coverage | Market Size, Segments Analysis, Competitive Landscape, Regional Analysis, DROC & SWOT Analysis, Forecast Outlook |
| Key Segments |
• By Processing Technology (Alcohol Precipitation, Gel Press, and Semi-refined) |
| Regional Analysis/Coverage | North America (US, Canada, Mexico), Europe (Eastern Europe [Poland, Romania, Hungary, Turkey, Rest of Eastern Europe] Western Europe] Germany, France, UK, Italy, Spain, Netherlands, Switzerland, Austria, Rest of Western Europe]), Asia Pacific (China, India, Japan, South Korea, Vietnam, Singapore, Australia, Rest of Asia Pacific), Middle East & Africa (Middle East [UAE, Egypt, Saudi Arabia, Qatar, Rest of Middle East], Africa [Nigeria, South Africa, Rest of Africa], Latin America (Brazil, Argentina, Colombia, Rest of Latin America) |
| Company Profiles | DuPont, Ingredion Incorporated, Ashland, CP Kelco U.S., Inc., Cargill, Inc., Ceamsa, W Hydrocolloids, Inc., Gelymar, Caldic B.V., Ina Food Industry Co. Ltd., PT. Gumindo Perkasa Industries, TBK Manufacturing Corporation, and other |
| Key Drivers | • Increasing application of carrageenan in dairy products and processed meat products drives the maret growth. • Shifting the focus of the population toward consuming vegan food products |
| Market Opportunities | • Increasing awareness regarding fitness and health among the population • Growing activities of product development by the key players |
The carrageenan market is expected to reach USD 1477.6 million in 2032.
The expected CAGR of the global Carrageenan Market during the forecast period is 5.5%.
The major key players are DuPont, Ingredion Incorporated, Ashland, CP Kelco U.S., Inc., Cargill, Inc., Ceamsa, W Hydrocolloids, Inc., Gelymar, Caldic B.V., Ina Food Industry Co. Ltd., PT. Gumindo Perkasa Industries, TBK Manufacturing Corporation.
Europe contributes major to the Carrageenan Market.
Increasing application of carrageenan in dairy products and processed meat products, shifting the focus of the population toward consuming vegan food products, rising demand for natural food thickeners, increasing demand for hydrocolloids from various non-food industries are the major driving factors of carrageenan market.
Table of Contents:
1. Introduction
1.1 Market Definition
1.2 Scope (Inclusion and Exclusions)
1.3 Research Assumptions
2. Executive Summary
2.1 Market Overview
2.2 Regional Synopsis
2.3 Competitive Summary
3. Research Methodology
3.1 Top-Down Approach
3.2 Bottom-up Approach
3.3. Data Validation
3.4 Primary Interviews
4. Market Dynamics Impact Analysis
4.1 Market Driving Factors Analysis
4.1.1 Drivers
4.1.2 Restraints
4.1.3 Opportunities
4.1.4 Challenges
4.2 PESTLE Analysis
4.3 Porter’s Five Forces Model
5. Statistical Insights and Trends Reporting
5.1 By Production Capacity and Utilization, by Country, By Type, 2023
5.2 Feedstock Prices, by Country, By Type, 2023
5.3 Regulatory Impact, by l Country, By Type, 2023.
5.4 Environmental Metrics: Emissions Data, Waste Management Practices, and Sustainability Initiatives, by Region
5.5 Innovation and R&D, Type, 2023
6. Competitive Landscape
6.1 List of Major Companies, By Region
6.2 Market Share Analysis, By Region
6.3 Product Benchmarking
6.3.1 Product specifications and features
6.3.2 Pricing
6.4 Strategic Initiatives
6.4.1 Marketing and promotional activities
6.4.2 Distribution and supply chain strategies
6.4.3 Expansion plans and new product launches
6.4.4 Strategic partnerships and collaborations
6.5 Technological Advancements
6.6 Market Positioning and Branding
7. Carrageenan Market Segmentation, by Product Type
7.1 Chapter Overview
7.2 Kappa
7.2.1 Kappa Market Trends Analysis (2020-2032)
7.2.2 Kappa Market Size Estimates and Forecasts to 2032 (USD Million)
7.3 Iota
7.3.1 Iota Market Trends Analysis (2020-2032)
7.3.2 Iota Market Size Estimates and Forecasts to 2032 (USD Million)
7.4 Lambda
7.4.1 Lambda Market Trends Analysis (2020-2032)
7.4.2 Lambda Market Size Estimates and Forecasts to 2032 (USD Million)
8. Carrageenan Market Segmentation, By Processing Technology
8.1 Chapter Overview
8.2 Alcohol Precipitation
8.2.1 Alcohol Precipitation Market Trends Analysis (2020-2032)
8.2.2 Alcohol Precipitation Market Size Estimates and Forecasts to 2032 (USD Million)
8.3 Gel Press
8.3.1 Gel Press Market Trends Analysis (2020-2032)
8.3.2 Gel Press Market Size Estimates and Forecasts to 2032 (USD Million)
8.4 Semi-refined
8.4.1 Semi-refined Market Trends Analysis (2020-2032)
8.4.2 Semi-refined Market Size Estimates and Forecasts to 2032 (USD Million)
9. Carrageenan Market Segmentation, By Function
9.1 Chapter Overview
9.2 Thickening Agents
9.2.1 Thickening Agents Market Trends Analysis (2020-2032)
9.2.2 Thickening Agents Market Size Estimates and Forecasts to 2032 (USD Million)
9.3 Gelling Agents
9.3.1 Gelling Agents Market Trends Analysis (2020-2032)
9.3.2 Gelling Agents Market Size Estimates and Forecasts to 2032 (USD Million)
9.2 Stabilizers
9.2.1 Stabilizers Market Trends Analysis (2020-2032)
9.2.2 Stabilizers Market Size Estimates and Forecasts to 2032 (USD Million)
9.3 Others
9.3.1 Others Market Trends Analysis (2020-2032)
9.3.2 Others Market Size Estimates and Forecasts to 2032 (USD Million)
10. Carrageenan Market Segmentation, by Application
10.1 Chapter Overview
10.2 Food & Beverage
10.2.1 Food & Beverage Market Trends Analysis (2020-2032)
10.2.2 Food & Beverage Market Size Estimates and Forecasts to 2032 (USD Million)
10.3 Pharmaceutical
10.3.1 Pharmaceutical Market Trends Analysis (2020-2032)
10.3.2 Pharmaceutical Market Size Estimates and Forecasts to 2032 (USD Million)
10.4 Personal Care & Cosmetics
10.4.1 Personal Care & Cosmetics Market Trends Analysis (2020-2032)
10.4.2 Personal Care & Cosmetics Market Size Estimates and Forecasts to 2032 (USD Million)
10.5 Others
10.5. Others Market Trends Analysis (2020-2032)
10.5.2 Others Market Size Estimates and Forecasts to 2032 (USD Million)
11. Regional Analysis
11.1 Chapter Overview
11.2 North America
11.2.1 Trends Analysis
11.2.2 North America Carrageenan Market Estimates and Forecasts, by Country (2020-2032) (USD Million)
11.2.3 North America Carrageenan Market Estimates and Forecasts, by Product Type (2020-2032) (USD Million)
11.2.4 North America Carrageenan Market Estimates and Forecasts, By Processing Technology (2020-2032) (USD Million)
11.2.5 North America Carrageenan Market Estimates and Forecasts, By Function (2020-2032) (USD Million)
11.2.6 North America Carrageenan Market Estimates and Forecasts, by Application (2020-2032) (USD Million)
11.2.7 USA
11.2.7.1 USA Carrageenan Market Estimates and Forecasts, by Product Type (2020-2032) (USD Million)
11.2.7.2 USA Carrageenan Market Estimates and Forecasts, By Processing Technology (2020-2032) (USD Million)
11.2.7.3 USA Carrageenan Market Estimates and Forecasts, By Function (2020-2032) (USD Million)
11.2.7.4 USA Carrageenan Market Estimates and Forecasts, by Application (2020-2032) (USD Million)
11.2.8 Canada
11.2.8.1 Canada Carrageenan Market Estimates and Forecasts, by Product Type (2020-2032) (USD Million)
11.2.8.2 Canada Carrageenan Market Estimates and Forecasts, By Processing Technology (2020-2032) (USD Million)
11.2.8.3 Canada Carrageenan Market Estimates and Forecasts, By Function (2020-2032) (USD Million)
11.2.8.4 Canada Carrageenan Market Estimates and Forecasts, by Application (2020-2032) (USD Million)
11.2.9 Mexico
11.2.9.1 Mexico Carrageenan Market Estimates and Forecasts, by Product Type (2020-2032) (USD Million)
11.2.9.2 Mexico Carrageenan Market Estimates and Forecasts, By Processing Technology (2020-2032) (USD Million)
11.2.9.3 Mexico Carrageenan Market Estimates and Forecasts, By Function (2020-2032) (USD Million)
11.2.9.4 Mexico Carrageenan Market Estimates and Forecasts, by Application (2020-2032) (USD Million)
11.3 Europe
11.3.1 Eastern Europe
11.3.1.1 Trends Analysis
11.3.1.2 Eastern Europe Carrageenan Market Estimates and Forecasts, by Country (2020-2032) (USD Million)
11.3.1.3 Eastern Europe Carrageenan Market Estimates and Forecasts, by Product Type (2020-2032) (USD Million)
11.3.1.4 Eastern Europe Carrageenan Market Estimates and Forecasts, By Processing Technology (2020-2032) (USD Million)
11.3.1.5 Eastern Europe Carrageenan Market Estimates and Forecasts, By Function (2020-2032) (USD Million)
11.3.1.6 Eastern Europe Carrageenan Market Estimates and Forecasts, by Application (2020-2032) (USD Million)
11.3.1.7 Poland
11.3.1.7.1 Poland Carrageenan Market Estimates and Forecasts, by Product Type (2020-2032) (USD Million)
11.3.1.7.2 Poland Carrageenan Market Estimates and Forecasts, By Processing Technology (2020-2032) (USD Million)
11.3.1.7.3 Poland Carrageenan Market Estimates and Forecasts, By Function (2020-2032) (USD Million)
11.3.1.7.4 Poland Carrageenan Market Estimates and Forecasts, by Application (2020-2032) (USD Million)
11.3.1.8 Romania
11.3.1.8.1 Romania Carrageenan Market Estimates and Forecasts, by Product Type (2020-2032) (USD Million)
11.3.1.8.2 Romania Carrageenan Market Estimates and Forecasts, By Processing Technology (2020-2032) (USD Million)
11.3.1.8.3 Romania Carrageenan Market Estimates and Forecasts, By Function (2020-2032) (USD Million)
11.3.1.8.4 Romania Carrageenan Market Estimates and Forecasts, by Application (2020-2032) (USD Million)
11.3.1.9 Hungary
11.3.1.9.1 Hungary Carrageenan Market Estimates and Forecasts, by Product Type (2020-2032) (USD Million)
11.3.1.9.2 Hungary Carrageenan Market Estimates and Forecasts, By Processing Technology (2020-2032) (USD Million)
11.3.1.9.3 Hungary Carrageenan Market Estimates and Forecasts, By Function (2020-2032) (USD Million)
11.3.1.9.4 Hungary Carrageenan Market Estimates and Forecasts, by Application (2020-2032) (USD Million)
11.3.1.10 Turkey
11.3.1.10.1 Turkey Carrageenan Market Estimates and Forecasts, by Product Type (2020-2032) (USD Million)
11.3.1.10.2 Turkey Carrageenan Market Estimates and Forecasts, By Processing Technology (2020-2032) (USD Million)
11.3.1.10.3 Turkey Carrageenan Market Estimates and Forecasts, By Function (2020-2032) (USD Million)
11.3.1.10.4 Turkey Carrageenan Market Estimates and Forecasts, by Application (2020-2032) (USD Million)
11.3.1.11 Rest of Eastern Europe
11.3.1.11.1 Rest of Eastern Europe Carrageenan Market Estimates and Forecasts, by Product Type (2020-2032) (USD Million)
11.3.1.11.2 Rest of Eastern Europe Carrageenan Market Estimates and Forecasts, By Processing Technology (2020-2032) (USD Million)
11.3.1.11.3 Rest of Eastern Europe Carrageenan Market Estimates and Forecasts, By Function (2020-2032) (USD Million)
11.3.1.11.4 Rest of Eastern Europe Carrageenan Market Estimates and Forecasts, by Application (2020-2032) (USD Million)
11.3.2 Western Europe
11.3.2.1 Trends Analysis
11.3.2.2 Western Europe Carrageenan Market Estimates and Forecasts, by Country (2020-2032) (USD Million)
11.3.2.3 Western Europe Carrageenan Market Estimates and Forecasts, by Product Type (2020-2032) (USD Million)
11.3.2.4 Western Europe Carrageenan Market Estimates and Forecasts, By Processing Technology (2020-2032) (USD Million)
11.3.2.5 Western Europe Carrageenan Market Estimates and Forecasts, By Function (2020-2032) (USD Million)
11.3.2.6 Western Europe Carrageenan Market Estimates and Forecasts, by Application (2020-2032) (USD Million)
11.3.2.7 Germany
11.3.2.7.1 Germany Carrageenan Market Estimates and Forecasts, by Product Type (2020-2032) (USD Million)
11.3.2.7.2 Germany Carrageenan Market Estimates and Forecasts, By Processing Technology (2020-2032) (USD Million)
11.3.2.7.3 Germany Carrageenan Market Estimates and Forecasts, By Function (2020-2032) (USD Million)
11.3.2.7.4 Germany Carrageenan Market Estimates and Forecasts, by Application (2020-2032) (USD Million)
11.3.2.8 France
11.3.2.8.1 France Carrageenan Market Estimates and Forecasts, by Product Type (2020-2032) (USD Million)
11.3.2.8.2 France Carrageenan Market Estimates and Forecasts, By Processing Technology (2020-2032) (USD Million)
11.3.2.8.3 France Carrageenan Market Estimates and Forecasts, By Function (2020-2032) (USD Million)
11.3.2.8.4 France Carrageenan Market Estimates and Forecasts, by Application (2020-2032) (USD Million)
11.3.2.9 UK
11.3.2.9.1 UK Carrageenan Market Estimates and Forecasts, by Product Type (2020-2032) (USD Million)
11.3.2.9.2 UK Carrageenan Market Estimates and Forecasts, By Processing Technology (2020-2032) (USD Million)
11.3.2.9.3 UK Carrageenan Market Estimates and Forecasts, By Function (2020-2032) (USD Million)
11.3.2.9.4 UK Carrageenan Market Estimates and Forecasts, by Application (2020-2032) (USD Million)
11.3.2.10 Italy
11.3.2.10.1 Italy Carrageenan Market Estimates and Forecasts, by Product Type (2020-2032) (USD Million)
11.3.2.10.2 Italy Carrageenan Market Estimates and Forecasts, By Processing Technology (2020-2032) (USD Million)
11.3.2.10.3 Italy Carrageenan Market Estimates and Forecasts, By Function (2020-2032) (USD Million)
11.3.2.10.4 Italy Carrageenan Market Estimates and Forecasts, by Application (2020-2032) (USD Million)
11.3.2.11 Spain
11.3.2.11.1 Spain Carrageenan Market Estimates and Forecasts, by Product Type (2020-2032) (USD Million)
11.3.2.11.2 Spain Carrageenan Market Estimates and Forecasts, By Processing Technology (2020-2032) (USD Million)
11.3.2.11.3 Spain Carrageenan Market Estimates and Forecasts, By Function (2020-2032) (USD Million)
11.3.2.11.4 Spain Carrageenan Market Estimates and Forecasts, by Application (2020-2032) (USD Million)
11.3.2.12 Netherlands
11.3.2.12.1 Netherlands Carrageenan Market Estimates and Forecasts, by Product Type (2020-2032) (USD Million)
11.3.2.12.2 Netherlands Carrageenan Market Estimates and Forecasts, By Processing Technology (2020-2032) (USD Million)
11.3.2.12.3 Netherlands Carrageenan Market Estimates and Forecasts, By Function (2020-2032) (USD Million)
11.3.2.12.4 Netherlands Carrageenan Market Estimates and Forecasts, by Application (2020-2032) (USD Million)
11.3.2.13 Switzerland
11.3.2.13.1 Switzerland Carrageenan Market Estimates and Forecasts, by Product Type (2020-2032) (USD Million)
11.3.2.13.2 Switzerland Carrageenan Market Estimates and Forecasts, By Processing Technology (2020-2032) (USD Million)
11.3.2.13.3 Switzerland Carrageenan Market Estimates and Forecasts, By Function (2020-2032) (USD Million)
11.3.2.13.4 Switzerland Carrageenan Market Estimates and Forecasts, by Application (2020-2032) (USD Million)
11.3.2.14 Austria
11.3.2.14.1 Austria Carrageenan Market Estimates and Forecasts, by Product Type (2020-2032) (USD Million)
11.3.2.14.2 Austria Carrageenan Market Estimates and Forecasts, By Processing Technology (2020-2032) (USD Million)
11.3.2.14.3 Austria Carrageenan Market Estimates and Forecasts, By Function (2020-2032) (USD Million)
11.3.2.14.4 Austria Carrageenan Market Estimates and Forecasts, by Application (2020-2032) (USD Million)
11.3.2.15 Rest of Western Europe
11.3.2.15.1 Rest of Western Europe Carrageenan Market Estimates and Forecasts, by Product Type (2020-2032) (USD Million)
11.3.2.15.2 Rest of Western Europe Carrageenan Market Estimates and Forecasts, By Processing Technology (2020-2032) (USD Million)
11.3.2.15.3 Rest of Western Europe Carrageenan Market Estimates and Forecasts, By Function (2020-2032) (USD Million)
11.3.2.15.4 Rest of Western Europe Carrageenan Market Estimates and Forecasts, by Application (2020-2032) (USD Million)
11.4 Asia-Pacific
11.4.1 Trends Analysis
11.4.2 Asia-Pacific Carrageenan Market Estimates and Forecasts, by Country (2020-2032) (USD Million)
11.4.3 Asia-Pacific Carrageenan Market Estimates and Forecasts, by Product Type (2020-2032) (USD Million)
11.4.4 Asia-Pacific Carrageenan Market Estimates and Forecasts, By Processing Technology (2020-2032) (USD Million)
11.4.5 Asia-Pacific Carrageenan Market Estimates and Forecasts, By Function (2020-2032) (USD Million)
11.4.6 Asia-Pacific Carrageenan Market Estimates and Forecasts, by Application (2020-2032) (USD Million)
11.4.7 China
11.4.7.1 China Carrageenan Market Estimates and Forecasts, by Product Type (2020-2032) (USD Million)
11.4.7.2 China Carrageenan Market Estimates and Forecasts, By Processing Technology (2020-2032) (USD Million)
11.4.7.3 China Carrageenan Market Estimates and Forecasts, By Function (2020-2032) (USD Million)
11.4.7.4 China Carrageenan Market Estimates and Forecasts, by Application (2020-2032) (USD Million)
11.4.8 India
11.4.8.1 India Carrageenan Market Estimates and Forecasts, by Product Type (2020-2032) (USD Million)
11.4.8.2 India Carrageenan Market Estimates and Forecasts, By Processing Technology (2020-2032) (USD Million)
11.4.8.3 India Carrageenan Market Estimates and Forecasts, By Function (2020-2032) (USD Million)
11.4.8.4 India Carrageenan Market Estimates and Forecasts, by Application (2020-2032) (USD Million)
11.4.9 Japan
11.4.9.1 Japan Carrageenan Market Estimates and Forecasts, by Product Type (2020-2032) (USD Million)
11.4.9.2 Japan Carrageenan Market Estimates and Forecasts, By Processing Technology (2020-2032) (USD Million)
11.4.9.3 Japan Carrageenan Market Estimates and Forecasts, By Function (2020-2032) (USD Million)
11.4.9.4 Japan Carrageenan Market Estimates and Forecasts, by Application (2020-2032) (USD Million)
11.4.10 South Korea
11.4.10.1 South Korea Carrageenan Market Estimates and Forecasts, by Product Type (2020-2032) (USD Million)
11.4.10.2 South Korea Carrageenan Market Estimates and Forecasts, By Processing Technology (2020-2032) (USD Million)
11.4.10.3 South Korea Carrageenan Market Estimates and Forecasts, By Function (2020-2032) (USD Million)
11.4.10.4 South Korea Carrageenan Market Estimates and Forecasts, by Application (2020-2032) (USD Million)
11.4.11 Vietnam
11.4.11.1 Vietnam Carrageenan Market Estimates and Forecasts, by Product Type (2020-2032) (USD Million)
11.4.11.2 Vietnam Carrageenan Market Estimates and Forecasts, By Processing Technology (2020-2032) (USD Million)
11.4.11.3 Vietnam Carrageenan Market Estimates and Forecasts, By Function (2020-2032) (USD Million)
11.4.11.4 Vietnam Carrageenan Market Estimates and Forecasts, by Application (2020-2032) (USD Million)
11.4.12 Singapore
11.4.12.1 Singapore Carrageenan Market Estimates and Forecasts, by Product Type (2020-2032) (USD Million)
11.4.12.2 Singapore Carrageenan Market Estimates and Forecasts, By Processing Technology (2020-2032) (USD Million)
11.4.12.3 Singapore Carrageenan Market Estimates and Forecasts, By Function (2020-2032) (USD Million)
11.4.12.4 Singapore Carrageenan Market Estimates and Forecasts, by Application (2020-2032) (USD Million)
11.4.13 Australia
11.4.13.1 Australia Carrageenan Market Estimates and Forecasts, by Product Type (2020-2032) (USD Million)
11.4.13.2 Australia Carrageenan Market Estimates and Forecasts, By Processing Technology (2020-2032) (USD Million)
11.4.13.3 Australia Carrageenan Market Estimates and Forecasts, By Function (2020-2032) (USD Million)
11.4.13.4 Australia Carrageenan Market Estimates and Forecasts, by Application (2020-2032) (USD Million)
11.4.14 Rest of Asia-Pacific
11.4.14.1 Rest of Asia-Pacific Carrageenan Market Estimates and Forecasts, by Product Type (2020-2032) (USD Million)
11.4.14.2 Rest of Asia-Pacific Carrageenan Market Estimates and Forecasts, By Processing Technology (2020-2032) (USD Million)
11.4.14.3 Rest of Asia-Pacific Carrageenan Market Estimates and Forecasts, By Function (2020-2032) (USD Million)
11.4.14.4 Rest of Asia-Pacific Carrageenan Market Estimates and Forecasts, by Application (2020-2032) (USD Million)
11.5 Middle East and Africa
11.5.1 Middle East
11.5.1.1 Trends Analysis
11.5.1.2 Middle East Carrageenan Market Estimates and Forecasts, by Country (2020-2032) (USD Million)
11.5.1.3 Middle East Carrageenan Market Estimates and Forecasts, by Product Type (2020-2032) (USD Million)
11.5.1.4 Middle East Carrageenan Market Estimates and Forecasts, By Processing Technology (2020-2032) (USD Million)
11.5.1.5 Middle East Carrageenan Market Estimates and Forecasts, By Function (2020-2032) (USD Million)
11.5.1.6 Middle East Carrageenan Market Estimates and Forecasts, by Application (2020-2032) (USD Million)
11.5.1.7 UAE
11.5.1.7.1 UAE Carrageenan Market Estimates and Forecasts, by Product Type (2020-2032) (USD Million)
11.5.1.7.2 UAE Carrageenan Market Estimates and Forecasts, By Processing Technology (2020-2032) (USD Million)
11.5.1.7.3 UAE Carrageenan Market Estimates and Forecasts, By Function (2020-2032) (USD Million)
11.5.1.7.4 UAE Carrageenan Market Estimates and Forecasts, by Application (2020-2032) (USD Million)
11.5.1.8 Egypt
11.5.1.8.1 Egypt Carrageenan Market Estimates and Forecasts, by Product Type (2020-2032) (USD Million)
11.5.1.8.2 Egypt Carrageenan Market Estimates and Forecasts, By Processing Technology (2020-2032) (USD Million)
11.5.1.8.3 Egypt Carrageenan Market Estimates and Forecasts, By Function (2020-2032) (USD Million)
11.5.1.8.4 Egypt Carrageenan Market Estimates and Forecasts, by Application (2020-2032) (USD Million)
11.5.1.9 Saudi Arabia
11.5.1.9.1 Saudi Arabia Carrageenan Market Estimates and Forecasts, by Product Type (2020-2032) (USD Million)
11.5.1.9.2 Saudi Arabia Carrageenan Market Estimates and Forecasts, By Processing Technology (2020-2032) (USD Million)
11.5.1.9.3 Saudi Arabia Carrageenan Market Estimates and Forecasts, By Function (2020-2032) (USD Million)
11.5.1.9.4 Saudi Arabia Carrageenan Market Estimates and Forecasts, by Application (2020-2032) (USD Million)
11.5.1.10 Qatar
11.5.1.10.1 Qatar Carrageenan Market Estimates and Forecasts, by Product Type (2020-2032) (USD Million)
11.5.1.10.2 Qatar Carrageenan Market Estimates and Forecasts, By Processing Technology (2020-2032) (USD Million)
11.5.1.10.3 Qatar Carrageenan Market Estimates and Forecasts, By Function (2020-2032) (USD Million)
11.5.1.10.4 Qatar Carrageenan Market Estimates and Forecasts, by Application (2020-2032) (USD Million)
11.5.1.11 Rest of Middle East
11.5.1.11.1 Rest of Middle East Carrageenan Market Estimates and Forecasts, by Product Type (2020-2032) (USD Million)
11.5.1.11.2 Rest of Middle East Carrageenan Market Estimates and Forecasts, By Processing Technology (2020-2032) (USD Million)
11.5.1.11.3 Rest of Middle East Carrageenan Market Estimates and Forecasts, By Function (2020-2032) (USD Million)
11.5.1.11.4 Rest of Middle East Carrageenan Market Estimates and Forecasts, by Application (2020-2032) (USD Million)
11.5.2 Africa
11.5.2.1 Trends Analysis
11.5.2.2 Africa Carrageenan Market Estimates and Forecasts, by Country (2020-2032) (USD Million)
11.5.2.3 Africa Carrageenan Market Estimates and Forecasts, by Product Type (2020-2032) (USD Million)
11.5.2.4 Africa Carrageenan Market Estimates and Forecasts, By Processing Technology (2020-2032) (USD Million)
11.5.2.5 Africa Carrageenan Market Estimates and Forecasts, By Function (2020-2032) (USD Million)
11.5.2.6 Africa Carrageenan Market Estimates and Forecasts, by Application (2020-2032) (USD Million)
11.5.2.7 South Africa
11.5.2.7.1 South Africa Carrageenan Market Estimates and Forecasts, by Product Type (2020-2032) (USD Million)
11.5.2.7.2 South Africa Carrageenan Market Estimates and Forecasts, By Processing Technology (2020-2032) (USD Million)
11.5.2.7.3 South Africa Carrageenan Market Estimates and Forecasts, By Function (2020-2032) (USD Million)
11.5.2.7.4 South Africa Carrageenan Market Estimates and Forecasts, by Application (2020-2032) (USD Million)
11.5.2.8 Nigeria
11.5.2.8.1 Nigeria Carrageenan Market Estimates and Forecasts, by Product Type (2020-2032) (USD Million)
11.5.2.8.2 Nigeria Carrageenan Market Estimates and Forecasts, By Processing Technology (2020-2032) (USD Million)
11.5.2.8.3 Nigeria Carrageenan Market Estimates and Forecasts, By Function (2020-2032) (USD Million)
11.5.2.8.4 Nigeria Carrageenan Market Estimates and Forecasts, by Application (2020-2032) (USD Million)
11.5.2.9 Rest of Africa
11.5.2.9.1 Rest of Africa Carrageenan Market Estimates and Forecasts, by Product Type (2020-2032) (USD Million)
11.5.2.9.2 Rest of Africa Carrageenan Market Estimates and Forecasts, By Processing Technology (2020-2032) (USD Million)
11.5.2.9.3 Rest of Africa Carrageenan Market Estimates and Forecasts, By Function (2020-2032) (USD Million)
11.5.2.9.4 Rest of Africa Carrageenan Market Estimates and Forecasts, by Application (2020-2032) (USD Million)
11.6 Latin America
11.6.1 Trends Analysis
11.6.2 Latin America Carrageenan Market Estimates and Forecasts, by Country (2020-2032) (USD Million)
11.6.3 Latin America Carrageenan Market Estimates and Forecasts, by Product Type (2020-2032) (USD Million)
11.6.4 Latin America Carrageenan Market Estimates and Forecasts, By Processing Technology (2020-2032) (USD Million)
11.6.5 Latin America Carrageenan Market Estimates and Forecasts, By Function (2020-2032) (USD Million)
11.6.6 Latin America Carrageenan Market Estimates and Forecasts, by Application (2020-2032) (USD Million)
11.6.7 Brazil
11.6.7.1 Brazil Carrageenan Market Estimates and Forecasts, by Product Type (2020-2032) (USD Million)
11.6.7.2 Brazil Carrageenan Market Estimates and Forecasts, By Processing Technology (2020-2032) (USD Million)
11.6.7.3 Brazil Carrageenan Market Estimates and Forecasts, By Function (2020-2032) (USD Million)
11.6.7.4 Brazil Carrageenan Market Estimates and Forecasts, by Application (2020-2032) (USD Million)
11.6.8 Argentina
11.6.8.1 Argentina Carrageenan Market Estimates and Forecasts, by Product Type (2020-2032) (USD Million)
11.6.8.2 Argentina Carrageenan Market Estimates and Forecasts, By Processing Technology (2020-2032) (USD Million)
11.6.8.3 Argentina Carrageenan Market Estimates and Forecasts, By Function (2020-2032) (USD Million)
11.6.8.4 Argentina Carrageenan Market Estimates and Forecasts, by Application (2020-2032) (USD Million)
11.6.9 Colombia
11.6.9.1 Colombia Carrageenan Market Estimates and Forecasts, by Product Type (2020-2032) (USD Million)
11.6.9.2 Colombia Carrageenan Market Estimates and Forecasts, By Processing Technology (2020-2032) (USD Million)
11.6.9.3 Colombia Carrageenan Market Estimates and Forecasts, By Function (2020-2032) (USD Million)
11.6.9.4 Colombia Carrageenan Market Estimates and Forecasts, by Application (2020-2032) (USD Million)
11.6.10 Rest of Latin America
11.6.10.1 Rest of Latin America Carrageenan Market Estimates and Forecasts, by Product Type (2020-2032) (USD Million)
11.6.10.2 Rest of Latin America Carrageenan Market Estimates and Forecasts, By Processing Technology (2020-2032) (USD Million)
11.6.10.3 Rest of Latin America Carrageenan Market Estimates and Forecasts, By Function (2020-2032) (USD Million)
11.6.10.4 Rest of Latin America Carrageenan Market Estimates and Forecasts, by Application (2020-2032) (USD Million)
12. Company Profiles
12.1 DuPont
12.1.1 Company Overview
12.1.2 Financial
12.1.3 Products/ Services Offered
12.1.4 SWOT Analysis
12.2 Ingredion Incorporated
12.2.1 Company Overview
12.2.2 Financial
12.2.3 Products/ Services Offered
12.2.4 SWOT Analysis
12.3 Ashland
12.3.1 Company Overview
12.3.2 Financial
12.3.3 Products/ Services Offered
12.3.4 SWOT Analysis
12.4 CP Kelco U.S., Inc.
12.4.1 Company Overview
12.4.2 Financial
12.4.3 Products/ Services Offered
12.4.4 SWOT Analysis
12.5 Cargill, Inc.
12.5.1 Company Overview
12.5.2 Financial
12.5.3 Products/ Services Offered
12.5.4 SWOT Analysis
12.6 Ceamsa
12.6.1 Company Overview
12.6.2 Financial
12.6.3 Products/ Services Offered
12.6.4 SWOT Analysis
12.7 W Hydrocolloids, Inc.
12.7.1 Company Overview
12.7.2 Financial
12.7.3 Products/ Services Offered
12.7.4 SWOT Analysis
12.8 Gelymar
12.8.1 Company Overview
12.8.2 Financial
12.8.3 Products/ Services Offered
12.8.4 SWOT Analysis
12.9 Caldic B.V.
12.9.1 Company Overview
12.9.2 Financial
12.9.3 Products/ Services Offered
12.9.4 SWOT Analysis
12.10 Ina Food Industry Co. Ltd.
12.10.1 Company Overview
12.10.2 Financial
12.10.3 Products/ Services Offered
12.10.4 SWOT Analysis
13. Use Cases and Best Practices
14. Conclusion
An accurate research report requires proper strategizing as well as implementation. There are multiple factors involved in the completion of good and accurate research report and selecting the best methodology to compete the research is the toughest part. Since the research reports we provide play a crucial role in any company’s decision-making process, therefore we at SNS Insider always believe that we should choose the best method which gives us results closer to reality. This allows us to reach at a stage wherein we can provide our clients best and accurate investment to output ratio.
Each report that we prepare takes a timeframe of 350-400 business hours for production. Starting from the selection of titles through a couple of in-depth brain storming session to the final QC process before uploading our titles on our website we dedicate around 350 working hours. The titles are selected based on their current market cap and the foreseen CAGR and growth.
The 5 steps process:
Step 1: Secondary Research:
Secondary Research or Desk Research is as the name suggests is a research process wherein, we collect data through the readily available information. In this process we use various paid and unpaid databases which our team has access to and gather data through the same. This includes examining of listed companies’ annual reports, Journals, SEC filling etc. Apart from this our team has access to various associations across the globe across different industries. Lastly, we have exchange relationships with various university as well as individual libraries.

Step 2: Primary Research
When we talk about primary research, it is a type of study in which the researchers collect relevant data samples directly, rather than relying on previously collected data. This type of research is focused on gaining content specific facts that can be sued to solve specific problems. Since the collected data is fresh and first hand therefore it makes the study more accurate and genuine.
We at SNS Insider have divided Primary Research into 2 parts.
Part 1 wherein we interview the KOLs of major players as well as the upcoming ones across various geographic regions. This allows us to have their view over the market scenario and acts as an important tool to come closer to the accurate market numbers. As many as 45 paid and unpaid primary interviews are taken from both the demand and supply side of the industry to make sure we land at an accurate judgement and analysis of the market.
This step involves the triangulation of data wherein our team analyses the interview transcripts, online survey responses and observation of on filed participants. The below mentioned chart should give a better understanding of the part 1 of the primary interview.

Part 2: In this part of primary research the data collected via secondary research and the part 1 of the primary research is validated with the interviews from individual consultants and subject matter experts.
Consultants are those set of people who have at least 12 years of experience and expertise within the industry whereas Subject Matter Experts are those with at least 15 years of experience behind their back within the same space. The data with the help of two main processes i.e., FGDs (Focused Group Discussions) and IDs (Individual Discussions). This gives us a 3rd party nonbiased primary view of the market scenario making it a more dependable one while collation of the data pointers.
Step 3: Data Bank Validation
Once all the information is collected via primary and secondary sources, we run that information for data validation. At our intelligence centre our research heads track a lot of information related to the market which includes the quarterly reports, the daily stock prices, and other relevant information. Our data bank server gets updated every fortnight and that is how the information which we collected using our primary and secondary information is revalidated in real time.

Step 4: QA/QC Process
After all the data collection and validation our team does a final level of quality check and quality assurance to get rid of any unwanted or undesired mistakes. This might include but not limited to getting rid of the any typos, duplication of numbers or missing of any important information. The people involved in this process include technical content writers, research heads and graphics people. Once this process is completed the title gets uploader on our platform for our clients to read it.
Step 5: Final QC/QA Process:
This is the last process and comes when the client has ordered the study. In this process a final QA/QC is done before the study is emailed to the client. Since we believe in giving our clients a good experience of our research studies, therefore, to make sure that we do not lack at our end in any way humanly possible we do a final round of quality check and then dispatch the study to the client.
Key Segments:
By Product Type
Kappa
Iota
Lambda
By Processing Technology
Alcohol Precipitation
Gel Press
Semi-refined
By Function
Thickening Agents
Gelling Agents
Stabilizers
Others
By Application
Food & Beverage
Pharmaceutical
Personal Care & Cosmetics
Others
Request for Segment Customization as per your Business Requirement: Segment Customization Request
Regional Coverage:
North America
US
Canada
Mexico
Europe
Eastern Europe
Poland
Romania
Hungary
Turkey
Rest of Eastern Europe
Western Europe
Germany
France
UK
Italy
Spain
Netherlands
Switzerland
Austria
Rest of Western Europe
Asia Pacific
China
India
Japan
South Korea
Vietnam
Singapore
Australia
Rest of Asia Pacific
Middle East & Africa
Middle East
UAE
Egypt
Saudi Arabia
Qatar
Rest of Middle East
Africa
Nigeria
South Africa
Rest of Africa
Latin America
Brazil
Argentina
Colombia
Rest of Latin America
Request for Country Level Research Report: Country Level Customization Request
Available Customization
With the given market data, SNS Insider offers customization as per the company’s specific needs. The following customization options are available for the report:
Product Analysis
Criss-Cross segment analysis (e.g. Product X Application)
Product Matrix which gives a detailed comparison of the product portfolio of each company
Geographic Analysis
Additional countries in any of the regions
Company Information
Detailed analysis and profiling of additional market players (Up to five)
The Recycled Textiles Market size was valued at USD 5.76 billion in 2023 and is expected to reach USD 8.69 billion by 2032, at a CAGR of 4.70% from 2024-2032.
Fluoropolymers Market size was estimated at USD 9.66 billion in 2023 and is expected to reach USD 16.20 billion by 2032 at a CAGR of 5.91% from 2024-2032.
Erosion and Sediment Control Market was USD 3.5 billion in 2023 and is expected to reach USD 5.9 billion by 2032, growing at a CAGR of 6.1% from 2024-2032.
Explore the Argan Oil Market, focusing on its use in cosmetics, personal care, and food industries. Learn about key trends, rising demand for natural ingredients, and how argan oil's skin, hair, and health benefits are driving its growth in the global mar
The Bio-Based Leather Market Size was valued at USD 110 million in 2023. It is projected to reach USD 380.9 million by 2032 and grow at a CAGR of 14.8% over the forecast period 2024-2032.
The Synthetic Rubber Market Size was valued at USD 33.70 Billion in 2023 and is expected to reach USD 51.39 Billion by 2032, growing at a CAGR of 4.80% over the forecast period of 2024-2032.

Hi! Click one of our member below to chat on Phone
© 2025 All Rights Reserved by SNS Insider Pvt Ltd


