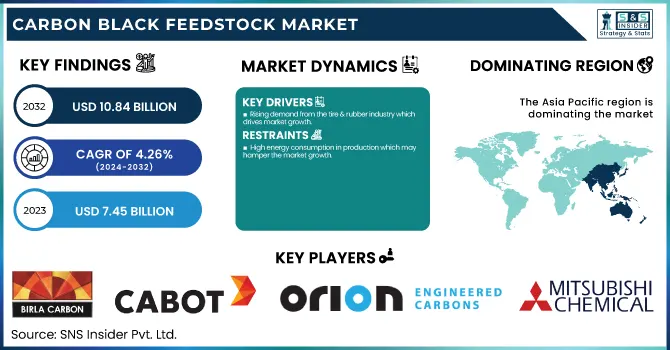
The Carbon Black Feedstock Market size was USD 7.45 Billion in 2023 and is expected to reach USD 10.84 Billion by 2032 and grow at a CAGR of 4.26% over the forecast period of 2024-2032. The report provides an in-depth analysis of production capacity and utilization across key regions, highlighting supply-demand dynamics in 2023. It examines feedstock price trends by type and region, offering insights into cost fluctuations and market volatility. The report assesses regulatory impacts, emission standards, and sustainability initiatives, focusing on compliance with environmental policies. Additionally, it explores supply chain disruptions, raw material availability, and geopolitical influences affecting feedstock sourcing. Advancements in refining technologies and process innovations are analyzed, showcasing efficiency improvements. The study also covers sustainability efforts, including circular economy developments and waste management practices. Overall, the report delivers a data-driven perspective on market trends, industry challenges, and future growth opportunities.
Drivers
Rising demand from the tire & rubber industry which drives market growth.
Carbon black is primarily used as a reinforcing agent in tire manufacturing and the increasing demand for tires from the automotive industry is expected to be a significant factor driving growth in the carbon black feedstock market. As the global automotive industry grows, car and commercial vehicle tire production rises and consequently drives the carbon black feedstock market. Furthermore, the growing vehicle ownership and road safety regulations, as well as rising consumer inclination for performance tires are some of the factors augmenting the replacement tire market. Tire-makers use carbon black feedstock in tires to increase durability and wear and to protect them from UV rays. In addition, the increasing need for synthetic and high-performance rubber components for use in industrial applications such as conveyor belts, hoses, and gaskets is also boosting the market growth. Alongside this, the trend towards more sustainable products is leading to the development of green carbon black feedstock from recycled materials and bio-based sources, which will also influence the market in the years to come.
Restraint
High energy consumption in production which may hamper the market growth.
Carbon black feedstock production is energy-intensive, which is one of the major factors impeding the growth of the market. The production process, especially using thermal decomposition or incomplete combustion of hydrocarbons, consumes a considerable amount of electricity and fuel. Increasing global energy costs and wind restrictions on emissions translate into higher costs of production for producers, making production less economical. Besides, the production of carbon black is characterized by greenhouse gas emissions, which put pressure on regulatory acts for a cleaner and more energy-efficient process. The focus on sustainable alternatives, such as recovered carbon black (rCB), in many industries is likely to exacerbate the challenge to demand for conventional feedstocks. Consequently, high energy consumption raises costs as well as hinders market growth based on environmental and economic factors.
Opportunity
Increasing investments in specialty carbon black create an opportunity in the market.
Specialty carbon black is increasingly in demand in various sectors such as coatings, plastics, electronics, and batteries, and thus capital investments in specialty carbon black manufacturing are on the rise. Specialty grades of carbon black have better conductivity, U.V. stability, and good dispersion properties than conventional carbon black, and therefore have better value and a well-suited for next-gen applications. Growing consumption of high-performance materials in applications such as automotive, aerospace & packaging is disproportionately driving the demand for specialized carbon black formulations. At the same time, increasing R&D investments to manufacture tailor-made, low-emission, and high-purity carbon black for various applications, are also creating substantial market opportunities. Within this growing segment, product innovation, sustainability, and expanded production capacity will provide formidable competitive moats. Moreover, the rise of low-VOC and green specialty carbon black in response to government-imposed statutory compliance is developing market growth.
Challenges
Lack of advanced recycling infrastructure may challenge the market growth.
The poor recycling infrastructure presents a challenge for the carbon black feedstock market growth as inefficient recycling technologies render slightly used rCBs unavailable for use as feedstock. Generally, coal tar, ethylene cracker tar, and FCC tar have been used as feedstock which resulted in high carbon emissions during the carbon black production process due to the fossil feeds-based nature of these processes. Although recycling out-of-service tires and carbon wastes from industrial processes may offer an environmentally friendly feedstock alternative, the lack of efficient collection systems, sophisticated pyrolysis technologies, and large-centralized processing plants hamper the large-scale utilization of rCB. Further, manufacturers are also deterred by regulatory uncertainties and the high initial capital investment required to establish advanced recycling plants to shift to sustainable feedstock sources. Without the required recycling infrastructure, the market’s capacity to achieve future sustainability targets may be hampered as businesses are being urged to decrease their carbon footprints and transition into a circular economy.
By Product
General Type held the largest market share around 38% in 2023. It is widely adopted in the manufacture of tires, rubber, plastics, coatings, and inks. By providing a relatively balanced combination of strength, conductivity, and reinforcing properties, this type of carbon black feedstock is then well adapted to different applications. For instance, the automotive industry will be one of the main drivers of demand for general carbon black for the manufacturing of tires, as it can further augment tire strength, longevity, and wear resistance. Moreover, the general-type feedstock is more readily available and more economical than specialty grades, which also plays a significant role in dictating the position of the market. One of the major factors that has helped general-type carbon black feedstock maintain its leadership role in the market is the increasing demand for it due to boosting industrialization, infrastructural developments, and growth of consumer goods industries across the globe.
By Source
Clarified Slurry Oil held the largest market share around 42% in 2023. It is owing to the high demand for cereals & grains across the globe and their large-scale production. Nitrogen inputs are important for the growth, yield, and soil fertility of staple crops such as wheat, rice, corn, and barley. Carbon Black Feedstocks are placed before other fertilizers is an essential step given the global population and concerns about food security. Moreover, the demand for nitrogen-based fertilizers is further created in this segment due to intensive farming practices and the growing areas under high-yield hybrid varieties. Increased fertilizer application is also a consequence of the rapidly expanding biofuel sector, especially in corn ethanol production. This means that we can expect cereals and grains, on which the majority of the global food supply chains stand, to remain on the market in a strong place, because they depend on nitrogen fertilizers.
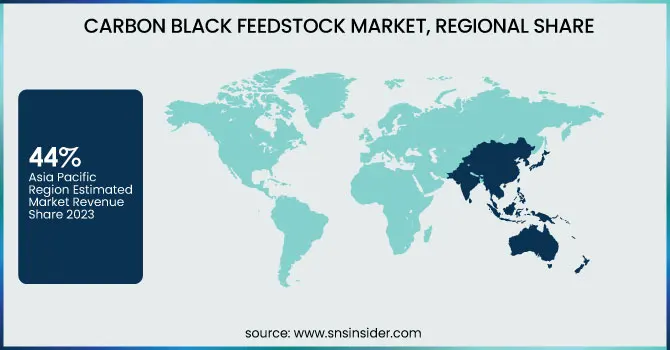
Asia Pacific held the largest market share around 44% in 2023. This is owing to the large industrial base, large end-use sector-driven demand, and presence of major carbon black manufacturing companies. High-volume consumption of carbon black is expected owing to a strong presence of major players operating in tire manufacturing, automotive, rubber processing, and industrial coatings in this region. In states like China, India, and Japan solid and liquid feedstocks such as clarified slurry oil (CSO), coal tar, and ethylene cracker tar are easily provided due to the well prevailed exploring and refining industries. Moreover, rising demand is supported by the increasing rate of urbanization along with infrastructure development and construction activities among developing economies. Asia Pacific continues to dominate the market with cheap availability of natural resources, government policies supportive to manufacturing sectors, and increasing foreign investments in the region. The region will continue to lead as industries scale up and embrace sustainable production methods.
North America held a significant market share in 2023. This is due to the presence of a well-established refining industry, high demand from the automotive and industrial sectors, and advanced technological capabilities. It is a large producer of Clarified Slurry Oil (CSO), Ethylene Cracker Tar, and FCC Tar, providing a stable feedstock supply for carbon black production. High consumption of carbon black in tire and rubber production in the U.S. & Canada due to the strong automotive industry. In addition, stringent environmental regulations have compelled manufacturers to adopt sustainable production processes and recycling schemes, augmenting the market growth. North America retains a strong position in the carbon black market owing to the presence of major carbon black producers, established infrastructure, and continuous investments in research & development activities on advanced feedstock processing technologies. Apart from this, growth in construction activities and high demand for coatings and polymers further induce growth of the market in the region.
Birla Carbon (Continua 8000, Raven 5000 Ultra)
Cabot Corporation (BLACK PEARLS160, VULCAN XC-72)
Orion Engineered Carbons (Printex 30, NEROX 605)
Phillips Carbon Black Limited (PCBL) (Swanlac 120, Carbon Black N330)
Himadri Specialty Chemical Ltd. (Himablack 45, Hitech Carbon Black)
Continental Carbon (Continex N220, Continex N330)
Tokai Carbon Co., Ltd. (50 Carbon Black, 70 Carbon Black)
OMSK Carbon Group (Carbon Black P 803, Carbon Black P 705)
China Synthetic Rubber Corporation (CSRC) (N220 Carbon Black, N330 Carbon Black)
Mitsubishi Chemical Holdings Corporation (MA-100, MA-600)
Asahi Carbon Co., Ltd. (Asahi 60, Asahi 80)
Lion Specialty Chemicals Co., Ltd. (LSC-100, LSC-200)
Denka Company Limited (DENKA BLACK, DENKA BLACK HS)
Geotech International B.V. (GeoBlack N220, GeoBlack N330)
Klean Industries Inc. (KleanCarbon N550, KleanCarbon N660)
Black Bear Carbon B.V. (BBC 100, BBC 200)
Beilum Carbon Chemical Limited (Beilum N220, Beilum N330)
Jiangxi Black Cat Carbon Black Inc. (Black Cat N220, Black Cat N330)
Longxing Chemical (LX-50, LX-70)
Atlas Organic Pvt. Ltd. (Atlas N220, Atlas N330)
In April 2023, Orion introduced cogeneration technology at its Ivanhoe plant in Louisiana, incorporating a steam turbine generator that harnesses waste steam from carbon black production to generate renewable electricity.
In March 2023, Tokai Carbon collaborated with Sekisui Chemical Co., Ltd. to enhance the practical use of Carbon Capture and Utilization (CCU) technology. This partnership aims to develop carbon-based products and materials designed for capturing and storing carbon dioxide (CO₂) in solid form.
Report Attributes | Details |
Market Size in 2023 | USD7.45 Billion |
Market Size by 2032 | USD 10.84 Billion |
CAGR | CAGR of 4.26 % From 2024 to 2032 |
Base Year | 2023 |
Forecast Period | 2024-2032 |
Historical Data | 2020-2022 |
Report Scope & Coverage | Market Size, Segments Analysis, Competitive Landscape, Regional Analysis, DROC & SWOT Analysis, Forecast Outlook |
Key Segments | • By Product (Urea, Methylene Urea, Ammonium Nitrate, Ammonium Sulfate, Ammonia, Calcium Ammonium Nitrate, Others) • By Application (Cereals & Grains, Oilseeds & Pulses, Fruits & Vegetables, Others) |
Regional Analysis/Coverage | North America (US, Canada, Mexico), Europe (Eastern Europe [Poland, Romania, Hungary, Turkey, Rest of Eastern Europe] Western Europe] Germany, France, UK, Italy, Spain, Netherlands, Switzerland, Austria, Rest of Western Europe]), Asia Pacific (China, India, Japan, South Korea, Vietnam, Singapore, Australia, Rest of Asia Pacific), Middle East & Africa (Middle East [UAE, Egypt, Saudi Arabia, Qatar, Rest of Middle East], Africa [Nigeria, South Africa, Rest of Africa], Latin America (Brazil, Argentina, Colombia, Rest of Latin America) |
Company Profiles | Birla Carbon, Cabot Corporation, Orion Engineered Carbons, Phillips Carbon Black Limited (PCBL), Himadri Specialty Chemical Ltd., Continental Carbon, Tokai Carbon Co., Ltd., OMSK Carbon Group, China Synthetic Rubber Corporation (CSRC), Mitsubishi Chemical Holdings Corporation, Asahi Carbon Co., Ltd., Lion Specialty Chemicals Co., Ltd., Denka Company Limited, Geotech International B.V., Klean Industries Inc., Black Bear Carbon B.V., Beilum Carbon Chemical Limited, Jiangxi Black Cat Carbon Black Inc., Longxing Chemical, Atlas Organic Pvt. Ltd. |
Ans: The Carbon Black Feedstock Market was valued at USD 7.45 Billion in 2023.
Ans: The expected CAGR of the global Carbon Black Feedstock Market during the forecast period is 4.26%
Ans: High BMCI Type will grow rapidly in the Carbon Black Feedstock Market from 2024-2032.
Ans: Rising demand from the tire & rubber industry which drives market growth.
Ans: Asia Pacific led the Carbon Black Feedstock Market in the region with the highest revenue share in 2023.
Table of Content
1. Introduction
1.1 Market Definition
1.2 Scope (Inclusion and Exclusions)
1.3 Research Assumptions
2. Executive Summary
2.1 Market Overview
2.2 Regional Synopsis
2.3 Competitive Summary
3. Research Methodology
3.1 Top-Down Approach
3.2 Bottom-up Approach
3.3. Data Validation
3.4 Primary Interviews
4. Market Dynamics Impact Analysis
4.1 Market Driving Factors Analysis
4.1.2 Drivers
4.1.2 Restraints
4.1.3 Opportunities
4.1.4 Challenges
4.2 PESTLE Analysis
4.3 Porter’s Five Forces Model
5. Statistical Insights and Trends Reporting
5.1 Production Capacity and Utilization, by Country, By Type, 2023
5.2 Feedstock Prices, by Country, By Type, 2023
5.3 Regulatory Impact, by Country, By Type 2023.
5.4 Environmental Metrics: Emissions Data, Waste Management Practices, and Sustainability Initiatives, by Region
5.5 Innovation and R&D, Type, 2023
6. Competitive Landscape
6.1 List of Major Companies, By Region
6.2 Market Share Analysis, By Region
6.3 Product Benchmarking
6.3.1 Product specifications and features
6.3.2 Pricing
6.4 Strategic Initiatives
6.4.1 Marketing and promotional activities
6.4.2 Distribution and Supply Chain Strategies
6.4.3 Expansion Plans and New Product Launches
6.4.4 Strategic partnerships and collaborations
6.5 Technological Advancements
6.6 Market Positioning and Branding
7. Carbon Black Feedstock Market Segmentation, By Product
7.1 Chapter Overview
7.2 High BMCI Type
7.2.1 High BMCI Type Trends Analysis (2020-2032)
7.2.2 High BMCI Type Market Size Estimates and Forecasts to 2032 (USD Billion)
7.3 General Type
7.3.1 General Type Market Trends Analysis (2020-2032)
7.3.2 General Type Market Size Estimates and Forecasts to 2032 (USD Billion)
8. Carbon Black Feedstock Market Segmentation, By Source
8.1 Chapter Overview
8.2 Clarified Slurry Oil
8.2.1 Clarified Slurry Oil Market Trends Analysis (2020-2032)
8.2.2 Clarified Slurry Oil Market Size Estimates and Forecasts to 2032 (USD Billion)
8.3 Ethylene Cracker Residue
8.3.1 Ethylene Cracker Residue Market Trends Analysis (2020-2032)
8.3.2 Ethylene Cracker Residue Market Size Estimates and Forecasts to 2032 (USD Billion)
8.4 Coal Tar Oils
8.4.1 Coal Tar Oils Market Trends Analysis (2020-2032)
8.4.2 Coal Tar Oils Market Size Estimates and Forecasts to 2032 (USD Billion)
9. Regional Analysis
9.1 Chapter Overview
9.2 North America
9.2.1 Trends Analysis
9.2.2 North America Carbon Black Feedstock Market Estimates and Forecasts, by Country (2020-2032) (USD Billion)
9.2.3 North America Carbon Black Feedstock Market Estimates and Forecasts, By Product (2020-2032) (USD Billion)
9.2.4 North America Carbon Black Feedstock Market Estimates and Forecasts, By Source (2020-2032) (USD Billion)
9.2.5 USA
9.2.5.1 USA Carbon Black Feedstock Market Estimates and Forecasts, By Product (2020-2032) (USD Billion)
9.2.5.2 USA Carbon Black Feedstock Market Estimates and Forecasts, By Source (2020-2032) (USD Billion)
9.2.6 Canada
9.2.6.1 Canada Carbon Black Feedstock Market Estimates and Forecasts, By Product (2020-2032) (USD Billion)
9.2.6.2 Canada Carbon Black Feedstock Market Estimates and Forecasts, By Source (2020-2032) (USD Billion)
9.2.7 Mexico
9.2.7.1 Mexico Carbon Black Feedstock Market Estimates and Forecasts, By Product (2020-2032) (USD Billion)
9.2.7.2 Mexico Carbon Black Feedstock Market Estimates and Forecasts, By Source (2020-2032) (USD Billion)
9.3 Europe
9.3.1 Eastern Europe
9.3.1.1 Trends Analysis
9.3.1.2 Eastern Europe Carbon Black Feedstock Market Estimates and Forecasts, by Country (2020-2032) (USD Billion)
9.3.1.3 Eastern Europe Carbon Black Feedstock Market Estimates and Forecasts, By Product (2020-2032) (USD Billion)
9.3.1.4 Eastern Europe Carbon Black Feedstock Market Estimates and Forecasts, By Source (2020-2032) (USD Billion)
9.3.1.5 Poland
9.3.1.5.1 Poland Carbon Black Feedstock Market Estimates and Forecasts, By Product (2020-2032) (USD Billion)
9.3.1.5.2 Poland Carbon Black Feedstock Market Estimates and Forecasts, By Source (2020-2032) (USD Billion)
9.3.1.6 Romania
9.3.1.6.1 Romania Carbon Black Feedstock Market Estimates and Forecasts, By Product (2020-2032) (USD Billion)
9.3.1.6.2 Romania Carbon Black Feedstock Market Estimates and Forecasts, By Source (2020-2032) (USD Billion)
9.3.1.7 Hungary
9.3.1.7.1 Hungary Carbon Black Feedstock Market Estimates and Forecasts, By Product (2020-2032) (USD Billion)
9.3.1.7.2 Hungary Carbon Black Feedstock Market Estimates and Forecasts, By Source (2020-2032) (USD Billion)
9.3.1.8 Turkey
9.3.1.8.1 Turkey Carbon Black Feedstock Market Estimates and Forecasts, By Product (2020-2032) (USD Billion)
9.3.1.8.2 Turkey Carbon Black Feedstock Market Estimates and Forecasts, By Source (2020-2032) (USD Billion)
9.3.1.9 Rest of Eastern Europe
9.3.1.9.1 Rest of Eastern Europe Carbon Black Feedstock Market Estimates and Forecasts, By Product (2020-2032) (USD Billion)
9.3.1.9.2 Rest of Eastern Europe Carbon Black Feedstock Market Estimates and Forecasts, By Source (2020-2032) (USD Billion)
9.3.2 Western Europe
9.3.2.1 Trends Analysis
9.3.2.2 Western Europe Carbon Black Feedstock Market Estimates and Forecasts, by Country (2020-2032) (USD Billion)
9.3.2.3 Western Europe Carbon Black Feedstock Market Estimates and Forecasts, By Product (2020-2032) (USD Billion)
9.3.2.4 Western Europe Carbon Black Feedstock Market Estimates and Forecasts, By Source (2020-2032) (USD Billion)
9.3.2.5 Germany
9.3.2.5.1 Germany Carbon Black Feedstock Market Estimates and Forecasts, By Product (2020-2032) (USD Billion)
9.3.2.5.2 Germany Carbon Black Feedstock Market Estimates and Forecasts, By Source (2020-2032) (USD Billion)
9.3.2.6 France
9.3.2.6.1 France Carbon Black Feedstock Market Estimates and Forecasts, By Product (2020-2032) (USD Billion)
9.3.2.6.2 France Carbon Black Feedstock Market Estimates and Forecasts, By Source (2020-2032) (USD Billion)
9.3.2.7 UK
9.3.2.7.1 UK Carbon Black Feedstock Market Estimates and Forecasts, By Product (2020-2032) (USD Billion)
9.3.2.7.2 UK Carbon Black Feedstock Market Estimates and Forecasts, By Source (2020-2032) (USD Billion)
9.3.2.8 Italy
9.3.2.8.1 Italy Carbon Black Feedstock Market Estimates and Forecasts, By Product (2020-2032) (USD Billion)
9.3.2.8.2 Italy Carbon Black Feedstock Market Estimates and Forecasts, By Source (2020-2032) (USD Billion)
9.3.2.9 Spain
9.3.2.9.1 Spain Carbon Black Feedstock Market Estimates and Forecasts, By Product (2020-2032) (USD Billion)
9.3.2.9.2 Spain Carbon Black Feedstock Market Estimates and Forecasts, By Source (2020-2032) (USD Billion)
9.3.2.10 Netherlands
9.3.2.10.1 Netherlands Carbon Black Feedstock Market Estimates and Forecasts, By Product (2020-2032) (USD Billion)
9.3.2.10.2 Netherlands Carbon Black Feedstock Market Estimates and Forecasts, By Source (2020-2032) (USD Billion)
9.3.2.11 Switzerland
9.3.2.11.1 Switzerland Carbon Black Feedstock Market Estimates and Forecasts, By Product (2020-2032) (USD Billion)
9.3.2.11.2 Switzerland Carbon Black Feedstock Market Estimates and Forecasts, By Source (2020-2032) (USD Billion)
9.3.2.12 Austria
9.3.2.12.1 Austria Carbon Black Feedstock Market Estimates and Forecasts, By Product (2020-2032) (USD Billion)
9.3.2.12.2 Austria Carbon Black Feedstock Market Estimates and Forecasts, By Source (2020-2032) (USD Billion)
9.3.2.13 Rest of Western Europe
9.3.2.13.1 Rest of Western Europe Carbon Black Feedstock Market Estimates and Forecasts, By Product (2020-2032) (USD Billion)
9.3.2.13.2 Rest of Western Europe Carbon Black Feedstock Market Estimates and Forecasts, By Source (2020-2032) (USD Billion)
9.4 Asia Pacific
9.4.1 Trends Analysis
9.4.2 Asia Pacific Carbon Black Feedstock Market Estimates and Forecasts, by Country (2020-2032) (USD Billion)
9.4.3 Asia Pacific Carbon Black Feedstock Market Estimates and Forecasts, By Product (2020-2032) (USD Billion)
9.4.4 Asia Pacific Carbon Black Feedstock Market Estimates and Forecasts, By Source (2020-2032) (USD Billion)
9.4.5 China
9.4.5.1 China Carbon Black Feedstock Market Estimates and Forecasts, By Product (2020-2032) (USD Billion)
9.4.5.2 China Carbon Black Feedstock Market Estimates and Forecasts, By Source (2020-2032) (USD Billion)
9.4.6 India
9.4.5.1 India Carbon Black Feedstock Market Estimates and Forecasts, By Product (2020-2032) (USD Billion)
9.4.5.2 India Carbon Black Feedstock Market Estimates and Forecasts, By Source (2020-2032) (USD Billion)
9.4.5 Japan
9.4.5.1 Japan Carbon Black Feedstock Market Estimates and Forecasts, By Product (2020-2032) (USD Billion)
9.4.5.2 Japan Carbon Black Feedstock Market Estimates and Forecasts, By Source (2020-2032) (USD Billion)
9.4.6 South Korea
9.4.6.1 South Korea Carbon Black Feedstock Market Estimates and Forecasts, By Product (2020-2032) (USD Billion)
9.4.6.2 South Korea Carbon Black Feedstock Market Estimates and Forecasts, By Source (2020-2032) (USD Billion)
9.4.7 Vietnam
9.4.7.1 Vietnam Carbon Black Feedstock Market Estimates and Forecasts, By Product (2020-2032) (USD Billion)
9.2.7.2 Vietnam Carbon Black Feedstock Market Estimates and Forecasts, By Source (2020-2032) (USD Billion)
9.4.8 Singapore
9.4.8.1 Singapore Carbon Black Feedstock Market Estimates and Forecasts, By Product (2020-2032) (USD Billion)
9.4.8.2 Singapore Carbon Black Feedstock Market Estimates and Forecasts, By Source (2020-2032) (USD Billion)
9.4.9 Australia
9.4.9.1 Australia Carbon Black Feedstock Market Estimates and Forecasts, By Product (2020-2032) (USD Billion)
9.4.9.2 Australia Carbon Black Feedstock Market Estimates and Forecasts, By Source (2020-2032) (USD Billion)
9.4.10 Rest of Asia Pacific
9.4.10.1 Rest of Asia Pacific Carbon Black Feedstock Market Estimates and Forecasts, By Product (2020-2032) (USD Billion)
9.4.10.2 Rest of Asia Pacific Carbon Black Feedstock Market Estimates and Forecasts, By Source (2020-2032) (USD Billion)
9.5 Middle East and Africa
9.5.1 Middle East
9.5.1.1 Trends Analysis
9.5.1.2 Middle East Carbon Black Feedstock Market Estimates and Forecasts, by Country (2020-2032) (USD Billion)
9.5.1.3 Middle East Carbon Black Feedstock Market Estimates and Forecasts, By Product (2020-2032) (USD Billion)
9.5.1.4 Middle East Carbon Black Feedstock Market Estimates and Forecasts, By Source (2020-2032) (USD Billion)
9.5.1.5 UAE
9.5.1.5.1 UAE Carbon Black Feedstock Market Estimates and Forecasts, By Product (2020-2032) (USD Billion)
9.5.1.5.2 UAE Carbon Black Feedstock Market Estimates and Forecasts, By Source (2020-2032) (USD Billion)
9.5.1.6 Egypt
9.5.1.6.1 Egypt Carbon Black Feedstock Market Estimates and Forecasts, By Product (2020-2032) (USD Billion)
9.5.1.6.2 Egypt Carbon Black Feedstock Market Estimates and Forecasts, By Source (2020-2032) (USD Billion)
9.5.1.7 Saudi Arabia
9.5.1.7.1 Saudi Arabia Carbon Black Feedstock Market Estimates and Forecasts, By Product (2020-2032) (USD Billion)
9.5.1.7.2 Saudi Arabia Carbon Black Feedstock Market Estimates and Forecasts, By Source (2020-2032) (USD Billion)
9.5.1.8 Qatar
9.5.1.8.1 Qatar Carbon Black Feedstock Market Estimates and Forecasts, By Product (2020-2032) (USD Billion)
9.5.1.8.2 Qatar Carbon Black Feedstock Market Estimates and Forecasts, By Source (2020-2032) (USD Billion)
9.5.1.9 Rest of Middle East
9.5.1.9.1 Rest of Middle East Carbon Black Feedstock Market Estimates and Forecasts, By Product (2020-2032) (USD Billion)
9.5.1.9.2 Rest of Middle East Carbon Black Feedstock Market Estimates and Forecasts, By Source (2020-2032) (USD Billion)
9.5.2 Africa
9.5.2.1 Trends Analysis
9.5.2.2 Africa Carbon Black Feedstock Market Estimates and Forecasts, by Country (2020-2032) (USD Billion)
9.5.2.3 Africa Carbon Black Feedstock Market Estimates and Forecasts, By Product (2020-2032) (USD Billion)
9.5.2.4 Africa Carbon Black Feedstock Market Estimates and Forecasts, By Source (2020-2032) (USD Billion)
9.5.2.5 South Africa
9.5.2.5.1 South Africa Carbon Black Feedstock Market Estimates and Forecasts, By Product (2020-2032) (USD Billion)
9.5.2.5.2 South Africa Carbon Black Feedstock Market Estimates and Forecasts, By Source (2020-2032) (USD Billion)
9.5.2.6 Nigeria
9.5.2.6.1 Nigeria Carbon Black Feedstock Market Estimates and Forecasts, By Product (2020-2032) (USD Billion)
9.5.2.6.2 Nigeria Carbon Black Feedstock Market Estimates and Forecasts, By Source (2020-2032) (USD Billion)
9.6 Latin America
9.6.1 Trends Analysis
9.6.2 Latin America Carbon Black Feedstock Market Estimates and Forecasts, by Country (2020-2032) (USD Billion)
9.6.3 Latin America Carbon Black Feedstock Market Estimates and Forecasts, By Product (2020-2032) (USD Billion)
9.6.4 Latin America Carbon Black Feedstock Market Estimates and Forecasts, By Source (2020-2032) (USD Billion)
9.6.5 Brazil
9.6.5.1 Brazil Carbon Black Feedstock Market Estimates and Forecasts, By Product (2020-2032) (USD Billion)
9.6.5.2 Brazil Carbon Black Feedstock Market Estimates and Forecasts, By Source (2020-2032) (USD Billion)
9.6.6 Argentina
9.6.6.1 Argentina Carbon Black Feedstock Market Estimates and Forecasts, By Product (2020-2032) (USD Billion)
9.6.6.2 Argentina Carbon Black Feedstock Market Estimates and Forecasts, By Source (2020-2032) (USD Billion)
9.6.7 Colombia
9.6.7.1 Colombia Carbon Black Feedstock Market Estimates and Forecasts, By Product (2020-2032) (USD Billion)
9.6.7.2 Colombia Carbon Black Feedstock Market Estimates and Forecasts, By Source (2020-2032) (USD Billion)
9.6.8 Rest of Latin America
9.6.8.1 Rest of Latin America Carbon Black Feedstock Market Estimates and Forecasts, By Product (2020-2032) (USD Billion)
9.6.8.2 Rest of Latin America Carbon Black Feedstock Market Estimates and Forecasts, By Source (2020-2032) (USD Billion)
10. Company Profiles
10.1 Birla Carbon
10.1.1 Company Overview
10.1.2 Financial
10.1.3 Product / Services Offered
10.1.4 SWOT Analysis
10.2 Cabot Corporation
10.2.1 Company Overview
10.2.2 Financial
10.2.3 Product/ Services Offered
10.2.4 SWOT Analysis
10.3 Orion Engineered Carbons
10.3.1 Company Overview
10.3.2 Financial
10.3.3 Product/ Services Offered
10.3.4 SWOT Analysis
10.4 Phillips Carbon Black Limited (PCBL)
10.4.1 Company Overview
10.4.2 Financial
10.4.3 Product/ Services Offered
10.4.4 SWOT Analysis
10.5 Himadri Specialty Chemical Ltd.
10.5.1 Company Overview
10.5.2 Financial
10.5.3 Product/ Services Offered
10.5.4 SWOT Analysis
10.6 Continental Carbon
10.6.1 Company Overview
10.6.2 Financial
10.6.3 Product/ Services Offered
10.6.4 SWOT Analysis
10.7 Tokai Carbon Co., Ltd.
10.7.1 Company Overview
10.7.2 Financial
10.7.3 Product/ Services Offered
10.7.4 SWOT Analysis
10.8 OMSK Carbon Group
10.8.1 Company Overview
10.8.2 Financial
10.8.3 Product/ Services Offered
10.8.4 SWOT Analysis
10.9 Mitsubishi Chemical Holdings Corporation
10.9.1 Company Overview
10.9.2 Financial
10.9.3 Product/ Services Offered
10.9.4 SWOT Analysis
10.10 Geotech International B.V.
10.10.1 Company Overview
10.10.2 Financial
10.10.3 Product/ Services Offered
10.10.4 SWOT Analysis
11. Use Cases and Best Practices
12. Conclusion
An accurate research report requires proper strategizing as well as implementation. There are multiple factors involved in the completion of good and accurate research report and selecting the best methodology to compete the research is the toughest part. Since the research reports we provide play a crucial role in any company’s decision-making process, therefore we at SNS Insider always believe that we should choose the best method which gives us results closer to reality. This allows us to reach at a stage wherein we can provide our clients best and accurate investment to output ratio.
Each report that we prepare takes a timeframe of 350-400 business hours for production. Starting from the selection of titles through a couple of in-depth brain storming session to the final QC process before uploading our titles on our website we dedicate around 350 working hours. The titles are selected based on their current market cap and the foreseen CAGR and growth.
The 5 steps process:
Step 1: Secondary Research:
Secondary Research or Desk Research is as the name suggests is a research process wherein, we collect data through the readily available information. In this process we use various paid and unpaid databases which our team has access to and gather data through the same. This includes examining of listed companies’ annual reports, Journals, SEC filling etc. Apart from this our team has access to various associations across the globe across different industries. Lastly, we have exchange relationships with various university as well as individual libraries.
Step 2: Primary Research
When we talk about primary research, it is a type of study in which the researchers collect relevant data samples directly, rather than relying on previously collected data. This type of research is focused on gaining content specific facts that can be sued to solve specific problems. Since the collected data is fresh and first hand therefore it makes the study more accurate and genuine.
We at SNS Insider have divided Primary Research into 2 parts.
Part 1 wherein we interview the KOLs of major players as well as the upcoming ones across various geographic regions. This allows us to have their view over the market scenario and acts as an important tool to come closer to the accurate market numbers. As many as 45 paid and unpaid primary interviews are taken from both the demand and supply side of the industry to make sure we land at an accurate judgement and analysis of the market.
This step involves the triangulation of data wherein our team analyses the interview transcripts, online survey responses and observation of on filed participants. The below mentioned chart should give a better understanding of the part 1 of the primary interview.
Part 2: In this part of primary research the data collected via secondary research and the part 1 of the primary research is validated with the interviews from individual consultants and subject matter experts.
Consultants are those set of people who have at least 12 years of experience and expertise within the industry whereas Subject Matter Experts are those with at least 15 years of experience behind their back within the same space. The data with the help of two main processes i.e., FGDs (Focused Group Discussions) and IDs (Individual Discussions). This gives us a 3rd party nonbiased primary view of the market scenario making it a more dependable one while collation of the data pointers.
Step 3: Data Bank Validation
Once all the information is collected via primary and secondary sources, we run that information for data validation. At our intelligence centre our research heads track a lot of information related to the market which includes the quarterly reports, the daily stock prices, and other relevant information. Our data bank server gets updated every fortnight and that is how the information which we collected using our primary and secondary information is revalidated in real time.
Step 4: QA/QC Process
After all the data collection and validation our team does a final level of quality check and quality assurance to get rid of any unwanted or undesired mistakes. This might include but not limited to getting rid of the any typos, duplication of numbers or missing of any important information. The people involved in this process include technical content writers, research heads and graphics people. Once this process is completed the title gets uploader on our platform for our clients to read it.
Step 5: Final QC/QA Process:
This is the last process and comes when the client has ordered the study. In this process a final QA/QC is done before the study is emailed to the client. Since we believe in giving our clients a good experience of our research studies, therefore, to make sure that we do not lack at our end in any way humanly possible we do a final round of quality check and then dispatch the study to the client.
Key Segments:
By Product
High BMCI Type
General Type
By Source
Clarified Slurry Oil
Ethylene Cracker Residue
Coal Tar Oils
Request for Segment Customization as per your Business Requirement: Segment Customization Request
Regional Coverage:
North America
US
Canada
Mexico
Europe
Eastern Europe
Poland
Romania
Hungary
Turkey
Rest of Eastern Europe
Western Europe
Germany
France
UK
Italy
Spain
Netherlands
Switzerland
Austria
Rest of Western Europe
Asia Pacific
China
India
Japan
South Korea
Vietnam
Singapore
Australia
Rest of Asia Pacific
Middle East & Africa
Middle East
UAE
Egypt
Saudi Arabia
Qatar
Rest of Middle East
Africa
Nigeria
South Africa
Rest of Africa
Latin America
Brazil
Argentina
Colombia
Rest of Latin America
Request for Country Level Research Report: Country Level Customization Request
Available Customization
With the given market data, SNS Insider offers customization as per the company’s specific needs. The following customization options are available for the report:
Detailed Volume Analysis
Criss-Cross segment analysis (e.g. Product X Application)
Competitive Product Benchmarking
Geographic Analysis
Additional countries in any of the regions
Customized Data Representation
Detailed analysis and profiling of additional market players
The Sustainable Adhesives Market was USD 2.51 Billion in 2023 and is expected to reach USD 4.12 Billion by 2032, growing at a CAGR of 5.66 % from 2024 to 2032.
The Needle Coke Market Size was valued at USD 4.8 Billion in 2023. It is expected to grow to $9.7 Bn by 2032 and grow at a CAGR of 8.2% by 2024-2032.
The Carbon Fiber Reinforced Plastics Market Size was USD 17.10 Billion in 2023 & will reach USD 32.80 Bn by 2032 & grow at a CAGR of 7.6% by 2024-2032.
The Ethylene Vinyl Acetate Market Size was valued at USD 11.0 billion in 2023 and is expected to reach USD 19.2 billion by 2032 and grow at a CAGR of 6.4% over the forecast period 2024-2032.
Industrial Foam Market Size was valued at USD 63.25 Bn in 2023 and is expected to reach USD 102.41 Bn by 2032 and grow at a CAGR of 5.50% by 2024-2032.
The Advanced Insulation Materials Market was valued at USD 8.20 Bn in 2023 and is expected to reach USD 14.68 Bn by 2032, at a CAGR of 6.70% from 2024-2032.
Hi! Click one of our member below to chat on Phone