image

Capnography Devices Market Report Scope & Overview:

Capnography Devices Market Revenue Analysis

Get more information on Capnography Devices Market- Request Free Sample Report

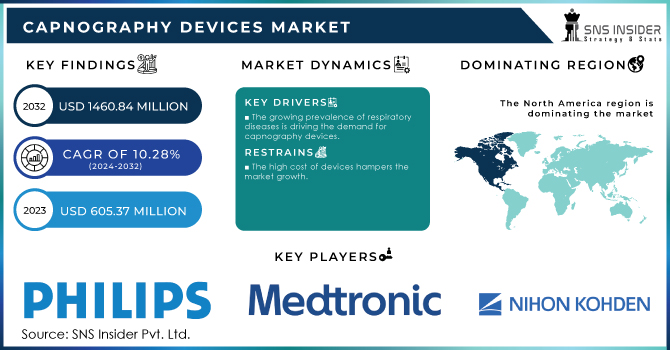
The Capnography Devices Market size was valued at USD 605.37 million in 2023 and is expected to reach USD 1460.84 million by 2032 and grow at a CAGR of 10.28% over the forecast period 2024-2032.
There is a noticeable trend in the surgical procedural field, particularly in general anesthesia, toward the adoption of capnography devices; which are designed to monitor patients’ status regarding ventilation. According to the U.S. Centers for Disease Control and Prevention, in the United States, annually approximately 48 million surgical procedures are conducted and an overwhelming proportion of them employ general anesthesia. Capnography devices are increasingly integrated into operating rooms to provide the continuous monitoring of end-tidal carbon dioxide, which is one of the critical parameters for assessing a patient’s ventilation during anesthesia. Their use helps anesthesiologists to discover hypoventilation, airway obstruction, and other developing respiratory problems timely, therefore, reducing the risk of adverse development.

The recommendation by various health organizations, including the American Society of Anesthesiologists, to use capnography during moderate and deep sedation is significantly driving the demand for these devices in the healthcare market. The ASA, in its practice guidelines, emphasizes the importance of continuous monitoring of end-tidal carbon dioxide levels to enhance patient safety during sedation.

Moreover, this is particularly crucial as capnography provides real-time data on a patient’s ventilatory status, allowing for the early detection of respiratory depression or airway obstruction. According to the U.S. Department of Health and Human Services, millions of procedures involving moderate to deep sedation are performed annually across the United States. The HHS has also highlighted that the adoption of capnography in these settings has been shown to reduce the incidence of sedation-related complications, leading to improved patient outcomes.

Furthermore, the rising prevalence of respiratory diseases like chronic obstructive pulmonary disease and asthma is significantly boosting the demand for capnography devices, as these conditions require continuous and accurate respiratory monitoring.

Drivers

The growing prevalence of respiratory diseases is driving the demand for capnography devices.

The consumption volume of capnography devices is significantly high owing to the increased prevalence of respiratory diseases. Respiratory diseases need precise and continuous monitoring of the patient’s respiratory function. The World Health Organization has warned that chronic respiratory diseases including chronic obstructive pulmonary disease and asthma are among the top leading killers of people globally. Centers for Disease Control and Prevention in the United States revealed that close to 16 million Americans are suffering from chronic obstructive pulmonary disease and many remain undiagnosed or are at a higher risk. This means that most of these patients need capnography devices to monitor their respiratory levels. Therefore, the demand for capnography devices that provide real-time readings of end-tidal carbon dioxide has continued to grow as hospitals and clinics aim to facilitate the management of the conditions. The device measures the EtCO levels that are an indication of respiratory distress. Therefore, the devices help to monitor the level of functions of the disease by taking real-time measurements.

Restrain

The high cost of devices hampers the market growth.

The high cost of capnography devices is one of the main reasons, the implementation of this technology remains limited. Moreover, if some capnography devices are equipped with advanced features, such as real-time data analytics, and integrated monitoring systems, this may raise the price of the devices even more. Besides, many healthcare facilities, such as small rural hospitals, and clinics or hospitals in developing countries, already run on very limited budgets, and, for them, purchasing such a device will be unjustifiable. Moreover, in both well and sub-developed countries, it is important to constantly pay for the maintenance of the devices, as well as their recalibration, which is also expensive.

Market Segmentation Analysis

By Type

The hand-held segment held the largest market revenue share of 62.6% in 2023. The hand-held capnography devices are important for monitoring CO2 levels and ensuring patient safety, leading to their increased adoption due to their portability, along with versatility, which makes them ideal for critical care across various medical settings such as hospitals, clinics, or ambulances. The ease of use also contributes to their popularity across different healthcare settings to support critical care delivered in anesthesia, sedation, or emergency scenarios.

The multi-parameter segment is expected to witness the fastest growth over the forecast period. Advances in sensor technology, data integration, and non-invasive monitoring have increased the accuracy, as well as usability of multi-parameter capnography devices, resulting in their increased adoption in critical care and anesthetic settings.

By Technology

The side stream segment dominated the largest market revenue share of 55.2% in 2023. The side-stream technology is increasingly employed in anesthesia monitoring and is resulting in remarkable growth. The device integrated with this technology is connected via an extend-life proprietary connector, situating the infrared source away from the external environment. This ensures a reduction in the challenge of sterilization. In addition, to detect critical health conditions such as hyper or hypothermia, a highly accurate and durable sensor is required. For example, incorporating advanced infrared absorption spectroscopy, the LoFlo sidestream sensor from Philips Respironics ensures precise respiration rate and EtCO2 measures bright, clear programs even at respiratory rates as high as 150 breaths per minute.

By Application

The largest market revenue share of 24.0% in 2023 was held by the emergency medicine segment. Emergency medicine that includes acute care in the field of obstetric, medical, and surgical emergencies is associated with considerable growth in the emergency medical services segment. Capnographs are increasingly used to guarantee optimized prehospital ventilation and pediatric emergency management. Additionally, the devices are used to evaluate the adequacy of pulmonary blood flow. It should be noted that the growing incidence of trauma cases that require prompt provision of medical services also fosters the growth of this healthcare segment. According to the American Association for the Surgery of Trauma, trauma becomes a cause of death for every second person under the age of 45. It is the fourth leading cause of death across all age groups.

By End-Use

The hospitals segment is attributable to the largest market revenue share of 64.32% in 2023. This was due to the higher capability of patient monitoring, a higher number of ventilation measurement systems available, and the higher adoption by the facilities. The market is expected to grow due to the increasing number of surgeries and the high prevalence of lifestyle disorders, such as diabetes, and respiratory diseases like asthma, among others. Additionally, the availability of state-of-the-art infrastructure in hospitals in developed countries is likely to boost the segment growth.
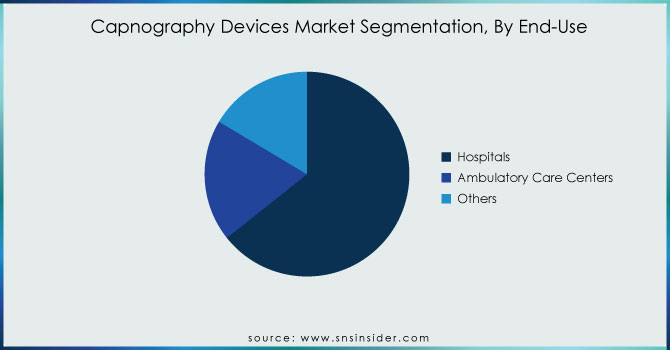
Capnography-Devices-Market-Segmentation-By-End-Use

Get Customized Report as per your Business Requirement - Request For Customized Report

Regional Analysis

North America capnography devices market dominated the market in 2023 with around 43.26% of the market share. This is increasing due to the unhealthy lifestyles and high levels of stress, respiratory disorders are becoming more common, which has a significant impact on the area market. Moreover, the incorporation of new reimbursement models for respiratory and monitoring solution procedures in this region and stringent regulatory guidelines focused on patient safety and medical efficacy, and clinical efficiency are expected to drive the product demand in the future. According to the 2020 survey by the American Psychological Association, increased stress negatively affected 49% of U.S. adults’ behavior in 2020 and increased bodily tensions in 21%.

Asia Pacific is the fastest-growing region in the capnography devices market. This is due to high sedentary lifestyle trends, increasing geriatric population, rising prevalence of target disease, and increasing prevalence of smoking are further anticipated to drive the growth.
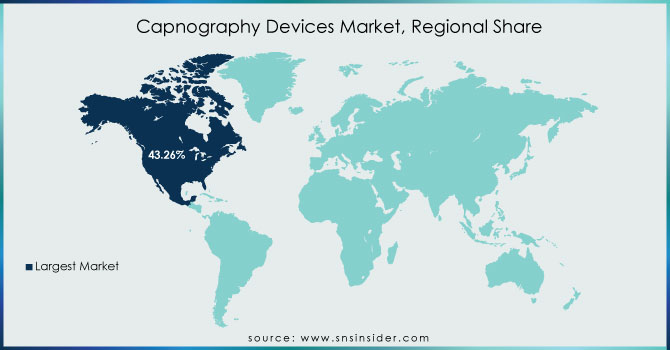
Capnography-Devices-Market-Regional-Share

Key Players

The major players listed in the capnography devices market are Masimo, Koninklijke Philips N.V., Medtronic, Nihon Kohden Corporation, Nonin, Diamedica (UK) Limited, EDAN Instruments, Inc., Dragerwerk AG & Co. KGaA, Dow Inc., Baxter, and others.

Recent Development:

  • In 2023, Philips broadened its portfolio by updating and providing the Respironics NM3, a portable ventilator, with capnography integrated. The integrated capnography helps monitor the patient’s respiratory status more easily than before, especially in intensive care units.

  • In 2023, Masimo launched Masimo Opioid Halo, a new wearable device that combines continuous capnography and pulse oximetry with its Opioid Dose Advisory technology developed to monitor patients at risk patient for opioid-induced respiratory depression to enhance patient safety by continuously monitorization of their ventilation and oxygenation.

Capnography Devices Market Report Scope

Report Attributes Details
Market Size in 2023 US$ 605.37 Million
Market Size by 2032 US$ 1460.84 Million
CAGR CAGR of10.28 % From 2024 to 2032
Base Year 2023
Forecast Period 2024-2032
Historical Data 2020-2022
Report Scope & Coverage Market Size, Segments Analysis, Competitive  Landscape, Regional Analysis, DROC & SWOT Analysis, Forecast Outlook
Key Segments • By Type (Hand-Held, Stand-Alone, Multi-Parameter)
• By Technology (Mainstream, Sidestream, Microstream)
• By Application (Emergency Medicine, Pain Medicine, Procedural Sedation, Critical Care, and Others)
• By End-Use (Hospitals, Ambulatory care, and Others)
Regional Analysis/Coverage North America (US, Canada, Mexico), Europe (Eastern Europe [Poland, Romania, Hungary, Turkey, Rest of Eastern Europe] Western Europe] Germany, France, UK, Italy, Spain, Netherlands, Switzerland, Austria, Rest of Western Europe]), Asia Pacific (China, India, Japan, South Korea, Vietnam, Singapore, Australia, Rest of Asia Pacific), Middle East & Africa (Middle East [UAE, Egypt, Saudi Arabia, Qatar, Rest of Middle East], Africa [Nigeria, South Africa, Rest of Africa], Latin America (Brazil, Argentina, Colombia, Rest of Latin America)
Company Profiles Masimo, Koninklijke Philips N.V., Medtronic, Nihon Kohden Corporation, Nonin, Diamedica (UK) Limited, EDAN Instruments, Inc., Dragerwerk AG & Co. KGaA, Dow Inc., Baxter, and others. . 
Key Drivers •The growing prevalence of respiratory diseases is driving the demand for capnography devices.
RESTRAINTS •High cost of devices hampers the market growth.  

Frequently Asked Questions

Ans: The Capnography Devices Market was valued at USD 605.37 million in 2023.

Ans: The expected CAGR of the global Capnography Devices Market during the forecast period is 10.28%.

Ans: The hospital segment will grow rapidly in the Capnography Devices Market from 2024-2032.

Ans: The growing prevalence of respiratory diseases is driving the demand for capnography devices.

Ans: The U.S. led the Capnography Devices in North America region with the highest revenue share in 2023.

Table of Contents

1. Introduction

1.1 Market Definition

1.2 Scope (Inclusion and Exclusions)

1.3 Research Assumptions

2. Executive Summary

2.1 Market Overview

2.2 Regional Synopsis

2.3 Competitive Summary

3. Research Methodology

3.1 Top-Down Approach

3.2 Bottom-up Approach

3.3. Data Validation

3.4 Primary Interviews

4. Market Dynamics Impact Analysis

4.1 Market Driving Factors Analysis

4.1.1 Drivers

4.1.2 Restraints

4.1.3 Opportunities

4.1.4 Challenges

4.2 PESTLE Analysis

4.3 Porter’s Five Forces Model

5. Statistical Insights and Trends Reporting

5.1   Incidence and Prevalence (2023)

5.2 Prescription Trends, (2023), by Region

5.3   Device Volume, by Region (2020-2032)

5.4 Healthcare Spending, by Region, (Government, Commercial, Private, Out-of-Pocket), 2023

6. Competitive Landscape

6.1 List of Major Companies, By Region

6.2 Market Share Analysis, By Region

6.3 Product Benchmarking

6.3.1 Product specifications and features

6.3.2 Pricing

6.4 Strategic Initiatives

6.4.1 Marketing and promotional activities

6.4.2 Distribution and supply chain strategies

6.4.3 Expansion plans and new product launches

6.4.4 Strategic partnerships and collaborations

6.5 Technological Advancements

6.6 Market Positioning and Branding

7. Capnography Devices Market Segmentation, by Type

7.1 Chapter Overview

7.2 Hand-Held

7.2.1 Hand-Held Market Trends Analysis (2020-2032)

7.2.2 Hand-Held Market Size Estimates and Forecasts to 2032 (USD Million)

7.3 Stand-Alone

7.3.1 Stand-Alone Market Trends Analysis (2020-2032)

7.3.2 Stand-Alone Market Size Estimates and Forecasts to 2032 (USD Million)

7.4 Multi-Parameter

7.4.1 Multi-Parameter Market Trends Analysis (2020-2032)

7.4.2 Multi-Parameter Market Size Estimates and Forecasts to 2032 (USD Million)

8. Capnography Devices Market Segmentation, by Application

8.1 Chapter Overview

8.2 Emergency Medicine

8.2.1 Emergency Medicine Market Trends Analysis (2020-2032)

8.2.2 Emergency Medicine Market Size Estimates and Forecasts to 2032 (USD Million)

8.3 Pain Medicine

8.3.1 Pain Medicine Market Trends Analysis (2020-2032)

8.3.2 Pain Medicine Market Size Estimates and Forecasts to 2032 (USD Million)

8.4 Procedural Sedation

8.4.1 Procedural Sedation Market Trends Analysis (2020-2032)

8.4.2 Procedural Sedation Market Size Estimates and Forecasts to 2032 (USD Million)

8.5 Critical Care

8.5.1 Critical Care Market Trends Analysis (2020-2032)

8.5.2 Critical Care Market Size Estimates and Forecasts to 2032 (USD Million)

8.6 Others

8.6.1 Others Market Trends Analysis (2020-2032)

8.6.2 Others Market Size Estimates and Forecasts to 2032 (USD Million)

9. Capnography Devices Market Segmentation, by End Use

9.1 Chapter Overview

9.2 Hospitals

9.2.1 Hospitals Market Trends Analysis (2020-2032)

9.2.2 Hospitals Market Size Estimates and Forecasts to 2032 (USD Million)

9.3 Ambulatory Care Centers

9.3.1 Ambulatory Care Centers Market Trends Analysis (2020-2032)

9.3.2 Ambulatory Care Centers Market Size Estimates and Forecasts to 2032 (USD Million)

9.4 Others

               9.4.1 Others Market Trends Analysis (2020-2032)

9.4.2 Others Market Size Estimates and Forecasts to 2032 (USD Million)

10. Capnography Devices Market Segmentation, by Technology

10.1 Chapter Overview

10.2 Mainstream

10.2.1 Mainstream Market Trends Analysis (2020-2032)

10.2.2 Mainstream Market Size Estimates and Forecasts to 2032 (USD Million)

10.3 Sidestream

10.3.1 Sidestream Market Trends Analysis (2020-2032)

10.3.2 Sidestream Market Size Estimates and Forecasts to 2032 (USD Million)

10.4 Microstream

               10.4.1 Microstream Market Trends Analysis (2020-2032)

10.4.2 Microstream Market Size Estimates and Forecasts to 2032 (USD Million)

11. Regional Analysis

11.1 Chapter Overview

11.2 North America

11.2.1 Trends Analysis

11.2.2 North America Capnography Devices Market Estimates and Forecasts, by Country (2020-2032) (USD Million)

11.2.3 North America Capnography Devices Market Estimates and Forecasts, by Type (2020-2032) (USD Million) 

11.2.4 North America Capnography Devices Market Estimates and Forecasts, by Application (2020-2032) (USD Million)

11.2.5 North America Capnography Devices Market Estimates and Forecasts, by End Use (2020-2032) (USD Million)

11.2.6 North America Capnography Devices Market Estimates and Forecasts, by Technology (2020-2032) (USD Million)

11.2.7 USA

11.2.7.1 USA Capnography Devices Market Estimates and Forecasts, by Type (2020-2032) (USD Million)

11.2.7.2 USA Capnography Devices Market Estimates and Forecasts, by Application (2020-2032) (USD Million)

11.2.7.3 USA Capnography Devices Market Estimates and Forecasts, by End Use (2020-2032) (USD Million)

11.2.7.4 USA Capnography Devices Market Estimates and Forecasts, by Technology (2020-2032) (USD Million)

11.2.8 Canada

11.2.8.1 Canada Capnography Devices Market Estimates and Forecasts, by Type (2020-2032) (USD Million)

11.2.8.2 Canada Capnography Devices Market Estimates and Forecasts, by Application (2020-2032) (USD Million)

11.2.8.3 Canada Capnography Devices Market Estimates and Forecasts, by End Use (2020-2032) (USD Million)

11.2.8.4 Canada Capnography Devices Market Estimates and Forecasts, by Technology (2020-2032) (USD Million)

11.2.9 Mexico

11.2.9.1 Mexico Capnography Devices Market Estimates and Forecasts, by Type (2020-2032) (USD Million)

11.2.9.2 Mexico Capnography Devices Market Estimates and Forecasts, by Application (2020-2032) (USD Million)

11.2.9.3 Mexico Capnography Devices Market Estimates and Forecasts, by End Use (2020-2032) (USD Million)

11.2.9.4 Mexico Capnography Devices Market Estimates and Forecasts, by Technology (2020-2032) (USD Million)

11.3 Europe

11.3.1 Eastern Europe

11.3.1.1 Trends Analysis

11.3.1.2 Eastern Europe Capnography Devices Market Estimates and Forecasts, by Country (2020-2032) (USD Million)

11.3.1.3 Eastern Europe Capnography Devices Market Estimates and Forecasts, by Type (2020-2032) (USD Million) 

11.3.1.4 Eastern Europe Capnography Devices Market Estimates and Forecasts, by Application (2020-2032) (USD Million)

11.3.1.5 Eastern Europe Capnography Devices Market Estimates and Forecasts, by End Use (2020-2032) (USD Million)

11.3.1.6 Eastern Europe Capnography Devices Market Estimates and Forecasts, by Technology (2020-2032) (USD Million)

11.3.1.7 Poland

11.3.1.7.1 Poland Capnography Devices Market Estimates and Forecasts, by Type (2020-2032) (USD Million)

11.3.1.7.2 Poland Capnography Devices Market Estimates and Forecasts, by Application (2020-2032) (USD Million)

11.3.1.7.3 Poland Capnography Devices Market Estimates and Forecasts, by End Use (2020-2032) (USD Million)

11.3.1.7.4 Poland Capnography Devices Market Estimates and Forecasts, by Technology (2020-2032) (USD Million)

11.3.1.8 Romania

11.3.1.8.1 Romania Capnography Devices Market Estimates and Forecasts, by Type (2020-2032) (USD Million)

11.3.1.8.2 Romania Capnography Devices Market Estimates and Forecasts, by Application (2020-2032) (USD Million)

11.3.1.8.3 Romania Capnography Devices Market Estimates and Forecasts, by End Use (2020-2032) (USD Million)

11.3.1.8.4 Romania Capnography Devices Market Estimates and Forecasts, by Technology (2020-2032) (USD Million)

11.3.1.9 Hungary

11.3.1.9.1 Hungary Capnography Devices Market Estimates and Forecasts, by Type (2020-2032) (USD Million)

11.3.1.9.2 Hungary Capnography Devices Market Estimates and Forecasts, by Application (2020-2032) (USD Million)

11.3.1.9.3 Hungary Capnography Devices Market Estimates and Forecasts, by End Use (2020-2032) (USD Million)

11.3.1.9.4 Hungary Capnography Devices Market Estimates and Forecasts, by Technology (2020-2032) (USD Million)

11.3.1.10 Turkey

11.3.1.10.1 Turkey Capnography Devices Market Estimates and Forecasts, by Type (2020-2032) (USD Million)

11.3.1.10.2 Turkey Capnography Devices Market Estimates and Forecasts, by Application (2020-2032) (USD Million)

11.3.1.10.3 Turkey Capnography Devices Market Estimates and Forecasts, by End Use (2020-2032) (USD Million)

11.3.1.10.4 Turkey Capnography Devices Market Estimates and Forecasts, by Technology (2020-2032) (USD Million)

11.3.1.11 Rest of Eastern Europe

11.3.1.11.1 Rest of Eastern Europe Capnography Devices Market Estimates and Forecasts, by Type (2020-2032) (USD Million)

11.3.1.11.2 Rest of Eastern Europe Capnography Devices Market Estimates and Forecasts, by Application (2020-2032) (USD Million)

11.3.1.11.3 Rest of Eastern Europe Capnography Devices Market Estimates and Forecasts, by End Use (2020-2032) (USD Million)

11.3.1.11.4 Rest of Eastern Europe Capnography Devices Market Estimates and Forecasts, by Technology (2020-2032) (USD Million)

11.3.2 Western Europe

11.3.2.1 Trends Analysis

11.3.2.2 Western Europe Capnography Devices Market Estimates and Forecasts, by Country (2020-2032) (USD Million)

11.3.2.3 Western Europe Capnography Devices Market Estimates and Forecasts, by Type (2020-2032) (USD Million) 

11.3.2.4 Western Europe Capnography Devices Market Estimates and Forecasts, by Application (2020-2032) (USD Million)

11.3.2.5 Western Europe Capnography Devices Market Estimates and Forecasts, by End Use (2020-2032) (USD Million)

11.3.2.6 Western Europe Capnography Devices Market Estimates and Forecasts, by Technology (2020-2032) (USD Million)

11.3.2.7 Germany

11.3.2.7.1 Germany Capnography Devices Market Estimates and Forecasts, by Type (2020-2032) (USD Million)

11.3.2.7.2 Germany Capnography Devices Market Estimates and Forecasts, by Application (2020-2032) (USD Million)

11.3.2.7.3 Germany Capnography Devices Market Estimates and Forecasts, by End Use (2020-2032) (USD Million)

11.3.2.7.4 Germany Capnography Devices Market Estimates and Forecasts, by Technology (2020-2032) (USD Million)

11.3.2.8 France

11.3.2.8.1 France Capnography Devices Market Estimates and Forecasts, by Type (2020-2032) (USD Million)

11.3.2.8.2 France Capnography Devices Market Estimates and Forecasts, by Application (2020-2032) (USD Million)

11.3.2.8.3 France Capnography Devices Market Estimates and Forecasts, by End Use (2020-2032) (USD Million)

11.3.2.8.4 France Capnography Devices Market Estimates and Forecasts, by Technology (2020-2032) (USD Million)

11.3.2.9 UK

11.3.2.9.1 UK Capnography Devices Market Estimates and Forecasts, by Type (2020-2032) (USD Million)

11.3.2.9.2 UK Capnography Devices Market Estimates and Forecasts, by Application (2020-2032) (USD Million)

11.3.2.9.3 UK Capnography Devices Market Estimates and Forecasts, by End Use (2020-2032) (USD Million)

11.3.2.9.4 UK Capnography Devices Market Estimates and Forecasts, by Technology (2020-2032) (USD Million)

11.3.2.10 Italy

11.3.2.10.1 Italy Capnography Devices Market Estimates and Forecasts, by Type (2020-2032) (USD Million)

11.3.2.10.2 Italy Capnography Devices Market Estimates and Forecasts, by Application (2020-2032) (USD Million)

11.3.2.10.3 Italy Capnography Devices Market Estimates and Forecasts, by End Use (2020-2032) (USD Million)

11.3.2.10.4 Italy Capnography Devices Market Estimates and Forecasts, by Technology (2020-2032) (USD Million)

11.3.2.11 Spain

11.3.2.11.1 Spain Capnography Devices Market Estimates and Forecasts, by Type (2020-2032) (USD Million)

11.3.2.11.2 Spain Capnography Devices Market Estimates and Forecasts, by Application (2020-2032) (USD Million)

11.3.2.11.3 Spain Capnography Devices Market Estimates and Forecasts, by End Use (2020-2032) (USD Million)

11.3.2.11.4 Spain Capnography Devices Market Estimates and Forecasts, by Technology (2020-2032) (USD Million)

11.3.2.12 Netherlands

11.3.2.12.1 Netherlands Capnography Devices Market Estimates and Forecasts, by Type (2020-2032) (USD Million)

11.3.2.12.2 Netherlands Capnography Devices Market Estimates and Forecasts, by Application (2020-2032) (USD Million)

11.3.2.12.3 Netherlands Capnography Devices Market Estimates and Forecasts, by End Use (2020-2032) (USD Million)

11.3.2.12.4 Netherlands Capnography Devices Market Estimates and Forecasts, by Technology (2020-2032) (USD Million)

11.3.2.13 Switzerland

11.3.2.13.1 Switzerland Capnography Devices Market Estimates and Forecasts, by Type (2020-2032) (USD Million)

11.3.2.13.2 Switzerland Capnography Devices Market Estimates and Forecasts, by Application (2020-2032) (USD Million)

11.3.2.13.3 Switzerland Capnography Devices Market Estimates and Forecasts, by End Use (2020-2032) (USD Million)

11.3.2.13.4 Switzerland Capnography Devices Market Estimates and Forecasts, by Technology (2020-2032) (USD Million)

11.3.2.14 Austria

11.3.2.14.1 Austria Capnography Devices Market Estimates and Forecasts, by Type (2020-2032) (USD Million)

11.3.2.14.2 Austria Capnography Devices Market Estimates and Forecasts, by Application (2020-2032) (USD Million)

11.3.2.14.3 Austria Capnography Devices Market Estimates and Forecasts, by End Use (2020-2032) (USD Million)

11.3.2.14.4 Austria Capnography Devices Market Estimates and Forecasts, by Technology (2020-2032) (USD Million)

11.3.2.15 Rest of Western Europe

11.3.2.15.1 Rest of Western Europe Capnography Devices Market Estimates and Forecasts, by Type (2020-2032) (USD Million)

11.3.2.15.2 Rest of Western Europe Capnography Devices Market Estimates and Forecasts, by Application (2020-2032) (USD Million)

11.3.2.15.3 Rest of Western Europe Capnography Devices Market Estimates and Forecasts, by End Use (2020-2032) (USD Million)

11.3.2.15.4 Rest of Western Europe Capnography Devices Market Estimates and Forecasts, by Technology (2020-2032) (USD Million)

11.4 Asia Pacific

11.4.1 Trends Analysis

11.4.2 Asia Pacific Capnography Devices Market Estimates and Forecasts, by Country (2020-2032) (USD Million)

11.4.3 Asia Pacific Capnography Devices Market Estimates and Forecasts, by Type (2020-2032) (USD Million) 

11.4.4 Asia Pacific Capnography Devices Market Estimates and Forecasts, by Application (2020-2032) (USD Million)

11.4.5 Asia Pacific Capnography Devices Market Estimates and Forecasts, by End Use (2020-2032) (USD Million)

11.4.6 Asia Pacific Capnography Devices Market Estimates and Forecasts, by Technology (2020-2032) (USD Million)

11.4.7 China

11.4.7.1 China Capnography Devices Market Estimates and Forecasts, by Type (2020-2032) (USD Million)

11.4.7.2 China Capnography Devices Market Estimates and Forecasts, by Application (2020-2032) (USD Million)

11.4.7.3 China Capnography Devices Market Estimates and Forecasts, by End Use (2020-2032) (USD Million)

11.4.7.4 China Capnography Devices Market Estimates and Forecasts, by Technology (2020-2032) (USD Million)

11.4.8 India

11.4.8.1 India Capnography Devices Market Estimates and Forecasts, by Type (2020-2032) (USD Million)

11.4.8.2 India Capnography Devices Market Estimates and Forecasts, by Application (2020-2032) (USD Million)

11.4.8.3 India Capnography Devices Market Estimates and Forecasts, by End Use (2020-2032) (USD Million)

11.4.8.4 India Capnography Devices Market Estimates and Forecasts, by Technology (2020-2032) (USD Million)

11.4.9 Japan

11.4.9.1 Japan Capnography Devices Market Estimates and Forecasts, by Type (2020-2032) (USD Million)

11.4.9.2 Japan Capnography Devices Market Estimates and Forecasts, by Application (2020-2032) (USD Million)

11.4.9.3 Japan Capnography Devices Market Estimates and Forecasts, by End Use (2020-2032) (USD Million)

11.4.9.4 Japan Capnography Devices Market Estimates and Forecasts, by Technology (2020-2032) (USD Million)

11.4.10 South Korea

11.4.10.1 South Korea Capnography Devices Market Estimates and Forecasts, by Type (2020-2032) (USD Million)

11.4.10.2 South Korea Capnography Devices Market Estimates and Forecasts, by Application (2020-2032) (USD Million)

11.4.10.3 South Korea Capnography Devices Market Estimates and Forecasts, by End Use (2020-2032) (USD Million)

11.4.10.4 South Korea Capnography Devices Market Estimates and Forecasts, by Technology (2020-2032) (USD Million)

11.4.11 Vietnam

11.4.11.1 Vietnam Capnography Devices Market Estimates and Forecasts, by Type (2020-2032) (USD Million)

11.4.11.2 Vietnam Capnography Devices Market Estimates and Forecasts, by Application (2020-2032) (USD Million)

11.4.11.3 Vietnam Capnography Devices Market Estimates and Forecasts, by End Use (2020-2032) (USD Million)

11.4.11.4 Vietnam Capnography Devices Market Estimates and Forecasts, by Technology (2020-2032) (USD Million)

11.4.12 Singapore

11.4.12.1 Singapore Capnography Devices Market Estimates and Forecasts, by Type (2020-2032) (USD Million)

11.4.12.2 Singapore Capnography Devices Market Estimates and Forecasts, by Application (2020-2032) (USD Million)

11.4.12.3 Singapore Capnography Devices Market Estimates and Forecasts, by End Use (2020-2032) (USD Million)

11.4.12.4 Singapore Capnography Devices Market Estimates and Forecasts, by Technology (2020-2032) (USD Million)

11.4.13 Australia

11.4.13.1 Australia Capnography Devices Market Estimates and Forecasts, by Type (2020-2032) (USD Million)

11.4.13.2 Australia Capnography Devices Market Estimates and Forecasts, by Application (2020-2032) (USD Million)

11.4.13.3 Australia Capnography Devices Market Estimates and Forecasts, by End Use (2020-2032) (USD Million)

11.4.13.4 Australia Capnography Devices Market Estimates and Forecasts, by Technology (2020-2032) (USD Million)

11.4.14 Rest of Asia Pacific

11.4.14.1 Rest of Asia Pacific Capnography Devices Market Estimates and Forecasts, by Type (2020-2032) (USD Million)

11.4.14.2 Rest of Asia Pacific Capnography Devices Market Estimates and Forecasts, by Application (2020-2032) (USD Million)

11.4.14.3 Rest of Asia Pacific Capnography Devices Market Estimates and Forecasts, by End Use (2020-2032) (USD Million)

11.4.14.4 Rest of Asia Pacific Capnography Devices Market Estimates and Forecasts, by Technology (2020-2032) (USD Million)

11.5 Middle East and Africa

11.5.1 Middle East

11.5.1.1 Trends Analysis

11.5.1.2 Middle East Capnography Devices Market Estimates and Forecasts, by Country (2020-2032) (USD Million)

11.5.1.3 Middle East Capnography Devices Market Estimates and Forecasts, by Type (2020-2032) (USD Million) 

11.5.1.4 Middle East Capnography Devices Market Estimates and Forecasts, by Application (2020-2032) (USD Million)

11.5.1.5 Middle East Capnography Devices Market Estimates and Forecasts, by End Use (2020-2032) (USD Million)

11.5.1.6 Middle East Capnography Devices Market Estimates and Forecasts, by Technology (2020-2032) (USD Million)

11.5.1.7 UAE

11.5.1.7.1 UAE Capnography Devices Market Estimates and Forecasts, by Type (2020-2032) (USD Million)

11.5.1.7.2 UAE Capnography Devices Market Estimates and Forecasts, by Application (2020-2032) (USD Million)

11.5.1.7.3 UAE Capnography Devices Market Estimates and Forecasts, by End Use (2020-2032) (USD Million)

11.5.1.7.4 UAE Capnography Devices Market Estimates and Forecasts, by Technology  (2020-2032) (USD Million)

11.5.1.8 Egypt

11.5.1.8.1 Egypt Capnography Devices Market Estimates and Forecasts, by Type (2020-2032) (USD Million)

11.5.1.8.2 Egypt Capnography Devices Market Estimates and Forecasts, by Application (2020-2032) (USD Million)

11.5.1.8.3 Egypt Capnography Devices Market Estimates and Forecasts, by End Use (2020-2032) (USD Million)

11.5.1.8.4 Egypt Capnography Devices Market Estimates and Forecasts, by Technology (2020-2032) (USD Million)

11.5.1.9 Saudi Arabia

11.5.1.9.1 Saudi Arabia Capnography Devices Market Estimates and Forecasts, by Type (2020-2032) (USD Million)

11.5.1.9.2 Saudi Arabia Capnography Devices Market Estimates and Forecasts, by Application (2020-2032) (USD Million)

11.5.1.9.3 Saudi Arabia Capnography Devices Market Estimates and Forecasts, by End Use (2020-2032) (USD Million)

11.5.1.9.4 Saudi Arabia Capnography Devices Market Estimates and Forecasts, by Technology (2020-2032) (USD Million)

11.5.1.10 Qatar

11.5.1.10.1 Qatar Capnography Devices Market Estimates and Forecasts, by Type (2020-2032) (USD Million)

11.5.1.10.2 Qatar Capnography Devices Market Estimates and Forecasts, by Application (2020-2032) (USD Million)

11.5.1.10.3 Qatar Capnography Devices Market Estimates and Forecasts, by End Use (2020-2032) (USD Million)

11.5.1.10.4 Qatar Capnography Devices Market Estimates and Forecasts, by Technology (2020-2032) (USD Million)

11.5.1.11 Rest of Middle East

11.5.1.11.1 Rest of Middle East Capnography Devices Market Estimates and Forecasts, by Type (2020-2032) (USD Million)

11.5.1.11.2 Rest of Middle East Capnography Devices Market Estimates and Forecasts, by Application (2020-2032) (USD Million)

11.5.1.11.3 Rest of Middle East Capnography Devices Market Estimates and Forecasts, by End Use (2020-2032) (USD Million)

11.5.1.11.4 Rest of Middle East Capnography Devices Market Estimates and Forecasts, by Technology (2020-2032) (USD Million)

11.5.2 Africa

11.5.2.1 Trends Analysis

11.5.2.2 Africa Capnography Devices Market Estimates and Forecasts, by Country (2020-2032) (USD Million)

11.5.2.3 Africa Capnography Devices Market Estimates and Forecasts, by Type (2020-2032) (USD Million) 

11.5.2.4 Africa Capnography Devices Market Estimates and Forecasts, by Application (2020-2032) (USD Million)

11.5.2.5 Africa Capnography Devices Market Estimates and Forecasts, by End Use (2020-2032) (USD Million)

11.5.2.6 Africa Capnography Devices Market Estimates and Forecasts, by Technology (2020-2032) (USD Million)

11.5.2.7 South Africa

11.5.2.7.1 South Africa Capnography Devices Market Estimates and Forecasts, by Type (2020-2032) (USD Million)

11.5.2.7.2 South Africa Capnography Devices Market Estimates and Forecasts, by Application (2020-2032) (USD Million)

11.5.2.7.3 South Africa Capnography Devices Market Estimates and Forecasts, by End Use (2020-2032) (USD Million)

11.5.2.7.4 South Africa Capnography Devices Market Estimates and Forecasts, by Technology (2020-2032) (USD Million)

11.5.2.8 Nigeria

11.5.2.8.1 Nigeria Capnography Devices Market Estimates and Forecasts, by Type (2020-2032) (USD Million)

11.5.2.8.2 Nigeria Capnography Devices Market Estimates and Forecasts, by Application (2020-2032) (USD Million)

11.5.2.8.3 Nigeria Capnography Devices Market Estimates and Forecasts, by End Use (2020-2032) (USD Million)

11.5.2.8.4 Nigeria Capnography Devices Market Estimates and Forecasts, by Technology (2020-2032) (USD Million)

11.5.2.9 Rest of Africa

11.5.2.9.1 Rest of Africa Capnography Devices Market Estimates and Forecasts, by Type (2020-2032) (USD Million)

11.5.2.9.2 Rest of Africa Capnography Devices Market Estimates and Forecasts, by Application (2020-2032) (USD Million)

11.5.2.9.3 Rest of Africa Capnography Devices Market Estimates and Forecasts, by End Use (2020-2032) (USD Million)

11.5.2.9.4 Rest of Africa Capnography Devices Market Estimates and Forecasts, by Technology (2020-2032) (USD Million)

11.6 Latin America

11.6.1 Trends Analysis

11.6.2 Latin America Capnography Devices Market Estimates and Forecasts, by Country (2020-2032) (USD Million)

11.6.3 Latin America Capnography Devices Market Estimates and Forecasts, by Type (2020-2032) (USD Million) 

11.6.4 Latin America Capnography Devices Market Estimates and Forecasts, by Application (2020-2032) (USD Million)

11.6.5 Latin America Capnography Devices Market Estimates and Forecasts, by End Use (2020-2032) (USD Million)

11.6.6 Latin America Capnography Devices Market Estimates and Forecasts, by Technology (2020-2032) (USD Million)

11.6.7 Brazil

11.6.7.1 Brazil Capnography Devices Market Estimates and Forecasts, by Type (2020-2032) (USD Million)

11.6.7.2 Brazil Capnography Devices Market Estimates and Forecasts, by Application (2020-2032) (USD Million)

11.6.7.3 Brazil Capnography Devices Market Estimates and Forecasts, by End Use (2020-2032) (USD Million)

11.6.7.4 Brazil Capnography Devices Market Estimates and Forecasts, by Technology (2020-2032) (USD Million)

11.6.8 Argentina

11.6.8.1 Argentina Capnography Devices Market Estimates and Forecasts, by Type (2020-2032) (USD Million)

11.6.8.2 Argentina Capnography Devices Market Estimates and Forecasts, by Application (2020-2032) (USD Million)

11.6.8.3 Argentina Capnography Devices Market Estimates and Forecasts, by End Use (2020-2032) (USD Million)

11.6.8.4 Argentina Capnography Devices Market Estimates and Forecasts, by Technology (2020-2032) (USD Million)

11.6.9 Colombia

11.6.9.1 Colombia Capnography Devices Market Estimates and Forecasts, by Type (2020-2032) (USD Million)

11.6.9.2 Colombia Capnography Devices Market Estimates and Forecasts, by Application (2020-2032) (USD Million)

11.6.9.3 Colombia Capnography Devices Market Estimates and Forecasts, by End Use (2020-2032) (USD Million)

11.6.9.4 Colombia Capnography Devices Market Estimates and Forecasts, by Technology (2020-2032) (USD Million)

11.6.10 Rest of Latin America

11.6.10.1 Rest of Latin America Capnography Devices Market Estimates and Forecasts, by Type (2020-2032) (USD Million)

11.6.10.2 Rest of Latin America Capnography Devices Market Estimates and Forecasts, by Application (2020-2032) (USD Million)

11.6.10.3 Rest of Latin America Capnography Devices Market Estimates and Forecasts, by End Use (2020-2032) (USD Million)

11.6.10.4 Rest of Latin America Capnography Devices Market Estimates and Forecasts, by Technology (2020-2032) (USD Million)

12. Company Profiles

12.1 Masimo

12.1.1 Company Overview

12.1.2 Financial

12.1.3 Products/ Services Offered

12.1.4 SWOT Analysis

12.2 Koninklijke Philips N.V.

12.2.1 Company Overview

12.2.2 Financial

12.2.3 Products/ Services Offered

12.2.4 SWOT Analysis

12.3 Medtronic

12.3.1 Company Overview

12.3.2 Financial

12.3.3 Products/ Services Offered

12.3.4 SWOT Analysis

12.4 Nihon Kohden Corporation

12.4.1 Company Overview

12.4.2 Financial

12.4.3 Products/ Services Offered

12.4.4 SWOT Analysis

12.5 Nonin

12.5.1 Company Overview

12.5.2 Financial

12.5.3 Products/ Services Offered

12.5.4 SWOT Analysis

12.6 Diamedica Limited

               12.6.1 Company Overview

12.6.2 Financial

12.6.3 Products/ Services Offered

12.6.4 SWOT Analysis

12.7 EDAN Instruments, Inc.

              12.7.1 Company Overview

12.7.2 Financial

12.7.3 Products/ Services Offered

12.7.4 SWOT Analysis

12.8 Dragerwerk AG & Co. KGaA

               12.8.1 Company Overview

12.8.2 Financial

12.8.3 Products/ Services Offered

12.8.4 SWOT Analysis

12.9 Dow Inc.

               12.9.1 Company Overview

12.9.2 Financial

12.9.3 Products/ Services Offered

12.9.4 SWOT Analysis

12.10 Baxter

              12.10.1 Company Overview

12.10.2 Financial

12.10.3 Products/ Services Offered

12.10.4 SWOT Analysis

13. Use Cases and Best Practices

14. Conclusion

An accurate research report requires proper strategizing as well as implementation. There are multiple factors involved in the completion of good and accurate research report and selecting the best methodology to compete the research is the toughest part. Since the research reports we provide play a crucial role in any company’s decision-making process, therefore we at SNS Insider always believe that we should choose the best method which gives us results closer to reality. This allows us to reach at a stage wherein we can provide our clients best and accurate investment to output ratio.

Each report that we prepare takes a timeframe of 350-400 business hours for production. Starting from the selection of titles through a couple of in-depth brain storming session to the final QC process before uploading our titles on our website we dedicate around 350 working hours. The titles are selected based on their current market cap and the foreseen CAGR and growth.


The 5 steps process:

Step 1: Secondary Research:

Secondary Research or Desk Research is as the name suggests is a research process wherein, we collect data through the readily available information. In this process we use various paid and unpaid databases which our team has access to and gather data through the same. This includes examining of listed companies’ annual reports, Journals, SEC filling etc. Apart from this our team has access to various associations across the globe across different industries. Lastly, we have exchange relationships with various university as well as individual libraries.

Secondary Research

Step 2: Primary Research

When we talk about primary research, it is a type of study in which the researchers collect relevant data samples directly, rather than relying on previously collected data.  This type of research is focused on gaining content specific facts that can be sued to solve specific problems. Since the collected data is fresh and first hand therefore it makes the study more accurate and genuine.

We at SNS Insider have divided Primary Research into 2 parts.

Part 1 wherein we interview the KOLs of major players as well as the upcoming ones across various geographic regions. This allows us to have their view over the market scenario and acts as an important tool to come closer to the accurate market numbers. As many as 45 paid and unpaid primary interviews are taken from both the demand and supply side of the industry to make sure we land at an accurate judgement and analysis of the market.

This step involves the triangulation of data wherein our team analyses the interview transcripts, online survey responses and observation of on filed participants. The below mentioned chart should give a better understanding of the part 1 of the primary interview.

Primary Research

Part 2: In this part of primary research the data collected via secondary research and the part 1 of the primary research is validated with the interviews from individual consultants and subject matter experts.

Consultants are those set of people who have at least 12 years of experience and expertise within the industry whereas Subject Matter Experts are those with at least 15 years of experience behind their back within the same space. The data with the help of two main processes i.e., FGDs (Focused Group Discussions) and IDs (Individual Discussions). This gives us a 3rd party nonbiased primary view of the market scenario making it a more dependable one while collation of the data pointers.

Step 3: Data Bank Validation

Once all the information is collected via primary and secondary sources, we run that information for data validation. At our intelligence centre our research heads track a lot of information related to the market which includes the quarterly reports, the daily stock prices, and other relevant information. Our data bank server gets updated every fortnight and that is how the information which we collected using our primary and secondary information is revalidated in real time.

Data Bank Validation

Step 4: QA/QC Process

After all the data collection and validation our team does a final level of quality check and quality assurance to get rid of any unwanted or undesired mistakes. This might include but not limited to getting rid of the any typos, duplication of numbers or missing of any important information. The people involved in this process include technical content writers, research heads and graphics people. Once this process is completed the title gets uploader on our platform for our clients to read it.

Step 5: Final QC/QA Process:

This is the last process and comes when the client has ordered the study. In this process a final QA/QC is done before the study is emailed to the client. Since we believe in giving our clients a good experience of our research studies, therefore, to make sure that we do not lack at our end in any way humanly possible we do a final round of quality check and then dispatch the study to the client.

Key Segments:

By Type

  • Hand-Held

  • Stand-Alone

  • Multi-Parameter

By Application

  • Emergency Medicine

  • Pain Medicine

  • Procedural Sedation

  • Critical Care

  • Others

By End-Use

  • Hospitals

  • Ambulatory Care Centers

  • Others

By Technology

  • Mainstream

  • Sidestream

  • Microstream

Request for Segment Customization as per your Business Requirement: Segment Customization Request

Regional Coverage:

North America

  • US

  • Canada

  • Mexico

Europe

  • Eastern Europe

    • Poland

    • Romania

    • Hungary

    • Turkey

    • Rest of Eastern Europe

  • Western Europe

    • Germany

    • France

    • UK

    • Italy

    • Spain

    • Netherlands

    • Switzerland

    • Austria

    • Rest of Western Europe

Asia Pacific

  • China

  • India

  • Japan

  • South Korea

  • Vietnam

  • Singapore

  • Australia

  • Rest of Asia Pacific

Middle East & Africa

  • Middle East

    • UAE

    • Egypt

    • Saudi Arabia

    • Qatar

    • Rest of Middle East

  • Africa

    • Nigeria

    • South Africa

    • Rest of Africa

  • Latin America

  • Brazil

  • Argentina

  • Colombia

  • Rest of Latin America

Request for Country Level Research Report: Country Level Customization Request

Available Customization

With the given market data, SNS Insider offers customization as per the company’s specific needs. The following customization options are available for the report:

  • Product Analysis

  • Criss-Cross segment analysis (e.g. Product X Application)

  • Product Matrix which gives a detailed comparison of the product portfolio of each company

  • Geographic Analysis

  • Additional countries in any of the regions

  • Company Information

  • Detailed analysis and profiling of additional market players (Up to five)


  •            5000 (33% Discount)


  •            8950 (40% Discount)


  •            3050 (23% Discount)

Start a Conversation

Hi! Click one of our member below to chat on Phone