Capacity Management Market Report Scope & Overview:
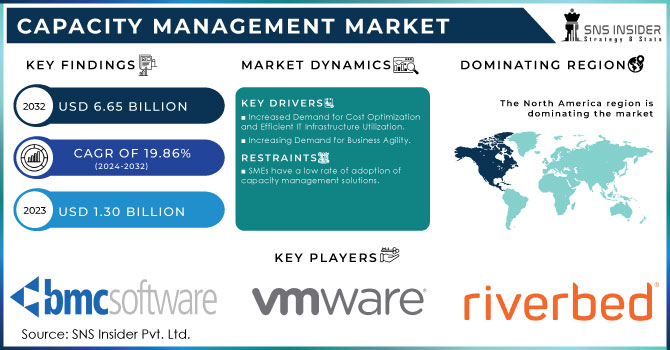
Capacity Management Market was valued at USD 1.63 billion in 2023 and is expected to reach USD 8.58 billion by 2032, growing at a CAGR of 20.33% from 2024-2032. This report provides information regarding improvements in operational efficiency, investment trends, customer adoption and satisfaction, with the regulatory impact shaping the market. It also looks at the rising adoption of AI/ML technologies in capacity management solutions. This is fueling the development of these factors, as it allows for optimization of resources, effective decision-making, and caters to the growing demand for scalable, flexible infrastructure across industries.
Get more information on Capacity Management Market - Request Sample Report
Market Dynamics
Drivers
-
Managing Complex IT Infrastructure for Efficient Resource Allocation and Performance Optimization
As organizations expand their IT systems and integrate advanced technologies, they face a surge in complexity, requiring comprehensive strategies to manage and optimize resources. The rapid adoption of hybrid cloud environments, AI, IoT, and big data analytics demands sophisticated capacity management to avoid performance bottlenecks, underutilization, or overprovisioning. This complexity makes it crucial for businesses to allocate and scale resources efficiently while maintaining high levels of service and performance. Additionally, optimizing capacity becomes essential for achieving cost savings and ensuring that IT infrastructure remains agile enough to meet the needs of dynamic workloads and changing business demands. The increased interdependence of systems further underscores the importance of effective capacity management solutions.
Restraints
-
High Implementation Costs Limit Adoption of Capacity Management Solutions for Small and Mid-Sized Businesses
The initial setup and integration of capacity management tools can be prohibitively expensive, particularly for small to mid-sized businesses. Such costs run from the buying of the applications to the appropriate hardware, sometimes system upgrades and maintenance. Another cost factor is the training of employees to utilize these tools efficiently, which will increase the expenses. Organizations with a small IT budget may not be willing to invest in these solutions because the cost may outweigh the perceived benefits. This high upfront cost makes it a very large barrier for many companies wanting to enhance their capacity management capabilities, especially compared to the potential long-term ROI.
Opportunities
-
Rising Demand for Capacity Management Solutions with the Shift to Cloud and Hybrid Infrastructures
As companies move to more cloud and hybrid infrastructures, the need for capacity management across a variety of infrastructures increases. Growing cloud adoption will bring about an even greater requirement for optimizing tools in resource-intensive usage to make sure that a business scales up or down to its needs while at the same time avoiding the potential of over-provisioning and under-utilization. This calls for increasing hybrid environments as an on-premises as well as a cloud-based combination. Companies need solutions in capacity management to provide them with visibility, control, and optimization across multiple platforms, maximizing the efficiency of the resources available while reducing costs. This trend thus presents tremendous growth opportunities for the providers of cloud and hybrid-capable capacity management tools.
Challenges
-
Challenges in Gathering and Processing Accurate Real-Time Data for Effective Capacity Management
Accurate, real-time data on resource usage is crucial for effective capacity management, enabling organizations to monitor performance and optimize resources. However, aggregating and processing this data creates a significant barrier. Many organizations face challenges in collecting consistent and updated information from various systems and platforms, particularly in complex multi-cloud and hybrid environments. Data may be siloed or fragmented, creating difficulties in achieving a holistic view of resource utilization. Moreover, processing large volumes of real-time data requires advanced analytics and robust infrastructure, which can be difficult to implement. Without reliable and prompt data, any business may likely experience inefficiency in decision making and may forfeit opportunities on optimization.
Segment Analysis
By Component
The Solutions segment dominated the Capacity Management Market with the highest revenue share of about 65% in 2023 due to the increasing demand for advanced tools that optimize resource allocation, performance, and scalability across complex IT infrastructures. The Services segment is anticipated to grow at the fastest CAGR of approximately 21.73% from 2024-2032 due to increasing requirements for consulting, implementation, and ongoing support services to ensure efficient integration and management of capacity management solutions in constantly changing IT environments.
By Organization Size
The Large Enterprises segment dominated the Capacity Management Market with the highest revenue share of about 57% in 2023 due to their extensive and complex IT infrastructures, which require advanced capacity management solutions for optimization and scalability. The Small and Medium-sized Enterprises segment is expected to grow at the fastest CAGR of about 21.56% from 2024-2032, driven by the increasing adoption of cost-effective, scalable capacity management solutions as SMEs digitalize their operations and expand their IT environments.
By Deployment Type
The On-premises segment dominated the Capacity Management Market with the highest revenue share of about 61% in 2023, as many organizations continue to rely on traditional infrastructure for critical operations and prefer maintaining control over their IT resources. The Cloud segment is expected to grow at the fastest CAGR of about 21.55% from 2024-2032, driven by the increasing shift towards cloud computing, offering businesses scalability, flexibility, and cost-efficient capacity management solutions in dynamic environments.
By Vertical
The Information Technology and Telecom segment dominated the market, earning the highest revenue share of around 31% in 2023 because the sector is highly dependent on robust IT infrastructures and needs effective resource management to accommodate growing data traffic and operations. The Healthcare segment is expected to grow at the fastest CAGR of about 24.59% from 2024-2032, driven by the increasing adoption of digital health technologies, cloud-based solutions, and the need for scalable capacity management to support evolving healthcare systems and patient data.
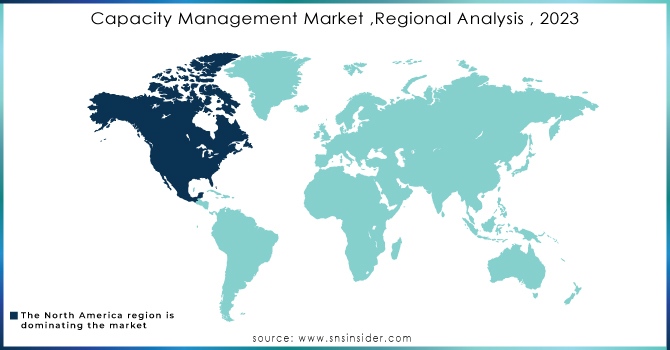
Regional Analysis
North America accounted for the highest revenue share of approximately 41% in 2023. The reasons are well developed technological infrastructure in the region, extensive cloud and hybrid environments adoption, and large IT companies which innovate for these regions. Also, highly established industries, such as health care, finance, and telecommunications, require very complex capacity management solutions to utilize their resources at an optimal level with high efficiency.
Asia Pacific expected to grow at the fastest CAGR of around 22.56% from 2024-2032. Its growth is led by the exponential increase in its digital transformation endeavors, cloud adoption, and a smart technology push across industries. With businesses in the emerging economies putting heavy investments into IT infrastructure to cater for the demanding digital economy, the need for efficient capacity management solutions becomes more crucial in positioning Asia Pacific for accelerated market expansion.
Need any Custom Research/Data on Capacity Management Market - Enquiry Now
Key Players
-
BMC Software, Inc. (TrueSight Capacity Optimization, BMC Helix ITSM)
-
CA Technologies (CA Capacity Management, CA Performance Management)
-
NetApp (Cloud Insights, OnCommand Insight)
-
Riverbed Technology (SteelCentral, Riverbed Cloud)
-
Hewlett Packard Enterprise Development LP (HPE OneView, HPE InfoSight)
-
TEOCO Corporation (Smart Capacity, NetAct)
-
VMware, Inc. (vRealize Operations, VMware vSphere)
-
Sumerian (Sumerian Cloud Optimization, Sumerian Capacity Management)
-
Syncsort (DMX, Ironstream)
-
TeamQuest Corporation (TeamQuest Capacity Management, TeamQuest Performance Management)
-
Nlyte (Nlyte Capacity Management, Nlyte Data Center Management)
-
CPT Global (CPT Capacity Management, CPT IT Monitoring)
-
Neubrain, LLC. (Neubrain Capacity Planning, Neubrain Cloud Analytics)
-
Axway (Axway Amplify, Axway IT Management)
-
IDERA, Inc. (SQL Diagnostic Manager, IDERA Capacity Management)
-
SolarWinds Worldwide, LLC. (SolarWinds Server & Application Monitor, SolarWinds Virtualization Manager)
-
Turbonomic, Inc. (Turbonomic Hybrid Cloud, Turbonomic IT Operations)
-
Aspire Technology (Aspire Capacity Planning, Aspire Resource Management)
-
ASG Technologies (ASG-Enterprise Capacity Management, ASG-Performance Management)
-
Zoho Corp (Zoho Analytics, Zoho IT Management)
-
Planview, Inc. (Planview Enterprise One, Planview PPM Pro)
-
HelpSystems (Automate, Capacity Manager)
-
Cisco Systems (Cisco Prime Data Center, Cisco Workload Optimization)
-
IBM (IBM Cloud Pak for Automation, IBM Capacity Performance Management)
-
Broadcom (CA Capacity Management, Broadcom Performance Management)
Recent Developments
-
In 2025, Broadcom's CA Capacity Management 2.9.4 enhanced capacity analysis for mainframe, open systems, and cloud environments, offering model-based forecasting and optimized asset utilization to improve resource planning and performance.
-
In 2024, IBM introduced IBM Z IntelliMagic Vision for z/OS, an advanced AI-driven performance management solution aimed at enhancing mainframe performance analytics, providing deeper insights and faster issue resolution for z/OS infrastructure.
| Report Attributes | Details |
|---|---|
| Market Size in 2023 | USD 1.63 Billion |
| Market Size by 2032 | USD 8.58 Billion |
| CAGR | CAGR of 20.33% From 2024 to 2032 |
| Base Year | 2023 |
| Forecast Period | 2024-2032 |
| Historical Data | 2020-2022 |
| Report Scope & Coverage | Market Size, Segments Analysis, Competitive Landscape, Regional Analysis, DROC & SWOT Analysis, Forecast Outlook |
| Key Segments | • By Component (Solutions, Services) • By Organization Size (Small and Medium-sized Enterprises, Large Enterprises) • By Deployment Type (On-premises, Cloud) • By Vertical (Information Technology and Telecom, Healthcare, Manufacturing, BFSI, Retail, Government and Public, Others) |
| Regional Analysis/Coverage | North America (US, Canada, Mexico), Europe (Eastern Europe [Poland, Romania, Hungary, Turkey, Rest of Eastern Europe] Western Europe] Germany, France, UK, Italy, Spain, Netherlands, Switzerland, Austria, Rest of Western Europe]), Asia Pacific (China, India, Japan, South Korea, Vietnam, Singapore, Australia, Rest of Asia Pacific), Middle East & Africa (Middle East [UAE, Egypt, Saudi Arabia, Qatar, Rest of Middle East], Africa [Nigeria, South Africa, Rest of Africa], Latin America (Brazil, Argentina, Colombia, Rest of Latin America) |
| Company Profiles | BMC Software, Inc., CA Technologies, NetApp, Riverbed Technology, Hewlett Packard Enterprise Development LP, TEOCO Corporation, VMware, Inc., Sumerian, Syncsort, TeamQuest Corporation, Nlyte, CPT Global, Neubrain, LLC., Axway, IDERA, Inc., SolarWinds Worldwide, LLC., Turbonomic, Inc., Aspire Technology, ASG Technologies, Zoho Corp, Planview, Inc., HelpSystems, Cisco Systems, IBM, Broadcom. |
