CAD and PLM Software Market Report Scope & Overview:
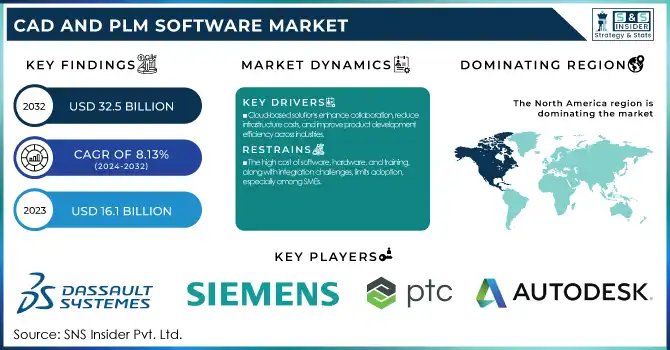
The CAD and PLM Software Market was valued at USD 16.1 Billion in 2023 and is expected to reach USD 32.5 Billion by 2032, growing at a CAGR of 8.13% from 2024-2032. With improved automation and functionality, driven by AI in Design, the CAD and PLM Software Market is changing to enable high usage through greater productivity. The analysis of user demographics suggests that while large enterprises remain the number one users there is significant growth among SME as well, with cloud-based solutions increasing adoption. A cross-cutting integration of design, simulation, and manufacturing workflows is cementing a more predictive and collaborative, real-time decision-making approach. The report consists of artificial intelligence, Auto ML, Automation trends in PLM driven by AI, Driven PLM adoption based on Sustainability trends, CAD-specific advancements, and Digital twin influence on product lifecycle management.
To get more information on CAD and PLM Software Market - Request Free Sample Report
Market Dynamics
Drivers
-
Cloud-based solutions enhance collaboration, reduce infrastructure costs, and improve product development efficiency across industries.
The adoption of cloud-based CAD and PLM software is steadily increasing especially for their flexibility, scalability, and cost-effectiveness. Unlike traditional on-premise systems, cloud solutions offer remote access making it easy for engineers, designers, and stakeholders to work together in real-time from anywhere across the globe. It helps in improving the workflow efficiency and reduces the product development cycles. Furthermore, by reducing infrastructure costs, cloud-based solutions do not need any expansive hardware and traffic maintenance. AI and advanced analytics as well as digital twin technology are finding their way into the cloud to optimize design, prototyping, and lifecycle management of products and services for and by businesses. Hence, they are foraying all sectors like aerospace, automotive, industrials, and others towards cloud adoption at an accelerated pace to boost operational efficiency.
Restraints
-
The high cost of software, hardware, and training, along with integration challenges, limits adoption, especially among SMEs.
The most difficult hurdle to overcome in starting up with CAD and PLM software is the upfront costs usually associated with software licensing, hardware upgrades, and employee training. SMEs typically do not have large budgets to implement these solutions. Besides that, integrating CAD and PLM software with existing enterprise systems such as ERP, with MES, may also be a difficult and time-consuming process. however forced transition from legacy systems may also derail the running of projects, and employees may resist the change as it requires much training in unfamiliar territories. These financial and technical constraints decelerate the growth of this market, especially for cost-sensitive industries.
Opportunity
-
AI-driven automation, IoT connectivity, and digital twins optimize design accuracy, predictive maintenance, and operational efficiency.
The growing focus and integration of AI, IoT, and digital twin technology are transforming the CAD and PLM software market domain while creating growth avenues for the market players. Predicting possible mistakes and recommending the best changes is how AI-based automation improves design accuracy. By using IoT, we can track how our products are used in real-time, since all kinds of sensors are embedded in physical assets, it can send data that we can integrate into product performance. Because of this, predictive maintenance is made possible, downtime is decreased and efficiency is increased. On the opposite end, digital twins are virtual copies of products or processes that enable engineers to replicate real-life environments and test designs before the production cycle. This in turn is leading to demand for next-generation CAD and PLM solutions particularly in high-tech sectors such as aerospace, healthcare, and automotive.
Challenge
-
Cloud-based CAD and PLM solutions face cybersecurity threats, requiring robust encryption and compliance measures to protect sensitive data.
With businesses adopting cloud-driven CAD and PLM solutions, safeguarding against cybersecurity threats and protecting intellectual property (IP) are emerging as key issues. The storage of sensitive design files and proprietary product information in the cloud opens up the opportunity for data theft through a data breach, hacking, and other forms of unauthorized access. Firms in the fields of confidential product designs, for example, protection, aviation, and pharmaceuticals require strict security protocols to protect their IP. Moreover, international regulations like GDPR, and ISO data protection standards have tightly regulated compliance for software vendors and enterprises. It gives the manufacturing industry a series of challenges, which companies must meet by investing in advanced encryption, access control mechanisms, and cybersecurity protocols, whilst ensuring unhindered collaboration and workflow efficiency.
Segment Analysis
By Deployment
The cloud segment dominated the market and accounted for a revenue share of more than 68% in 2023, which has rapidly gained popularity thanks to its scalability, accessibility, and cost-effectiveness. Cloud solutions are getting popular by the day in the business world by freeing businesses from high upfront infrastructure investment and providing hassle-free collaboration amongst teams across the globe. Frequent software updates, integration with AI-based analytics, and improved data security also stimulate adoption. Cloud-based PLM is increasingly adopted in automotive, aerospace, electronics, and other industries, where real-time data sharing and process automation is a necessity. This segment is further anticipated to remain the dominating segment during the forecast period, due to ever-evolving cybersecurity mechanisms and rising adoption of hybrid cloud models.
The on-premise segment is expected to register the fastest CAGR during the forecast period, attributed to the increasing focus on data security and compliance. On-premise deployments are ideal for industries that deal with sensitive intellectual property — think defense and high-tech manufacturing — as they put data fully under the control of the concerned organization. The customization features of on-premise solutions are also likely to garner more interest from enterprises with complex product lifecycle management requirements. Though cloud acceptance is increasing, compliance regulations in some regions require data to be stored locally, helping on-premise software growth. Increasing investment in secure, on-premise CAD and PLM As cybersecurity threats change, investment in secure, on-premise CAD and PLM systems is expected to increase.
By Industry
The discrete industries dominated the market and accounted for significant revenue share, because of the complex product designs and the high occurrence of prototyping in these industries. Such industries need sophisticated design, simulation, and lifecycle management tools to simplify the production process while ensuring regulatory compliance. Moreover, the trend of mass customization along with a short product life cycle requires strong integration of a Product Lifecycle Management system. For every other industry sealed — except ours — there will be new & greater ways to connect as AI, automation, and real-time collaboration mechanics continue to improve and automate. This is what industry means, all good and new is pouring into the absolute host for the complete step of coming decades.
The Process Industries segment is expected to register the fastest CAGR during the forecast period, due to the increasing demand for effective product lifecycle management in regulated environments. To optimize processes or make them compliant with regulations, or simply initiatives of sustainability, these industries are leveraging CAD and PLM software these days. Further, increased efficiency, waste minimization, and evidence-based decision-making impacts market growth.
Regional Analysis
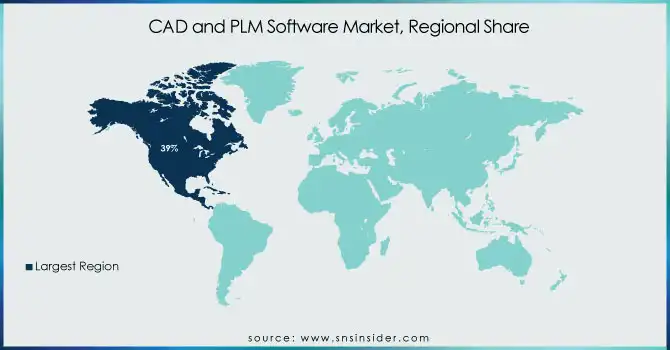
North America dominated the market and accounted for 39% of the revenue share, owing to the strong presence of major industry players, advanced manufacturing ecosystem, and high adoption of the digital transformation strategy. Continuous innovations in AI, IoT, and cloud computing, further leverage PLM and CAD capabilities in the region. U.S./Canada automotive, aerospace, and industrial machinery segments are fueling demand for advanced design and lifecycle management solutions. The adoption of Industry 4.0 and smart manufacturing due to government initiatives, and investment in R&D will further strengthen the market in North America.
The Asia-Pacific region is projected to have the fastest CAGR, due to rapid industrialization, growing infrastructure projects, and the growth of the automotive and electronics industry. Smart manufacturing and digitization are gaining more prominence among countries such as China, India, Japan, and South Korea and are also accelerating the adoption of software. Simultaneously, the increasing number of small and medium-sized enterprises adopting cloud-based PLM solutions is also significantly powering the growth as well. Furthermore, the rapidly growing demand for CAD and PLM technologies is driven by government initiatives supporting innovation like "Make in India" and "Made in China 2025" initiatives and Industry 4.0.
Get Customized Report as per Your Business Requirement - Enquiry Now
Key Players
The major key companies of CAD and PLM Software are
-
Dassault Systemes – CATIA
-
Siemens Digital Industries Software – Teamcenter
-
PTC Inc. – Windchill
-
Autodesk Inc. – Fusion 360
-
Hexagon AB – PPM SmartPlant
-
Bentley Systems – MicroStation
-
ANSYS Inc. – ANSYS SpaceClaim
-
Altair Engineering Inc. – Altair HyperWorks
-
AVEVA Group – AVEVA E3D Design
-
Oracle Corporation – Agile PLM
-
SAP SE – SAP PLM
-
Aras Corporation – Aras Innovator
-
IronCAD LLC – IronCAD Design Collaboration Suite
-
Siemens EDA (formerly Mentor Graphics) – Xpedition Enterprise
-
ZWSoft – ZWCAD
Recent Developments
-
In February 2024, Cadence launched the Millennium Enterprise Multiphysics Platform, designed for creating digital twins, enhancing simulation capabilities for complex systems.
-
In July 2024, PTC forecasted higher-than-expected fourth-quarter revenue and profit, attributing growth to increased demand for its industrial software solutions.
|
Report Attributes |
Details |
|
Market Size in 2023 |
USD 16.1 Billion |
|
Market Size by 2032 |
USD 32.5 Billion |
|
CAGR |
CAGR of 8.13% From 2024 to 2032 |
|
Base Year |
2023 |
|
Forecast Period |
2024-2032 |
|
Historical Data |
2020-2022 |
|
Report Scope & Coverage |
Market Size, Segments Analysis, Competitive Landscape, Regional Analysis, DROC & SWOT Analysis, Forecast Outlook |
|
Key Segments |
• By Deployment (On-premise, Cloud) |
|
Regional Analysis/Coverage |
North America (US, Canada, Mexico), Europe (Eastern Europe [Poland, Romania, Hungary, Turkey, Rest of Eastern Europe] Western Europe] Germany, France, UK, Italy, Spain, Netherlands, Switzerland, Austria, Rest of Western Europe]), Asia Pacific (China, India, Japan, South Korea, Vietnam, Singapore, Australia, Rest of Asia Pacific), Middle East & Africa (Middle East [UAE, Egypt, Saudi Arabia, Qatar, Rest of Middle East], Africa [Nigeria, South Africa, Rest of Africa], Latin America (Brazil, Argentina, Colombia, Rest of Latin America) |
|
Company Profiles |
Dassault Systemes, Siemens Digital Industries Software, PTC Inc., Autodesk Inc., Hexagon AB, Bentley Systems, ANSYS Inc., Altair Engineering Inc., AVEVA Group, Oracle Corporation, SAP SE, Aras Corporation, IronCAD LLC, Siemens EDA (formerly Mentor Graphics), ZWSoft |
