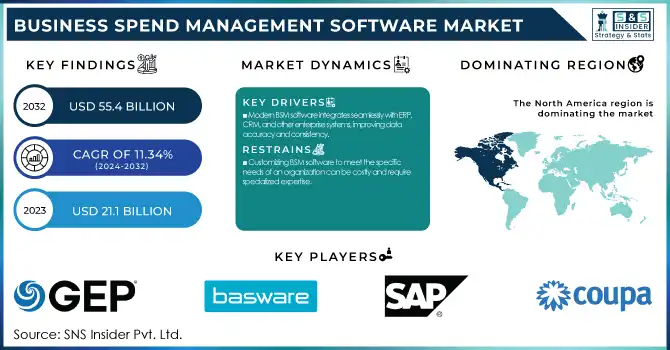
The Business Spend Management Software Market was valued at USD 21.1 Billion in 2023 and is expected to reach USD 55.4 Billion by 2032, growing at a CAGR of 11.34% from 2024-2032.
To get more information on Business Spend Management Software Market - Request Free Sample Report
Growing demand for operational efficiency, implementation of cost optimization strategies, and the need for better control over organizational financial operations are some driving factors boosting the growth of the Business Spend Management Software market. Business Spend Management software delivers a broader experience with integrated solutions for procurement, expenses, invoicing, and supplier relationship management helping the company automate finance workflows and gain better visibility into spending. The rising need to automate manual processes and eliminate financial management inefficiencies amongst organizations that prioritize digital transformation has led to the outsized demand for BSM software.
The growing cost optimization pressure for businesses is a key factor driving the Business Spend Management Software market growth. Organizations are looking to get their contracts signed for the best price and improve overall spending improvement in a highly competitive atmosphere. BSM software helps businesses examine overspending, take corrective actions to save costs and achieve a return on investment. In addition, increasing global complexity in regulations and compliance is driving the need for companies to implement solutions that will support compliance with financial and procurement policies. By defining the corporate policy, BSM helps maintain compliance and get spending in line with corporate policies.
Increasing adoption of cloud-based solutions is another key factor triggering market growth. By removing the need for large on-premise infrastructure, BSM software in the cloud is more accessible, scalable, and cost-effective. In addition to improving data accuracy and consistency, the integration capabilities of modern BSM software enable seamless connectivity with other enterprise systems, such as enterprise resource planning and customer relationship management platforms. Soaring utilization of artificial intelligence and machine learning in business service management solutions also fuels the growth of the market. These technologies include predictive analytics that can help businesses anticipate spending patterns and make wiser choices.
Market Dynamis
Drivers
Modern BSM software integrates seamlessly with ERP, CRM, and other enterprise systems, improving data accuracy and consistency.
Modern BSM solutions are designed to be highly integrative with other enterprise systems such as ERP and CRM systems for enhanced data accuracy and consistency. Organizations can integrate BSM software with ERP systems to ensure monetary, procurement, and vendor management data is connected and updated constantly between departments. For companies with high transaction volumes, this integration helps eliminate manual entry, thus minimizing the risk of errors and inconsistencies.
Also, it helps in maintaining better supplier relationships and optimization of procurement strategies through integration with CRM systems. Real-time access to customer and supplier data enables organizations to take advantage of efficiencies through informed pricing decisions, contract terms, and payment conditions so they can take greater control of spending and improve supplier management.
The ease of connecting BSM software with departmental enterprise systems speeds up collaboration among teams. Here is the answer to that question: Finance, procurement, and operations teams can work from a single view of spending data to find inefficiencies and potential areas to cut costs. The integration of financial and procurement data provides consistency across reports and forecasts. As a result, companies are empowered to make better decisions, meet compliance needs and drive operational effectiveness, with improved control of their budget.
Cloud-based BSM software offers scalability, cost-effectiveness, and easier access, reducing the need for on-premises infrastructure.
Demand for mobile solutions enables employees to manage expenses and approvals on the go, boosting productivity and engagement.
Restraints
Customizing BSM software to meet the specific needs of an organization can be costly and require specialized expertise.
Tailoring BSM software to capture the diverse data specific to an organization is often an expensive and complicated process, needing a special set of skills. Although packaged BSM solutions create a broad set of functionalities, they often fall short for organizations with highly customized procurement processes integrated with complicated financial workflows and compliance requirements. Such personalization can include changing the user interface of the software, customizing it to the current systems, and adding features that are not a part of the original software. This leads to expensive trainers and third-party consultants needing to implement it. The need for specialized expertise further complicates the situation, increasing costs for organizations. They may need to hire professionals familiar with the specific BSM software or rely on vendors with extensive knowledge of the platform. Additionally, the customization process can be time-consuming, often disrupting business operations.
Additionally, companies should also consider the long-term expenses involved in maintaining and upgrading the tailored solution. Ongoing costs may also be generated because, as the software changes, updates or added features may need to be accommodated in the customized solution. Such continuous investment can prove to be a considerable roadblock for small businesses with little budget, constraining them to best leverage the BSM software without parting a fortune. Thus, the unique cost & complexity of customization become the principal BSM software adoption obstacle for any organization with limited resources.
The initial investment and ongoing maintenance costs of BSM software can be prohibitive, especially for small and medium-sized businesses.
Some BSM software solutions may not scale effectively as organizations grow, leading to potential limitations in managing increased transaction volumes.
By Deployment
The cloud segment dominated the Business Spend Management software market and represented a revenue share of more than 68% in 2023, on account of the scalability, affordability, and convenience of the software. With cloud solutions, businesses do not have to spend heavily to gain the infrastructure, they can simply grow with their needs. Remote, device-agnostic BSM software access has been a critical benefit amid growing remote and mobile business trends. In addition, BSM solutions provided via the cloud might come with automatic updates so that businesses will have access to the latest features and security patches. Given the increasing focus of organizations on digital transformation, the need for cloud solutions will go further.
The on-premise segment is expected to register the fastest CAGR during the forecast period, as organizations opt for more control over their data and infrastructure. On-premise provides a higher degree of flexibility and security, which is especially suitable for organizations that need to meet strict compliance or handle sensitive information. Some of the larger enterprises, on the other hand, are leaning towards on-premise solutions so that they can be better integrated with their existing IT systems. The on-premise segment is expected to witness moderate growth in the coming years, especially among large enterprises and industries with high data security requirements including financial and healthcare sectors.
By Enterprise Size
The large enterprise segment dominated the market and accounted for a revenue share of more than 64% in 2023, due to their more complex procurement needs, broader business operations, and greater financial resources. These organizations require scalable, customizable solutions to support high transaction volumes and easy connectivity with existing enterprise systems. Business Spend Management software helps enterprises large and small maximize spending, remain compliant, and automate procurement processes. With ongoing digital transformation and increasing operational efficiency, BSM software in this segment is anticipated to be in high demand through the forecast period. As time goes on, large enterprises will start utilizing advanced features, like AI-driven analytics and predictive capabilities, stimulating the sending up of the archway.
The small and medium enterprises segment is expected to register the fastest compound annual growth rate in the BSM software market due to the increasing demand for cost management and financial optimization from these enterprises. Under rising pressure to cut operational expenses and enhance procurement efficiency, SMEs are switching to economically attractive, scalable BSM solutions. However, the advent of cloud-based BSM software has made these solutions far more accessible because it has removed the costly on-premise infrastructure. SMEs, while in digital transformation, are using tools to automate manual processes and visibility over spend. That said, it's a bright future for the SME segment with a lot of growth expected as relatively cheap and easy-to-implement BSM solutions become more available.
Regional Analysis
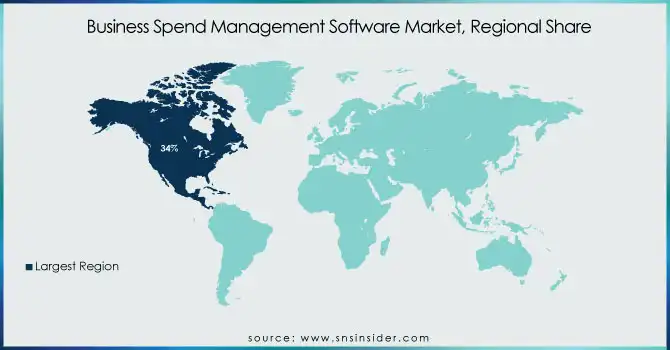
North America dominated the market and represented a revenue share of more than 34%, owing to the presence of a large number of big enterprises, well-developed technology infrastructure, and significant digitization trends. Established financial and regulatory frameworks in the region encourage the use of BSM software. The increasing need for businesses across North America to optimize operational capabilities, cost, and regulatory adherence is driving the market for BSM solutions. In addition, the rising utilization of AI, machine learning, and automation over BSM software is also anticipated to contribute to market growth. North America is expected to register the highest market revenue during the forecast period, owing to the high rate of innovation and growing adoption of advanced BSM technologies.
Asia-Pacific is expected to register the fastest compound annual growth rate, mainly due to the rapid economic development, digital transformation, and increasing numbers of SMEs. The growing need for optimization of costs, procurement efficiency, and financial control by businesses in APAC is driving the demand for BSM software at an unprecedented pace. Moreover, the rise of cloud-based BSM solutions has made BSM tools more accessible to organizations of all sizes. The emphasis on enhanced supply chain management and procurement processes in the region is further driving the demand for BSM software.
Get Customized Report as per Your Business Requirement - Enquiry Now
The major players in the market are GEP, Basware, SAP, Oracle, Coupa, Zycus, Ivalua, Jaggaer, Tradeshift, SynerTrade, Proactis, SciQuest, Ariba Network and others in the final report.
Recent Development:
January 2024: Coupa Software announced the integration of advanced artificial intelligence (AI) capabilities into its spend management platform, aiming to enhance predictive analytics and automate procurement processes.
March 2024: SAP SE unveiled a new version of SAP Ariba, featuring enhanced user interfaces and improved supplier collaboration tools to streamline procurement workflows.
May 2024: Oracle Corporation introduced Oracle Procurement Cloud 2.0, offering advanced analytics and machine learning features to optimize spend management and supplier performance.
|
Report Attributes |
Details |
|
Market Size in 2023 |
USD 21.1 Bn |
|
Market Size by 2031 |
USD 55.4 Bn |
|
CAGR |
CAGR of 11.34% From 2024 to 2032 |
|
Base Year |
2023 |
|
Forecast Period |
2024-2032 |
|
Historical Data |
2020-2022 |
|
Report Scope & Coverage |
Market Size, Segments Analysis, Competitive Landscape, Regional Analysis, DROC & SWOT Analysis, Forecast Outlook |
|
Key Segments |
• By Solution (Procure-to-Pay Solutions, Supplier & Risk Management, Travel & Expense Management, Contract & e-Tender Management, Spend Management/Spend Analytics,Others) |
|
Regional Analysis/Coverage |
North America (US, Canada, Mexico), Europe (Eastern Europe [Poland, Romania, Hungary, Turkey, Rest of Eastern Europe] Western Europe] Germany, France, UK, Italy, Spain, Netherlands, Switzerland, Austria, Rest of Western Europe]), Asia Pacific (China, India, Japan, South Korea, Vietnam, Singapore, Australia, Rest of Asia Pacific), Middle East & Africa (Middle East [UAE, Egypt, Saudi Arabia, Qatar, Rest of Middle East], Africa [Nigeria, South Africa, Rest of Africa], Latin America (Brazil, Argentina, Colombia, Rest of Latin America) |
|
Company Profiles |
SAP, Oracle, Coupa, Zycus, Ivalua, Jaggaer, GEP, Basware, Tradeshift, SynerTrade, Proactis, SciQuest, Ariba Network |
|
Key Drivers |
• Cloud-based BSM software offers scalability, cost-effectiveness, and easier access, reducing the need for on-premises infrastructure. |
|
Restraints |
• The initial investment and ongoing maintenance costs of BSM software can be prohibitive, especially for small and medium-sized businesses. |
Ans: The initial investment and ongoing maintenance costs of BSM software can be prohibitive, especially for small and medium-sized businesses.
Ans: Cloud-based BSM software offers scalability, cost-effectiveness, and easier access, reducing the need for on-premises infrastructure.
Ans: Asia-Pacific is expected to register the fastest CAGR during the forecast period.
Ans: The CAGR of the Business Spend Management Software Market during the forecast period is 11.34% from 2024-2032.
Ans: The Business Spend Management Software Market was valued at USD 21.1 Billion in 2023 and is expected to reach USD 55.4 Billion by 2032, growing at a CAGR of 11.34% from 2024-2032.
1. Introduction
1.1 Market Definition
1.2 Scope (Inclusion and Exclusions)
1.3 Research Assumptions
2. Executive Summary
2.1 Market Overview
2.2 Regional Synopsis
2.3 Competitive Summary
3. Research Methodology
3.1 Top-Down Approach
3.2 Bottom-up Approach
3.3. Data Validation
3.4 Primary Interviews
4. Market Dynamics Impact Analysis
4.1 Market Driving Factors Analysis
4.1.1 Drivers
4.1.2 Restraints
4.1.3 Opportunities
4.1.4 Challenges
4.2 PESTLE Analysis
4.3 Porter’s Five Forces Model
5. Statistical Insights and Trends Reporting
5.1 Feature Analysis, 2023
5.2 User Demographics, 2023
5.3 Integration Capabilities, by Software, 2023
5.4 Impact on Decision-making
6. Competitive Landscape
6.1 List of Major Companies, By Region
6.2 Market Share Analysis, By Region
6.3 Product Benchmarking
6.3.1 Product specifications and features
6.3.2 Pricing
6.4 Strategic Initiatives
6.4.1 Marketing and promotional activities
6.4.2 Distribution and supply chain strategies
6.4.3 Expansion plans and new product launches
6.4.4 Strategic partnerships and collaborations
6.5 Technological Advancements
6.6 Market Positioning and Branding
7. Business Spend Management Software Market Segmentation, by Solution
7.1 Chapter Overview
7.2 Procure-to-Pay Solutions
7.2.1 Procure-to-Pay Solutions Market Trends Analysis (2020-2032)
7.2.2 Procure-to-Pay Solutions Market Size Estimates and Forecasts to 2032 (USD Billion)
7.3Supplier & Risk Management
7.3.1Supplier & Risk Management Market Trends Analysis (2020-2032)
7.3.2Supplier & Risk Management Market Size Estimates and Forecasts to 2032 (USD Billion)
7.4Travel & Expense Management
7.4.1Travel & Expense Management Market Trends Analysis (2020-2032)
7.4.2Travel & Expense Management Market Size Estimates and Forecasts to 2032 (USD Billion)
7.5Contract & e-Tender Management
7.5.1Contract & e-Tender Management Market Trends Analysis (2020-2032)
7.5.2Contract & e-Tender Management Market Size Estimates and Forecasts to 2032 (USD Billion)
7.6Spend Management/Spend Analytics
7.6.1Spend Management/Spend Analytics Market Trends Analysis (2020-2032)
7.6.2Spend Management/Spend Analytics Market Size Estimates and Forecasts to 2032 (USD Billion)
7.7Others
7.7.1Others Market Trends Analysis (2020-2032)
7.7.2Others Market Size Estimates and Forecasts to 2032 (USD Billion)
8. Business Spend Management Software Market Segmentation, by Deployment
8.1 Chapter Overview
8.2 Cloud
8.2.1 Cloud Market Trends Analysis (2020-2032)
8.2.2 Cloud Market Size Estimates and Forecasts to 2032 (USD Billion)
8.3 On-Premise
8.3.1 On-Premise Market Trends Analysis (2020-2032)
8.3.2 On-Premise Market Size Estimates and Forecasts to 2032 (USD Billion)
9. Business Spend Management Software Market Segmentation, by Enterprise Type
9.1 Chapter Overview
9.2 Large Enterprise
9.2.1 Large Enterprise Market Trends Analysis (2020-2032)
9.2.2 Large Enterprise Market Size Estimates and Forecasts to 2032 (USD Billion)
9.3 SMEs
9.3.1 SMEs Market Trends Analysis (2020-2032)
9.3.2 SMEs Market Size Estimates and Forecasts to 2032 (USD Billion)
10. Business Spend Management Software Market Segmentation, by End-Use
10.1 Chapter Overview
10.2 Hospitality
10.2.1 Hospitality Market Trends Analysis (2020-2032)
10.2.2 Hospitality Market Size Estimates and Forecasts to 2032 (USD Billion)
10.3 BFSI
10.3.1 BFSI Market Trends Analysis (2020-2032)
10.3.2 BFSI Market Size Estimates and Forecasts to 2032 (USD Billion)
10.4 Healthcare
10.4.1 Healthcare Market Trends Analysis (2020-2032)
10.4.2 Healthcare Market Size Estimates and Forecasts to 2032 (USD Billion)
10.5 Energy & Utility
10.5.1 Energy & Utility Market Trends Analysis (2020-2032)
10.5.2 Energy & Utility Market Size Estimates and Forecasts to 2032 (USD Billion)
10.6 IT & Telecom
10.6.1 IT & Telecom Market Trends Analysis (2020-2032)
10.6.2 IT & Telecom Market Size Estimates and Forecasts to 2032 (USD Billion)
10.7 Retail & E-commerce
10.7.1 Retail & E-commerce Market Trends Analysis (2020-2032)
10.7.2 Retail & E-commerce Market Size Estimates and Forecasts to 2032 (USD Billion)
10.8 Others
10.8.1 Others Market Trends Analysis (2020-2032)
10.8.2 Others Market Size Estimates and Forecasts to 2032 (USD Billion)
11. Regional Analysis
11.1 Chapter Overview
11.2 North America
11.2.1 Trends Analysis
11.2.2 North America Business Spend Management Software Market Estimates and Forecasts, by Country (2020-2032) (USD Billion)
11.2.3 North America Business Spend Management Software Market Estimates and Forecasts, by Solution (2020-2032) (USD Billion)
11.2.4 North America Business Spend Management Software Market Estimates and Forecasts, by Deployment (2020-2032) (USD Billion)
11.2.5 North America Business Spend Management Software Market Estimates and Forecasts, by Enterprise Type (2020-2032) (USD Billion)
11.2.6 North America Business Spend Management Software Market Estimates and Forecasts, by End-Use (2020-2032) (USD Billion)
11.2.7 USA
11.2.7.1 USA Business Spend Management Software Market Estimates and Forecasts, by Solution (2020-2032) (USD Billion)
11.2.7.2 USA Business Spend Management Software Market Estimates and Forecasts, by Deployment (2020-2032) (USD Billion)
11.2.7.3 USA Business Spend Management Software Market Estimates and Forecasts, by Enterprise Type (2020-2032) (USD Billion)
11.2.7.4 USA Business Spend Management Software Market Estimates and Forecasts, by End-Use (2020-2032) (USD Billion)
11.2.8 Canada
11.2.8.1 Canada Business Spend Management Software Market Estimates and Forecasts, by Solution (2020-2032) (USD Billion)
11.2.8.2 Canada Business Spend Management Software Market Estimates and Forecasts, by Deployment (2020-2032) (USD Billion)
11.2.8.3 Canada Business Spend Management Software Market Estimates and Forecasts, by Enterprise Type (2020-2032) (USD Billion)
11.2.8.4 Canada Business Spend Management Software Market Estimates and Forecasts, by End-Use (2020-2032) (USD Billion)
11.2.9 Mexico
11.2.9.1 Mexico Business Spend Management Software Market Estimates and Forecasts, by Solution (2020-2032) (USD Billion)
11.2.9.2 Mexico Business Spend Management Software Market Estimates and Forecasts, by Deployment (2020-2032) (USD Billion)
11.2.9.3 Mexico Business Spend Management Software Market Estimates and Forecasts, by Enterprise Type (2020-2032) (USD Billion)
11.2.9.4 Mexico Business Spend Management Software Market Estimates and Forecasts, by End-Use (2020-2032) (USD Billion)
11.3 Europe
11.3.1 Eastern Europe
11.3.1.1 Trends Analysis
11.3.1.2 Eastern Europe Business Spend Management Software Market Estimates and Forecasts, by Country (2020-2032) (USD Billion)
11.3.1.3 Eastern Europe Business Spend Management Software Market Estimates and Forecasts, by Solution (2020-2032) (USD Billion)
11.3.1.4 Eastern Europe Business Spend Management Software Market Estimates and Forecasts, by Deployment (2020-2032) (USD Billion)
11.3.1.5 Eastern Europe Business Spend Management Software Market Estimates and Forecasts, by Enterprise Type (2020-2032) (USD Billion)
11.3.1.6 Eastern Europe Business Spend Management Software Market Estimates and Forecasts, by End-Use (2020-2032) (USD Billion)
11.3.1.7 Poland
11.3.1.7.1 Poland Business Spend Management Software Market Estimates and Forecasts, by Solution (2020-2032) (USD Billion)
11.3.1.7.2 Poland Business Spend Management Software Market Estimates and Forecasts, by Deployment (2020-2032) (USD Billion)
11.3.1.7.3 Poland Business Spend Management Software Market Estimates and Forecasts, by Enterprise Type (2020-2032) (USD Billion)
11.3.1.7.4 Poland Business Spend Management Software Market Estimates and Forecasts, by End-Use (2020-2032) (USD Billion)
11.3.1.8 Romania
11.3.1.8.1 Romania Business Spend Management Software Market Estimates and Forecasts, by Solution (2020-2032) (USD Billion)
11.3.1.8.2 Romania Business Spend Management Software Market Estimates and Forecasts, by Deployment (2020-2032) (USD Billion)
11.3.1.8.3 Romania Business Spend Management Software Market Estimates and Forecasts, by Enterprise Type (2020-2032) (USD Billion)
11.3.1.8.4 Romania Business Spend Management Software Market Estimates and Forecasts, by End-Use (2020-2032) (USD Billion)
11.3.1.9 Hungary
11.3.1.9.1 Hungary Business Spend Management Software Market Estimates and Forecasts, by Solution (2020-2032) (USD Billion)
11.3.1.9.2 Hungary Business Spend Management Software Market Estimates and Forecasts, by Deployment (2020-2032) (USD Billion)
11.3.1.9.3 Hungary Business Spend Management Software Market Estimates and Forecasts, by Enterprise Type (2020-2032) (USD Billion)
11.3.1.9.4 Hungary Business Spend Management Software Market Estimates and Forecasts, by End-Use (2020-2032) (USD Billion)
11.3.1.10 Turkey
11.3.1.10.1 Turkey Business Spend Management Software Market Estimates and Forecasts, by Solution (2020-2032) (USD Billion)
11.3.1.10.2 Turkey Business Spend Management Software Market Estimates and Forecasts, by Deployment (2020-2032) (USD Billion)
11.3.1.10.3 Turkey Business Spend Management Software Market Estimates and Forecasts, by Enterprise Type (2020-2032) (USD Billion)
11.3.1.10.4 Turkey Business Spend Management Software Market Estimates and Forecasts, by End-Use (2020-2032) (USD Billion)
11.3.1.11 Rest of Eastern Europe
11.3.1.11.1 Rest of Eastern Europe Business Spend Management Software Market Estimates and Forecasts, by Solution (2020-2032) (USD Billion)
11.3.1.11.2 Rest of Eastern Europe Business Spend Management Software Market Estimates and Forecasts, by Deployment (2020-2032) (USD Billion)
11.3.1.11.3 Rest of Eastern Europe Business Spend Management Software Market Estimates and Forecasts, by Enterprise Type (2020-2032) (USD Billion)
11.3.1.11.4 Rest of Eastern Europe Business Spend Management Software Market Estimates and Forecasts, by End-Use (2020-2032) (USD Billion)
11.3.2 Western Europe
11.3.2.1 Trends Analysis
11.3.2.2 Western Europe Business Spend Management Software Market Estimates and Forecasts, by Country (2020-2032) (USD Billion)
11.3.2.3 Western Europe Business Spend Management Software Market Estimates and Forecasts, by Solution (2020-2032) (USD Billion)
11.3.2.4 Western Europe Business Spend Management Software Market Estimates and Forecasts, by Deployment (2020-2032) (USD Billion)
11.3.2.5 Western Europe Business Spend Management Software Market Estimates and Forecasts, by Enterprise Type (2020-2032) (USD Billion)
11.3.2.6 Western Europe Business Spend Management Software Market Estimates and Forecasts, by End-Use (2020-2032) (USD Billion)
11.3.2.7 Germany
11.3.2.7.1 Germany Business Spend Management Software Market Estimates and Forecasts, by Solution (2020-2032) (USD Billion)
11.3.2.7.2 Germany Business Spend Management Software Market Estimates and Forecasts, by Deployment (2020-2032) (USD Billion)
11.3.2.7.3 Germany Business Spend Management Software Market Estimates and Forecasts, by Enterprise Type (2020-2032) (USD Billion)
11.3.2.7.4 Germany Business Spend Management Software Market Estimates and Forecasts, by End-Use (2020-2032) (USD Billion)
11.3.2.8 France
11.3.2.8.1 France Business Spend Management Software Market Estimates and Forecasts, by Solution (2020-2032) (USD Billion)
11.3.2.8.2 France Business Spend Management Software Market Estimates and Forecasts, by Deployment (2020-2032) (USD Billion)
11.3.2.8.3 France Business Spend Management Software Market Estimates and Forecasts, by Enterprise Type (2020-2032) (USD Billion)
11.3.2.8.4 France Business Spend Management Software Market Estimates and Forecasts, by End-Use (2020-2032) (USD Billion)
11.3.2.9 UK
11.3.2.9.1 UK Business Spend Management Software Market Estimates and Forecasts, by Solution (2020-2032) (USD Billion)
11.3.2.9.2 UK Business Spend Management Software Market Estimates and Forecasts, by Deployment (2020-2032) (USD Billion)
11.3.2.9.3 UK Business Spend Management Software Market Estimates and Forecasts, by Enterprise Type (2020-2032) (USD Billion)
11.3.2.9.4 UK Business Spend Management Software Market Estimates and Forecasts, by End-Use (2020-2032) (USD Billion)
11.3.2.10 Italy
11.3.2.10.1 Italy Business Spend Management Software Market Estimates and Forecasts, by Solution (2020-2032) (USD Billion)
11.3.2.10.2 Italy Business Spend Management Software Market Estimates and Forecasts, by Deployment (2020-2032) (USD Billion)
11.3.2.10.3 Italy Business Spend Management Software Market Estimates and Forecasts, by Enterprise Type (2020-2032) (USD Billion)
11.3.2.10.4 Italy Business Spend Management Software Market Estimates and Forecasts, by End-Use (2020-2032) (USD Billion)
11.3.2.11 Spain
11.3.2.11.1 Spain Business Spend Management Software Market Estimates and Forecasts, by Solution (2020-2032) (USD Billion)
11.3.2.11.2 Spain Business Spend Management Software Market Estimates and Forecasts, by Deployment (2020-2032) (USD Billion)
11.3.2.11.3 Spain Business Spend Management Software Market Estimates and Forecasts, by Enterprise Type (2020-2032) (USD Billion)
11.3.2.11.4 Spain Business Spend Management Software Market Estimates and Forecasts, by End-Use (2020-2032) (USD Billion)
11.3.2.12 Netherlands
11.3.2.12.1 Netherlands Business Spend Management Software Market Estimates and Forecasts, by Solution (2020-2032) (USD Billion)
11.3.2.12.2 Netherlands Business Spend Management Software Market Estimates and Forecasts, by Deployment (2020-2032) (USD Billion)
11.3.2.12.3 Netherlands Business Spend Management Software Market Estimates and Forecasts, by Enterprise Type (2020-2032) (USD Billion)
11.3.2.12.4 Netherlands Business Spend Management Software Market Estimates and Forecasts, by End-Use (2020-2032) (USD Billion)
11.3.2.13 Switzerland
11.3.2.13.1 Switzerland Business Spend Management Software Market Estimates and Forecasts, by Solution (2020-2032) (USD Billion)
11.3.2.13.2 Switzerland Business Spend Management Software Market Estimates and Forecasts, by Deployment (2020-2032) (USD Billion)
11.3.2.13.3 Switzerland Business Spend Management Software Market Estimates and Forecasts, by Enterprise Type (2020-2032) (USD Billion)
11.3.2.13.4 Switzerland Business Spend Management Software Market Estimates and Forecasts, by End-Use (2020-2032) (USD Billion)
11.3.2.14 Austria
11.3.2.14.1 Austria Business Spend Management Software Market Estimates and Forecasts, by Solution (2020-2032) (USD Billion)
11.3.2.14.2 Austria Business Spend Management Software Market Estimates and Forecasts, by Deployment (2020-2032) (USD Billion)
11.3.2.14.3 Austria Business Spend Management Software Market Estimates and Forecasts, by Enterprise Type (2020-2032) (USD Billion)
11.3.2.14.4 Austria Business Spend Management Software Market Estimates and Forecasts, by End-Use (2020-2032) (USD Billion)
11.3.2.15 Rest of Western Europe
11.3.2.15.1 Rest of Western Europe Business Spend Management Software Market Estimates and Forecasts, by Solution (2020-2032) (USD Billion)
11.3.2.15.2 Rest of Western Europe Business Spend Management Software Market Estimates and Forecasts, by Deployment (2020-2032) (USD Billion)
11.3.2.15.3 Rest of Western Europe Business Spend Management Software Market Estimates and Forecasts, by Enterprise Type (2020-2032) (USD Billion)
11.3.2.15.4 Rest of Western Europe Business Spend Management Software Market Estimates and Forecasts, by End-Use (2020-2032) (USD Billion)
11.4 Asia Pacific
11.4.1 Trends Analysis
11.4.2 Asia Pacific Business Spend Management Software Market Estimates and Forecasts, by Country (2020-2032) (USD Billion)
11.4.3 Asia Pacific Business Spend Management Software Market Estimates and Forecasts, by Solution (2020-2032) (USD Billion)
11.4.4 Asia Pacific Business Spend Management Software Market Estimates and Forecasts, by Deployment (2020-2032) (USD Billion)
11.4.5 Asia Pacific Business Spend Management Software Market Estimates and Forecasts, by Enterprise Type (2020-2032) (USD Billion)
11.4.6 Asia Pacific Business Spend Management Software Market Estimates and Forecasts, by End-Use (2020-2032) (USD Billion)
11.4.7 China
11.4.7.1 China Business Spend Management Software Market Estimates and Forecasts, by Solution (2020-2032) (USD Billion)
11.4.7.2 China Business Spend Management Software Market Estimates and Forecasts, by Deployment (2020-2032) (USD Billion)
11.4.7.3 China Business Spend Management Software Market Estimates and Forecasts, by Enterprise Type (2020-2032) (USD Billion)
11.4.7.4 China Business Spend Management Software Market Estimates and Forecasts, by End-Use (2020-2032) (USD Billion)
11.4.8 India
11.4.8.1 India Business Spend Management Software Market Estimates and Forecasts, by Solution (2020-2032) (USD Billion)
11.4.8.2 India Business Spend Management Software Market Estimates and Forecasts, by Deployment (2020-2032) (USD Billion)
11.4.8.3 India Business Spend Management Software Market Estimates and Forecasts, by Enterprise Type (2020-2032) (USD Billion)
11.4.8.4 India Business Spend Management Software Market Estimates and Forecasts, by End-Use (2020-2032) (USD Billion)
11.4.9 Japan
11.4.9.1 Japan Business Spend Management Software Market Estimates and Forecasts, by Solution (2020-2032) (USD Billion)
11.4.9.2 Japan Business Spend Management Software Market Estimates and Forecasts, by Deployment (2020-2032) (USD Billion)
11.4.9.3 Japan Business Spend Management Software Market Estimates and Forecasts, by Enterprise Type (2020-2032) (USD Billion)
11.4.9.4 Japan Business Spend Management Software Market Estimates and Forecasts, by End-Use (2020-2032) (USD Billion)
11.4.10 South Korea
11.4.10.1 South Korea Business Spend Management Software Market Estimates and Forecasts, by Solution (2020-2032) (USD Billion)
11.4.10.2 South Korea Business Spend Management Software Market Estimates and Forecasts, by Deployment (2020-2032) (USD Billion)
11.4.10.3 South Korea Business Spend Management Software Market Estimates and Forecasts, by Enterprise Type (2020-2032) (USD Billion)
11.4.10.4 South Korea Business Spend Management Software Market Estimates and Forecasts, by End-Use (2020-2032) (USD Billion)
11.4.11 Vietnam
11.4.11.1 Vietnam Business Spend Management Software Market Estimates and Forecasts, by Solution (2020-2032) (USD Billion)
11.4.11.2 Vietnam Business Spend Management Software Market Estimates and Forecasts, by Deployment (2020-2032) (USD Billion)
11.4.11.3 Vietnam Business Spend Management Software Market Estimates and Forecasts, by Enterprise Type (2020-2032) (USD Billion)
11.4.11.4 Vietnam Business Spend Management Software Market Estimates and Forecasts, by End-Use (2020-2032) (USD Billion)
11.4.12 Singapore
11.4.12.1 Singapore Business Spend Management Software Market Estimates and Forecasts, by Solution (2020-2032) (USD Billion)
11.4.12.2 Singapore Business Spend Management Software Market Estimates and Forecasts, by Deployment (2020-2032) (USD Billion)
11.4.12.3 Singapore Business Spend Management Software Market Estimates and Forecasts, by Enterprise Type (2020-2032) (USD Billion)
11.4.12.4 Singapore Business Spend Management Software Market Estimates and Forecasts, by End-Use (2020-2032) (USD Billion)
11.4.13 Australia
11.4.13.1 Australia Business Spend Management Software Market Estimates and Forecasts, by Solution (2020-2032) (USD Billion)
11.4.13.2 Australia Business Spend Management Software Market Estimates and Forecasts, by Deployment (2020-2032) (USD Billion)
11.4.13.3 Australia Business Spend Management Software Market Estimates and Forecasts, by Enterprise Type (2020-2032) (USD Billion)
11.4.13.4 Australia Business Spend Management Software Market Estimates and Forecasts, by End-Use (2020-2032) (USD Billion)
11.4.14 Rest of Asia Pacific
11.4.14.1 Rest of Asia Pacific Business Spend Management Software Market Estimates and Forecasts, by Solution (2020-2032) (USD Billion)
11.4.14.2 Rest of Asia Pacific Business Spend Management Software Market Estimates and Forecasts, by Deployment (2020-2032) (USD Billion)
11.4.14.3 Rest of Asia Pacific Business Spend Management Software Market Estimates and Forecasts, by Enterprise Type (2020-2032) (USD Billion)
11.4.14.4 Rest of Asia Pacific Business Spend Management Software Market Estimates and Forecasts, by End-Use (2020-2032) (USD Billion)
11.5 Middle East and Africa
11.5.1 Middle East
11.5.1.1 Trends Analysis
11.5.1.2 Middle East Business Spend Management Software Market Estimates and Forecasts, by Country (2020-2032) (USD Billion)
11.5.1.3 Middle East Business Spend Management Software Market Estimates and Forecasts, by Solution (2020-2032) (USD Billion)
11.5.1.4 Middle East Business Spend Management Software Market Estimates and Forecasts, by Deployment (2020-2032) (USD Billion)
11.5.1.5 Middle East Business Spend Management Software Market Estimates and Forecasts, by Enterprise Type (2020-2032) (USD Billion)
11.5.1.6 Middle East Business Spend Management Software Market Estimates and Forecasts, by End-Use (2020-2032) (USD Billion)
11.5.1.7 UAE
11.5.1.7.1 UAE Business Spend Management Software Market Estimates and Forecasts, by Solution (2020-2032) (USD Billion)
11.5.1.7.2 UAE Business Spend Management Software Market Estimates and Forecasts, by Deployment (2020-2032) (USD Billion)
11.5.1.7.3 UAE Business Spend Management Software Market Estimates and Forecasts, by Enterprise Type (2020-2032) (USD Billion)
11.5.1.7.4 UAE Business Spend Management Software Market Estimates and Forecasts, by End-Use (2020-2032) (USD Billion)
11.5.1.8 Egypt
11.5.1.8.1 Egypt Business Spend Management Software Market Estimates and Forecasts, by Solution (2020-2032) (USD Billion)
11.5.1.8.2 Egypt Business Spend Management Software Market Estimates and Forecasts, by Deployment (2020-2032) (USD Billion)
11.5.1.8.3 Egypt Business Spend Management Software Market Estimates and Forecasts, by Enterprise Type (2020-2032) (USD Billion)
11.5.1.8.4 Egypt Business Spend Management Software Market Estimates and Forecasts, by End-Use (2020-2032) (USD Billion)
11.5.1.9 Saudi Arabia
11.5.1.9.1 Saudi Arabia Business Spend Management Software Market Estimates and Forecasts, by Solution (2020-2032) (USD Billion)
11.5.1.9.2 Saudi Arabia Business Spend Management Software Market Estimates and Forecasts, by Deployment (2020-2032) (USD Billion)
11.5.1.9.3 Saudi Arabia Business Spend Management Software Market Estimates and Forecasts, by Enterprise Type (2020-2032) (USD Billion)
11.5.1.9.4 Saudi Arabia Business Spend Management Software Market Estimates and Forecasts, by End-Use (2020-2032) (USD Billion)
11.5.1.10 Qatar
11.5.1.10.1 Qatar Business Spend Management Software Market Estimates and Forecasts, by Solution (2020-2032) (USD Billion)
11.5.1.10.2 Qatar Business Spend Management Software Market Estimates and Forecasts, by Deployment (2020-2032) (USD Billion)
11.5.1.10.3 Qatar Business Spend Management Software Market Estimates and Forecasts, by Enterprise Type (2020-2032) (USD Billion)
11.5.1.10.4 Qatar Business Spend Management Software Market Estimates and Forecasts, by End-Use (2020-2032) (USD Billion)
11.5.1.11 Rest of Middle East
11.5.1.11.1 Rest of Middle East Business Spend Management Software Market Estimates and Forecasts, by Solution (2020-2032) (USD Billion)
11.5.1.11.2 Rest of Middle East Business Spend Management Software Market Estimates and Forecasts, by Deployment (2020-2032) (USD Billion)
11.5.1.11.3 Rest of Middle East Business Spend Management Software Market Estimates and Forecasts, by Enterprise Type (2020-2032) (USD Billion)
11.5.1.11.4 Rest of Middle East Business Spend Management Software Market Estimates and Forecasts, by End-Use (2020-2032) (USD Billion)
11.5.2 Africa
11.5.2.1 Trends Analysis
11.5.2.2 Africa Business Spend Management Software Market Estimates and Forecasts, by Country (2020-2032) (USD Billion)
11.5.2.3 Africa Business Spend Management Software Market Estimates and Forecasts, by Solution (2020-2032) (USD Billion)
11.5.2.4 Africa Business Spend Management Software Market Estimates and Forecasts, by Deployment (2020-2032) (USD Billion)
11.5.2.5 Africa Business Spend Management Software Market Estimates and Forecasts, by Enterprise Type (2020-2032) (USD Billion)
11.5.2.6 Africa Business Spend Management Software Market Estimates and Forecasts, by End-Use (2020-2032) (USD Billion)
11.5.2.7 South Africa
11.5.2.7.1 South Africa Business Spend Management Software Market Estimates and Forecasts, by Solution (2020-2032) (USD Billion)
11.5.2.7.2 South Africa Business Spend Management Software Market Estimates and Forecasts, by Deployment (2020-2032) (USD Billion)
11.5.2.7.3 South Africa Business Spend Management Software Market Estimates and Forecasts, by Enterprise Type (2020-2032) (USD Billion)
11.5.2.7.4 South Africa Business Spend Management Software Market Estimates and Forecasts, by End-Use (2020-2032) (USD Billion)
11.5.2.8 Nigeria
11.5.2.8.1 Nigeria Business Spend Management Software Market Estimates and Forecasts, by Solution (2020-2032) (USD Billion)
11.5.2.8.2 Nigeria Business Spend Management Software Market Estimates and Forecasts, by Deployment (2020-2032) (USD Billion)
11.5.2.8.3 Nigeria Business Spend Management Software Market Estimates and Forecasts, by Enterprise Type (2020-2032) (USD Billion)
11.5.2.8.4 Nigeria Business Spend Management Software Market Estimates and Forecasts, by End-Use (2020-2032) (USD Billion)
11.5.2.9 Rest of Africa
11.5.2.9.1 Rest of Africa Business Spend Management Software Market Estimates and Forecasts, by Solution (2020-2032) (USD Billion)
11.5.2.9.2 Rest of Africa Business Spend Management Software Market Estimates and Forecasts, by Deployment (2020-2032) (USD Billion)
11.5.2.9.3 Rest of Africa Business Spend Management Software Market Estimates and Forecasts, by Enterprise Type (2020-2032) (USD Billion)
11.5.2.9.4 Rest of Africa Business Spend Management Software Market Estimates and Forecasts, by End-Use (2020-2032) (USD Billion)
11.6 Latin America
11.6.1 Trends Analysis
11.6.2 Latin America Business Spend Management Software Market Estimates and Forecasts, by Country (2020-2032) (USD Billion)
11.6.3 Latin America Business Spend Management Software Market Estimates and Forecasts, by Solution (2020-2032) (USD Billion)
11.6.4 Latin America Business Spend Management Software Market Estimates and Forecasts, by Deployment (2020-2032) (USD Billion)
11.6.5 Latin America Business Spend Management Software Market Estimates and Forecasts, by Enterprise Type (2020-2032) (USD Billion)
11.6.6 Latin America Business Spend Management Software Market Estimates and Forecasts, by End-Use (2020-2032) (USD Billion)
11.6.7 Brazil
11.6.7.1 Brazil Business Spend Management Software Market Estimates and Forecasts, by Solution (2020-2032) (USD Billion)
11.6.7.2 Brazil Business Spend Management Software Market Estimates and Forecasts, by Deployment (2020-2032) (USD Billion)
11.6.7.3 Brazil Business Spend Management Software Market Estimates and Forecasts, by Enterprise Type (2020-2032) (USD Billion)
11.6.7.4 Brazil Business Spend Management Software Market Estimates and Forecasts, by End-Use (2020-2032) (USD Billion)
11.6.8 Argentina
11.6.8.1 Argentina Business Spend Management Software Market Estimates and Forecasts, by Solution (2020-2032) (USD Billion)
11.6.8.2 Argentina Business Spend Management Software Market Estimates and Forecasts, by Deployment (2020-2032) (USD Billion)
11.6.8.3 Argentina Business Spend Management Software Market Estimates and Forecasts, by Enterprise Type (2020-2032) (USD Billion)
11.6.8.4 Argentina Business Spend Management Software Market Estimates and Forecasts, by End-Use (2020-2032) (USD Billion)
11.6.9 Colombia
11.6.9.1 Colombia Business Spend Management Software Market Estimates and Forecasts, by Solution (2020-2032) (USD Billion)
11.6.9.2 Colombia Business Spend Management Software Market Estimates and Forecasts, by Deployment (2020-2032) (USD Billion)
11.6.9.3 Colombia Business Spend Management Software Market Estimates and Forecasts, by Enterprise Type (2020-2032) (USD Billion)
11.6.9.4 Colombia Business Spend Management Software Market Estimates and Forecasts, by End-Use (2020-2032) (USD Billion)
11.6.10 Rest of Latin America
11.6.10.1 Rest of Latin America Business Spend Management Software Market Estimates and Forecasts, by Solution (2020-2032) (USD Billion)
11.6.10.2 Rest of Latin America Business Spend Management Software Market Estimates and Forecasts, by Deployment (2020-2032) (USD Billion)
11.6.10.3 Rest of Latin America Business Spend Management Software Market Estimates and Forecasts, by Enterprise Type (2020-2032) (USD Billion)
11.6.10.4 Rest of Latin America Business Spend Management Software Market Estimates and Forecasts, by End-Use (2020-2032) (USD Billion)
12. Company Profiles
12.1 SAP
12.1.1 Company Overview
12.1.2 Financial
12.1.3 Products/ Services Offered
12.1.4 SWOT Analysis
12.2 Oracle
12.2.1 Company Overview
12.2.2 Financial
12.2.3 Products/ Services Offered
12.2.4 SWOT Analysis
12.3 Coupa
12.3.1 Company Overview
12.3.2 Financial
12.3.3 Products/ Services Offered
12.3.4 SWOT Analysis
12.4 Zycus
12.4.1 Company Overview
12.4.2 Financial
12.4.3 Products/ Services Offered
12.4.4 SWOT Analysis
12.5 Ivalua
12.5.1 Company Overview
12.5.2 Financial
12.5.3 Products/ Services Offered
12.5.4 SWOT Analysis
12.6 Jaggaer
12.6.1 Company Overview
12.6.2 Financial
12.6.3 Products/ Services Offered
12.6.4 SWOT Analysis
12.7 GEP
12.7.1 Company Overview
12.7.2 Financial
12.7.3 Products/ Services Offered
12.7.4 SWOT Analysis
12.8 Basware
12.8.1 Company Overview
12.8.2 Financial
12.8.3 Products/ Services Offered
12.8.4 SWOT Analysis
12.9 Tradeshift
12.9.1 Company Overview
12.9.2 Financial
12.9.3 Products/ Services Offered
12.9.4 SWOT Analysis
12.10 SynerTrade
12.10.1 Company Overview
12.10.2 Financial
12.10.3 Products/ Services Offered
12.10.4 SWOT Analysis
13. Use Cases and Best Practices
14. Conclusion
An accurate research report requires proper strategizing as well as implementation. There are multiple factors involved in the completion of good and accurate research report and selecting the best methodology to compete the research is the toughest part. Since the research reports we provide play a crucial role in any company’s decision-making process, therefore we at SNS Insider always believe that we should choose the best method which gives us results closer to reality. This allows us to reach at a stage wherein we can provide our clients best and accurate investment to output ratio.
Each report that we prepare takes a timeframe of 350-400 business hours for production. Starting from the selection of titles through a couple of in-depth brain storming session to the final QC process before uploading our titles on our website we dedicate around 350 working hours. The titles are selected based on their current market cap and the foreseen CAGR and growth.
The 5 steps process:
Step 1: Secondary Research:
Secondary Research or Desk Research is as the name suggests is a research process wherein, we collect data through the readily available information. In this process we use various paid and unpaid databases which our team has access to and gather data through the same. This includes examining of listed companies’ annual reports, Journals, SEC filling etc. Apart from this our team has access to various associations across the globe across different industries. Lastly, we have exchange relationships with various university as well as individual libraries.

Step 2: Primary Research
When we talk about primary research, it is a type of study in which the researchers collect relevant data samples directly, rather than relying on previously collected data. This type of research is focused on gaining content specific facts that can be sued to solve specific problems. Since the collected data is fresh and first hand therefore it makes the study more accurate and genuine.
We at SNS Insider have divided Primary Research into 2 parts.
Part 1 wherein we interview the KOLs of major players as well as the upcoming ones across various geographic regions. This allows us to have their view over the market scenario and acts as an important tool to come closer to the accurate market numbers. As many as 45 paid and unpaid primary interviews are taken from both the demand and supply side of the industry to make sure we land at an accurate judgement and analysis of the market.
This step involves the triangulation of data wherein our team analyses the interview transcripts, online survey responses and observation of on filed participants. The below mentioned chart should give a better understanding of the part 1 of the primary interview.

Part 2: In this part of primary research the data collected via secondary research and the part 1 of the primary research is validated with the interviews from individual consultants and subject matter experts.
Consultants are those set of people who have at least 12 years of experience and expertise within the industry whereas Subject Matter Experts are those with at least 15 years of experience behind their back within the same space. The data with the help of two main processes i.e., FGDs (Focused Group Discussions) and IDs (Individual Discussions). This gives us a 3rd party nonbiased primary view of the market scenario making it a more dependable one while collation of the data pointers.
Step 3: Data Bank Validation
Once all the information is collected via primary and secondary sources, we run that information for data validation. At our intelligence centre our research heads track a lot of information related to the market which includes the quarterly reports, the daily stock prices, and other relevant information. Our data bank server gets updated every fortnight and that is how the information which we collected using our primary and secondary information is revalidated in real time.

Step 4: QA/QC Process
After all the data collection and validation our team does a final level of quality check and quality assurance to get rid of any unwanted or undesired mistakes. This might include but not limited to getting rid of the any typos, duplication of numbers or missing of any important information. The people involved in this process include technical content writers, research heads and graphics people. Once this process is completed the title gets uploader on our platform for our clients to read it.
Step 5: Final QC/QA Process:
This is the last process and comes when the client has ordered the study. In this process a final QA/QC is done before the study is emailed to the client. Since we believe in giving our clients a good experience of our research studies, therefore, to make sure that we do not lack at our end in any way humanly possible we do a final round of quality check and then dispatch the study to the client.
Key Segments:
By Solution
Procure-to-Pay Solutions
Supplier & Risk Management
Travel & Expense Management
Contract & e-Tender Management
Spend Management/Spend Analytics
Others
By Deployment
On-Premises
Cloud
By Enterprise Type
Large Enterprise
SMEs
By End-Use
BFSI
Travel & Tourism
Hospitality
Healthcare
IT & Telecom
Energy & Utility
Retail & E-commerce
Others
Request for Segment Customization as per your Business Requirement: Segment Customization Request
REGIONAL COVERAGE:
North America
US
Canada
Mexico
Europe
Eastern Europe
Poland
Romania
Hungary
Turkey
Rest of Eastern Europe
Western Europe
Germany
France
UK
Italy
Spain
Netherlands
Switzerland
Austria
Rest of Western Europe
Asia Pacific
China
India
Japan
South Korea
Vietnam
Singapore
Australia
Rest of Asia Pacific
Middle East & Africa
Middle East
UAE
Egypt
Saudi Arabia
Qatar
Rest of the Middle East
Africa
Nigeria
South Africa
Rest of Africa
Latin America
Brazil
Argentina
Colombia
Rest of Latin America
Request for Country Level Research Report: Country Level Customization Request
Available Customization
With the given market data, SNS Insider offers customization as per the company’s specific needs. The following customization options are available for the report:
Product Analysis
Criss-Cross segment analysis (e.g. Product X Application)
Product Matrix which gives a detailed comparison of product portfolio of each company
Geographic Analysis
Additional countries in any of the regions
Company Information
Detailed analysis and profiling of additional market players (Up to five)
Restaurant Management Software Market was valued at USD 5.05 billion in 2023 and is expected to reach USD 18.73 billion by 2032, growing at a CAGR of 15.75% from 2024-2032.
E-Commerce Market was valued at USD 21,327 billion in 2023 and is expected to reach USD 113,060 billion by 2032, growing at a CAGR of 20.41% by 2032.
The Cloud Workflow Market Size was valued at USD 3.41 Billion in 2023 and is expected to reach USD 14.81 Billion by 2032 and grow at a CAGR of 17.85% by 2032.
The Neural Network Software Market size was valued at USD 36.01 billion in 2023 and is expected to reach USD 432.50 billion by 2032, with a growing at CAGR of 31.89% over the forecast period of 2024-2032.
The In-app Advertising Market Size was valued at USD 168.40 Billion in 2023 and will reach USD 561.24 Billion by 2032 and grow at a CAGR of 14.4% by 2032.
The Artificial General Intelligence (AGI) Market size was valued at USD 3.01 Billion in 2023 and is expected to grow to USD 52 Billion by 2032 with a growing CAGR of 37.5% over the forecast period of 2024-2032.

Hi! Click one of our member below to chat on Phone
© 2025 All Rights Reserved by SNS Insider Pvt Ltd


