Get More Information on Business Process Management Market - Request Sample Report
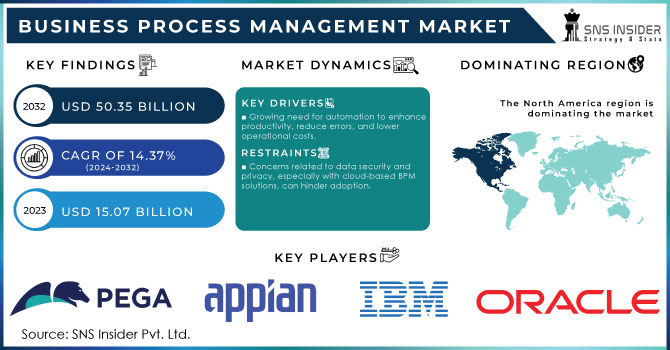
Business Process Management Market was worth USD 15.07 billion in 2023 and is predicted to be worth USD 50.35 billion by 2032, growing at a CAGR of 14.37% between 2024 and 2032.
Business Process Management (BPM) deployment brings about several advantages, such as better business agility, visibility across the board at all times and places, increase efficiency delivery of results faster so quicker ROI for BPM efforts improved compliance data security, continuous process improvement and seamless knowledge transfer. Major players providing BPM solutions on a global scale, including Accenture, Genpact and IBM are major contributors to market expansion. In 2024, a report mentioned that now around 75% of BPM platforms are capable and have started to integrate some AI whether it’s in the form of Machine Learning or Predictive Analytics being part it for better decision-making system plus efficient. By 2023, nearly 60% of worldwide organizations will have established formal BPM solutions and methodologies to optimize business processes especially in the financial services & healthcare sectors.
The AI deployment in BPM fuelled this market to grow further by providing an automation and process enhancement that includes repetitive tasks as well predictive analysis, cost saving technology improvement, and decision making. Infosys BPM unveiled an IBM-backed AI and automation center in Poland targeting enterprises looking to fast-track their hybrid cloud journey with new foundry offerings that deliver industry-specific solutions bolstered by the capabilities of artificial intelligence (AI) and data. This factor is anticipated to boost the demand for BPM during the forecast period. In another example, iGrafx, LLC & Zeitworks Technologies Inc. joined together in September 2022 to offer an AI-fueled intelligent process management platform which merged task and also process mining with predictive analysis & simulation capabilities. This is a widely recognized trend throughout the BPM market, which continues to grow rapidly. The next is, considering public & private clouds creasing over to be a super easy way for businesses to have such access to their cloud technology allowing them cost-effective BPM solutions. This has driven demand for automation to reduce costs of services and products, fuelling the growth of the BPM market particularly in service industries where process re-engineering is critical, BPM solutions enable better end-user connectivity improvement improve application quality, and Library technology. In 2023, a report from the American Productivity & Quality Center (APQC) stated that roughly 68% of U.S. businesses are using BPM solutions supporting automation as tool to improve operational efficacy in their organizations when it comes to making strategic technology choices. The U.S. market is clouded with over 60% implementations in the year 2023 from a study completed by International Data Corporation (IDC) emphasizing scalable and agile BPM also trialed to be able to consider based on demand modification US-oriented solutions Research in 2023 showed U.S. companies experienced a larger uptick with a 20% reduction of process cycle times for companies employing BPM solutions improve employee productivity and operational agility.
Drivers
Growing need for automation to enhance productivity, reduce errors, and lower operational costs.
Rapid adoption of digitalization across various industries to improve business agility and efficiency.
Increasing integration of artificial intelligence in BPM to streamline processes, provide predictive analysis and enhance decision-making.
The automation of Business Process Management (BPM) is one of the important drivers for this market, as businesses are focusing on automating their processes across industry verticals. This movement toward automation is being fuelled by the requirements of improved operational efficiency, error reduction and lower operational costs. With businesses becoming ever more focused on efficiency, the use of automation-capable business process management (BPM) tools is growing rapidly. BPM automation with bpm significantly eliminates manual and repetitive tasks, so human resources are kept free for crucial activities. It was very well understood in the ongoing Digital Transformation. A recent report estimated that for 60% of all occupations, at least 30% of activities could be automated which is a huge opportunity for automation driven directly from BPM. Even more, 73% of organizations are on the route of digitalizing their work with automation, and many will increase their capabilities within a few years.
The financial industry, in particular, has reaped significant benefits through BPM automation with enhanced customer service and faster processing times. According to the World Economic Forum, financial organizations that have automated processes (including BPM) are witnessing a 50-70 % faster processing time and cutting costs by up to 30%. Increasing use of automation is also being leveraged with AI and Machine learning to integrate deeper within the BPM systems leading to higher adoption. These technologies expanded the features of BPM tools allowing predictive analysis, smart decision making and optimizing resource management which has been instrumental in driving demand for BPM applications across industries as well.
Restraints
Integrating BPM solutions with existing IT infrastructure can be complex and time-consuming, Shortage of skilled personnel to manage and operate BPM systems effectively.
Concerns related to data security and privacy, especially with cloud-based BPM solutions, can hinder adoption.
Organizational resistance to adopting new processes and technologies can slow down the implementation of BPM solutions.
The major challenge in the Business Process Management (BPM) market is complex connectivity with existing IT infrastructure. While BPM tools can be fit into a legacy system, it is easier said than done and requires a major investment in terms of time. The differences in their system architectures, data formats, and operational workflows result in challenges for many organizations when it comes to integrating BPM platforms seamlessly with other applications. In some industries, very specific workflows such as healthcare and finance require highly specialized components which usually create barriers to the implementation of BPM.
By Solution
In 2023 more than 26% of total revenue is contributed by the process modeling section. This segment is expected to grow due to benefits such as collaboration, greater operational alignment with business strategies, increased efficiency of operations, and better control and consistency so that they can be more competitive. All of this translates to new solutions that enhance the identification and modeling of key business processes. For example, in June 2020 iGrafx LLC, a U.S.-based BPM solution provider launched an all-new solution to aid businesses with a business continuity boost. It is packed with specialized properties, custom services, online surveys as well as an auto accelerator for BIAs. With its increasing share in the market, these innovations are contributing prominently to the growth of the process modeling segment.
Automation is expected to grow at a significant CAGR from 2024 to 2032 due to various reasons few among which are a parallel shift in their benefits. These include higher efficiency, centralization of information, reduced mistakes and delays in processes; lower costs from operations payments to improved internal communication. Further, the companies are providing advanced solutions to boost these segments. For instance, in March 2021 Red Hat Inc. released an updated version of its open-source business automation platform, Red Hat Process Automation. This platform allows to have an end-to-end solution as its architecture has been designed in such a way that it cover functionalities like Case management, Business Process Management, Resource Planning and BPM rules.
By Application
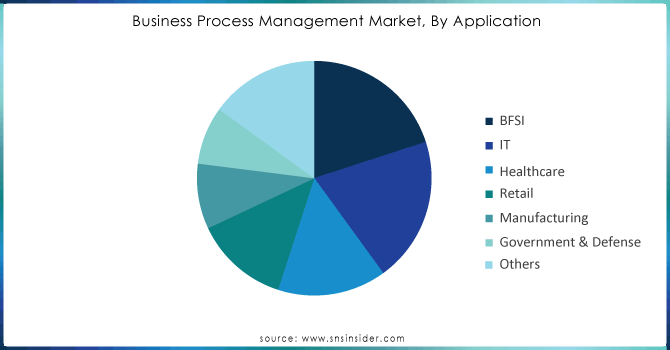
The BFSI segment held a significant share of more than 20% in 2023, benefiting from several advantages offered by BPM adoption in finance. Such benefits are improved customer service, a safer and more secure operational environment higher availability, or business agility/flexibility but what it really means is that clients are trying to be quicker than their competition and greater efficiency so you can leverage the savings into something else in your operation also further visibility. This growth has been further driven by various organizations including government bodies in introducing initiatives to help accelerate the sustainable transition of the banking sector. In March 2023, an Italian BPM solution provider BANCO BPM GRUPPO BANCARIO entered the United Nations-led Net-Zero Banking Alliance to help banks move towards a more sustainable future with sights set on achieving net-zero emissions by 2050.
The government and defence segment growing with significant CAGR 17% during forecast period. Government agencies have been particularly strong adopters of BPM and this trend is expected to grow in the future. In order to improve public services, automate their daily operations, control and audit critical processes, and adapt their business to the new legislative guidelines, government agencies are being demanded by BPM. The worldwide acceptance has also made the use of BPM solutions designed for government departments easily available. Major vendors such as BP Logix, Inc., SAP Signavio, and Comidor LTD among others are witnessing high demand for BPM solutions from government agencies hence fuelling the segment growth.
Need any customization research on Business Process Management Market - Enquiry Now
Regional analysis
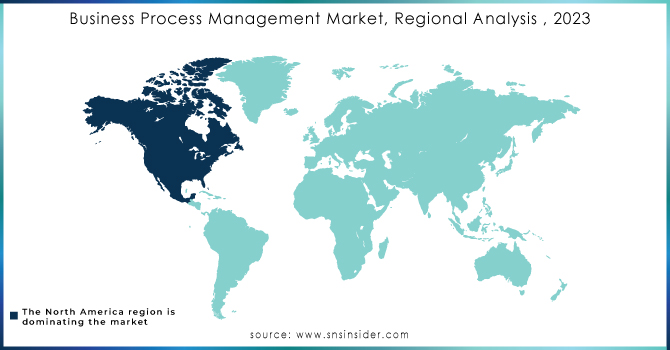
In 2023, North America has captured a major share of more than 33% of the global BPM market. The rapid adoption of next-generation technology and the development of new business models coupled with government-led digitization are propelling growth, being home to the world's largest economy and headquarters for major players such as Appian Corporation, Genpact International Business Machines. According to the latest information collected by U.S. Census Bureau, U.S. alone houses approximately 6.1 million employer firms.
APAC is expected to grow at the highest CAGR of over 19% from 2024 to 2032. This growth has majorly been due to the fast-expanding economies in the region especially India, which is undergoing a significant digital transformation. Moreover, the presence of some leading economies in this region such as China, Japan, and South Korea is accepting new technologies with increasing technological adoption; which would proliferate market growth. The BPM Market has grown substantially in the Asia Pacific region, driven by substantial adoption of BPM within their manufacturing sectors, providing significant growth opportunities for big players. This worldwide trend is expected to boost further the APAC market especially China and India where various global manufacturers have been moved.
The major key players are IBM Corporation, Pegasystems, Appian, Oracle, Software AG, Nintex, OpenText, Newgen Software, Genpact, TIBCO & Other Players
Report Attributes | Details |
Market Size in 2023 | US$ 15.07 Bn |
Market Size by 2032 | US$ 50.35 Bn |
CAGR | CAGR of 14.37% From 2024 to 2032 |
Base Year | 2023 |
Forecast Period | 2024-2032 |
Historical Data | 2020-2022 |
Report Scope & Coverage | Market Size, Segments Analysis, Competitive Landscape, Regional Analysis, DROC & SWOT Analysis, Forecast Outlook |
Key Segments | • By Solution (Process Modeling, Monitoring & Optimization, Automation, Content & Document Management, Integration, Others) • By Deployment (Cloud-based, On-premise) • By organization size (Large Enterprise, SMEs) • By Application (BFSI, IT, Healthcare, Retail, Manufacturing, Government & Defense, Others) |
Regional Analysis/Coverage | North America (USA, Canada, Mexico), Europe (Germany, UK, France, Italy, Spain, Netherlands, Rest of Europe), Asia-Pacific (Japan, South Korea, China, India, Australia, Rest of Asia-Pacific), The Middle East & Africa (Israel, UAE, South Africa, Rest of Middle East & Africa), Latin America (Brazil, Argentina, Rest of Latin America) |
Company Profiles | IBM Corporation, Pegasystems, Appian, Oracle, Software AG, Nintex, OpenText, Newgen Software, Genpact, TIBCO |
Key Drivers | • Advanced technologies, machine learning, intelligence solutions, and artificial intelligence are all being adopted |
Market Opportunities | • Increased use of on-premise BPM software • An increasing number of advantages are provided by cloud-based solutions |
Ans: - The Business Process Management Market size was valued at USD 15.07 Bn in 2023.
Ans: - Advanced technologies, machine learning, intelligence solutions, and artificial intelligence are all being adopted.
Ans: - North America is expected to have the largest proportion of the global business process management market
Ans. The primary growth tactics of Business Process Management market participants include merger and acquisition, business expansion, and product launches.
Ans: - The key players are IBM Corporation, Pegasystems, Appian, Oracle, Software AG, Nintex, OpenText, Newgen Software, Genpact, TIBCO & Other Players
Table of content
1. Introduction
1.1 Market Definition
1.2 Scope (Inclusion and Exclusions)
1.3 Research Assumptions
2. Executive Summary
2.1 Market Overview
2.2 Regional Synopsis
2.3 Competitive Summary
3. Research Methodology
3.1 Top-Down Approach
3.2 Bottom-up Approach
3.3. Data Validation
3.4 Primary Interviews
4. Market Dynamics Impact Analysis
4.1 Market Driving Factors Analysis
4.1.1 Drivers
4.1.2 Restraints
4.1.3 Opportunities
4.1.4 Challenges
4.2 PESTLE Analysis
4.3 Porter’s Five Forces Model
5. Statistical Insights and Trends Reporting
5.1 Adoption Rates of Emerging Technologies
5.2 Network Infrastructure Expansion, By Region
5.3 Cybersecurity Incidents, By Region (2020-2023)
5.4 Cloud Services Usage, By Region
6. Competitive Landscape
6.1 List of Major Companies, By Region
6.2 Market Share Analysis, By Region
6.3 Product Benchmarking
6.3.1 Product specifications and features
6.3.2 Pricing
6.4 Strategic Initiatives
6.4.1 Marketing and promotional activities
6.4.2 Distribution and supply chain strategies
6.4.3 Expansion plans and new product launches
6.4.4 Strategic partnerships and collaborations
6.5 Technological Advancements
6.6 Market Positioning and Branding
7. Business Process Management Market Segmentation, by Solution
7.1 Chapter Overview
7.2 Process Modeling
7.2.1 Process Modeling Market Trends Analysis (2020-2032)
7.2.2 Process Modeling Market Size Estimates and Forecasts to 2032 (USD Million)
7.3 Monitoring & Optimization Management
7.3.1 Monitoring & Optimization Management Market Trends Analysis (2020-2032)
7.3.2 Monitoring & Optimization Management Market Size Estimates and Forecasts to 2032 (USD Million)
7.4 Automation
7.4.1 Automation Market Trends Analysis (2020-2032)
7.4.2 Automation Market Size Estimates and Forecasts to 2032 (USD Million)
7.5 Content & Document Management
7.5.1 Content & Document Management Market Trends Analysis (2020-2032)
7.5.2 Content & Document Management Market Size Estimates and Forecasts to 2032 (USD Million)
7.6 Integration
7.6.1 Integration Market Trends Analysis (2020-2032)
7.6.2 Integration Market Size Estimates and Forecasts to 2032 (USD Million)
7.7 Others
7.7.1 Others Market Trends Analysis (2020-2032)
7.7.2 Others Market Size Estimates and Forecasts to 2032 (USD Million)
8. Business Process Management Market Segmentation, by Deployment
8.1 Chapter Overview
8.2 Cloud-based
8.2.1 Cloud-based Market Trends Analysis (2020-2032)
8.2.2 Cloud-based Market Size Estimates and Forecasts to 2032 (USD Million)
8.3 On-premise
8.3.1 On-premise Market Trends Analysis (2020-2032)
8.3.2 On-premise Market Size Estimates and Forecasts to 2032 (USD Million)
9. Business Process Management Market Segmentation, by organization size
9.1 Chapter Overview
9.2 Large Enterprise
9.2.1 Large Enterprise Market Trends Analysis (2020-2032)
9.2.2 Large Enterprise Market Size Estimates and Forecasts to 2032 (USD Million)
9.3 SMEs
9.3.1 SMEs Market Trends Analysis (2020-2032)
9.3.2 SMEs Market Size Estimates and Forecasts to 2032 (USD Million)
10. Business Process Management Market Segmentation, By Application
10.1 Chapter Overview
10.2 IT
10.2.1 IT Market Trends Analysis (2020-2032)
10.2.2 IT Market Size Estimates and Forecasts to 2032 (USD Million)
10.3 BFSI
10.3.1 BFSI Market Trends Analysis (2020-2032)
10.3.2 BFSI Market Size Estimates and Forecasts to 2032 (USD Million)
10.4 Retail
10.4.1 Retail Market Trends Analysis (2020-2032)
10.4.2 Retail Market Size Estimates and Forecasts to 2032 (USD Million)
10.5 Healthcare
10.5.1 Healthcare Market Trends Analysis (2020-2032)
10.5.2 Healthcare Market Size Estimates and Forecasts to 2032 (USD Million)
10.6 Manufacturing
10.6.1 Manufacturing Market Trends Analysis (2020-2032)
10.6.2 Manufacturing Market Size Estimates and Forecasts to 2032 (USD Million)
10.7 Government & Defense
10.7.1 Government & Defense Market Trends Analysis (2020-2032)
10.7.2 Government & Defense Market Size Estimates and Forecasts to 2032 (USD Million)
10.8 Others
10.8.1 Others Market Trends Analysis (2020-2032)
10.8.2 Others Market Size Estimates and Forecasts to 2032 (USD Million)
11. Regional Analysis
11.1 Chapter Overview
11.2 North America
11.2.1 Trends Analysis
11.2.2 North America Business Process Management Market Estimates and Forecasts, by Country (2020-2032) (USD Million)
11.2.3 North America Business Process Management Market Estimates and Forecasts, by Solution (2020-2032) (USD Million)
11.2.4 North America Business Process Management Market Estimates and Forecasts, by Deployment (2020-2032) (USD Million)
11.2.5 North America Business Process Management Market Estimates and Forecasts, by organization size (2020-2032) (USD Million)
11.2.6 North America Business Process Management Market Estimates and Forecasts, By Application (2020-2032) (USD Million)
11.2.7 USA
11.2.7.1 USA Business Process Management Market Estimates and Forecasts, by Solution (2020-2032) (USD Million)
11.2.7.2 USA Business Process Management Market Estimates and Forecasts, by Deployment (2020-2032) (USD Million)
11.2.7.3 USA Business Process Management Market Estimates and Forecasts, by organization size (2020-2032) (USD Million)
11.2.7.4 USA Business Process Management Market Estimates and Forecasts, By Application (2020-2032) (USD Million)
11.2.7 Canada
11.2.7.1 Canada Business Process Management Market Estimates and Forecasts, by Solution (2020-2032) (USD Million)
11.2.7.2 Canada Business Process Management Market Estimates and Forecasts, by Deployment (2020-2032) (USD Million)
11.2.7.3 Canada Business Process Management Market Estimates and Forecasts, by organization size (2020-2032) (USD Million)
11.2.7.3 Canada Business Process Management Market Estimates and Forecasts, By Application (2020-2032) (USD Million)
11.2.8 Mexico
11.2.8.1 Mexico Business Process Management Market Estimates and Forecasts, by Solution (2020-2032) (USD Million)
11.2.8.2 Mexico Business Process Management Market Estimates and Forecasts, by Deployment (2020-2032) (USD Million)
11.2.8.3 Mexico Business Process Management Market Estimates and Forecasts, by organization size (2020-2032) (USD Million)
11.2.8.3 Mexico Business Process Management Market Estimates and Forecasts, By Application (2020-2032) (USD Million)
11.3 Europe
11.3.1 Eastern Europe
11.3.1.1 Trends Analysis
11.3.1.2 Eastern Europe Business Process Management Market Estimates and Forecasts, by Country (2020-2032) (USD Million)
11.3.1.3 Eastern Europe Business Process Management Market Estimates and Forecasts, by Solution (2020-2032) (USD Million)
11.3.1.4 Eastern Europe Business Process Management Market Estimates and Forecasts, by Deployment (2020-2032) (USD Million)
11.3.1.5 Eastern Europe Business Process Management Market Estimates and Forecasts, by organization size (2020-2032) (USD Million)
11.3.1.5 Eastern Europe Business Process Management Market Estimates and Forecasts, By Application (2020-2032) (USD Million)
11.3.1.6 Poland
11.3.1.6.1 Poland Business Process Management Market Estimates and Forecasts, by Solution (2020-2032) (USD Million)
11.3.1.6.2 Poland Business Process Management Market Estimates and Forecasts, by Deployment (2020-2032) (USD Million)
11.3.1.6.3 Poland Business Process Management Market Estimates and Forecasts, by organization size (2020-2032) (USD Million)
11.3.1.6.3 Poland Business Process Management Market Estimates and Forecasts, By Application (2020-2032) (USD Million)
11.3.1.7 Romania
11.3.1.7.1 Romania Business Process Management Market Estimates and Forecasts, by Solution (2020-2032) (USD Million)
11.3.1.7.2 Romania Business Process Management Market Estimates and Forecasts, by Deployment (2020-2032) (USD Million)
11.3.1.7.3 Romania Business Process Management Market Estimates and Forecasts, by organization size (2020-2032) (USD Million)
11.3.1.7.3 Romania Business Process Management Market Estimates and Forecasts, By Application (2020-2032) (USD Million)
11.3.1.8 Hungary
11.3.1.8.1 Hungary Business Process Management Market Estimates and Forecasts, by Solution (2020-2032) (USD Million)
11.3.1.8.2 Hungary Business Process Management Market Estimates and Forecasts, by Deployment (2020-2032) (USD Million)
11.3.1.8.3 Hungary Business Process Management Market Estimates and Forecasts, by organization size (2020-2032) (USD Million)
11.3.1.8.3 Hungary Business Process Management Market Estimates and Forecasts, By Application (2020-2032) (USD Million)
11.3.1.9 Turkey
11.3.1.9.1 Turkey Business Process Management Market Estimates and Forecasts, by Solution (2020-2032) (USD Million)
11.3.1.9.2 Turkey Business Process Management Market Estimates and Forecasts, by Deployment (2020-2032) (USD Million)
11.3.1.9.3 Turkey Business Process Management Market Estimates and Forecasts, by organization size (2020-2032) (USD Million)
11.3.1.9.3 Turkey Business Process Management Market Estimates and Forecasts, By Application (2020-2032) (USD Million)
11.3.1.11 Rest of Eastern Europe
11.3.1.11.1 Rest of Eastern Europe Business Process Management Market Estimates and Forecasts, by Solution (2020-2032) (USD Million)
11.3.1.11.2 Rest of Eastern Europe Business Process Management Market Estimates and Forecasts, by Deployment (2020-2032) (USD Million)
11.3.1.11.3 Rest of Eastern Europe Business Process Management Market Estimates and Forecasts, by organization size (2020-2032) (USD Million)
11.3.1.11.3 Rest of Eastern Europe Business Process Management Market Estimates and Forecasts, By Application (2020-2032) (USD Million)
11.3.2 Western Europe
11.3.2.1 Trends Analysis
11.3.2.2 Western Europe Business Process Management Market Estimates and Forecasts, by Country (2020-2032) (USD Million)
11.3.2.3 Western Europe Business Process Management Market Estimates and Forecasts, by Solution (2020-2032) (USD Million)
11.3.2.4 Western Europe Business Process Management Market Estimates and Forecasts, by Deployment (2020-2032) (USD Million)
11.3.2.5 Western Europe Business Process Management Market Estimates and Forecasts, by organization size (2020-2032) (USD Million)
11.3.2.5 Western Europe Business Process Management Market Estimates and Forecasts, By Application (2020-2032) (USD Million)
11.3.2.6 Germany
11.3.2.6.1 Germany Business Process Management Market Estimates and Forecasts, by Solution (2020-2032) (USD Million)
11.3.2.6.2 Germany Business Process Management Market Estimates and Forecasts, by Deployment (2020-2032) (USD Million)
11.3.2.6.3 Germany Business Process Management Market Estimates and Forecasts, by organization size (2020-2032) (USD Million)
11.3.2.6.3 Germany Business Process Management Market Estimates and Forecasts, By Application (2020-2032) (USD Million)
11.3.2.7 France
11.3.2.7.1 France Business Process Management Market Estimates and Forecasts, by Solution (2020-2032) (USD Million)
11.3.2.7.2 France Business Process Management Market Estimates and Forecasts, by Deployment (2020-2032) (USD Million)
11.3.2.7.3 France Business Process Management Market Estimates and Forecasts, by organization size (2020-2032) (USD Million)
11.3.2.7.3 France Business Process Management Market Estimates and Forecasts, By Application (2020-2032) (USD Million)
11.3.2.8 UK
11.3.2.8.1 UK Business Process Management Market Estimates and Forecasts, by Solution (2020-2032) (USD Million)
11.3.2.8.2 UK Business Process Management Market Estimates and Forecasts, by Deployment (2020-2032) (USD Million)
11.3.2.8.3 UK Business Process Management Market Estimates and Forecasts, by organization size (2020-2032) (USD Million)
11.3.2.8.3 UK Business Process Management Market Estimates and Forecasts, By Application (2020-2032) (USD Million)
11.3.2.9 Italy
11.3.2.9.1 Italy Business Process Management Market Estimates and Forecasts, by Solution (2020-2032) (USD Million)
11.3.2.9.2 Italy Business Process Management Market Estimates and Forecasts, by Deployment (2020-2032) (USD Million)
11.3.2.9.3 Italy Business Process Management Market Estimates and Forecasts, by organization size (2020-2032) (USD Million)
11.3.2.9.3 Italy Business Process Management Market Estimates and Forecasts, By Application (2020-2032) (USD Million)
11.3.2.11 Spain
11.3.2.11.1 Spain Business Process Management Market Estimates and Forecasts, by Solution (2020-2032) (USD Million)
11.3.2.11.2 Spain Business Process Management Market Estimates and Forecasts, by Deployment (2020-2032) (USD Million)
11.3.2.11.3 Spain Business Process Management Market Estimates and Forecasts, by organization size (2020-2032) (USD Million)
11.3.2.11.3 Spain Business Process Management Market Estimates and Forecasts, By Application (2020-2032) (USD Million)
11.3.2.11 Netherlands
11.3.2.11.1 Netherlands Business Process Management Market Estimates and Forecasts, by Solution (2020-2032) (USD Million)
11.3.2.11.2 Netherlands Business Process Management Market Estimates and Forecasts, by Deployment (2020-2032) (USD Million)
11.3.2.11.3 Netherlands Business Process Management Market Estimates and Forecasts, by organization size (2020-2032) (USD Million)
11.3.2.11.3 Netherlands Business Process Management Market Estimates and Forecasts, By Application (2020-2032) (USD Million)
11.3.2.12 Switzerland
11.3.2.12.1 Switzerland Business Process Management Market Estimates and Forecasts, by Solution (2020-2032) (USD Million)
11.3.2.12.2 Switzerland Business Process Management Market Estimates and Forecasts, by Deployment (2020-2032) (USD Million)
11.3.2.12.3 Switzerland Business Process Management Market Estimates and Forecasts, by organization size (2020-2032) (USD Million)
11.3.2.12.3 Switzerland Business Process Management Market Estimates and Forecasts, By Application (2020-2032) (USD Million)
11.3.2.13 Austria
11.3.2.13.1 Austria Business Process Management Market Estimates and Forecasts, by Solution (2020-2032) (USD Million)
11.3.2.13.2 Austria Business Process Management Market Estimates and Forecasts, by Deployment (2020-2032) (USD Million)
11.3.2.13.3 Austria Business Process Management Market Estimates and Forecasts, by organization size (2020-2032) (USD Million)
11.3.2.13.3 Austria Business Process Management Market Estimates and Forecasts, By Application (2020-2032) (USD Million)
11.3.2.14 Rest of Western Europe
11.3.2.14.1 Rest of Western Europe Business Process Management Market Estimates and Forecasts, by Solution (2020-2032) (USD Million)
11.3.2.14.2 Rest of Western Europe Business Process Management Market Estimates and Forecasts, by Deployment (2020-2032) (USD Million)
11.3.2.14.3 Rest of Western Europe Business Process Management Market Estimates and Forecasts, by organization size (2020-2032) (USD Million)
11.3.2.14.3 Rest of Western Europe Business Process Management Market Estimates and Forecasts, By Application (2020-2032) (USD Million)
11.4 Asia Pacific
11.4.1 Trends Analysis
11.4.2 Asia Pacific Business Process Management Market Estimates and Forecasts, by Country (2020-2032) (USD Million)
11.4.3 Asia Pacific Business Process Management Market Estimates and Forecasts, by Solution (2020-2032) (USD Million)
11.4.4 Asia Pacific Business Process Management Market Estimates and Forecasts, by Deployment (2020-2032) (USD Million)
11.4.5 Asia Pacific Business Process Management Market Estimates and Forecasts, by organization size (2020-2032) (USD Million)
11.4.5 Asia Pacific Business Process Management Market Estimates and Forecasts, By Application (2020-2032) (USD Million)
11.4.6 China
11.4.6.1 China Business Process Management Market Estimates and Forecasts, by Solution (2020-2032) (USD Million)
11.4.6.2 China Business Process Management Market Estimates and Forecasts, by Deployment (2020-2032) (USD Million)
11.4.6.3 China Business Process Management Market Estimates and Forecasts, by organization size (2020-2032) (USD Million)
11.4.6.3 China Business Process Management Market Estimates and Forecasts, By Application (2020-2032) (USD Million)
11.4.7 India
11.4.7.1 India Business Process Management Market Estimates and Forecasts, by Solution (2020-2032) (USD Million)
11.4.7.2 India Business Process Management Market Estimates and Forecasts, by Deployment (2020-2032) (USD Million)
11.4.7.3 India Business Process Management Market Estimates and Forecasts, by organization size (2020-2032) (USD Million)
11.4.7.3 India Business Process Management Market Estimates and Forecasts, By Application (2020-2032) (USD Million)
11.4.8 Japan
11.4.8.1 Japan Business Process Management Market Estimates and Forecasts, by Solution (2020-2032) (USD Million)
11.4.8.2 Japan Business Process Management Market Estimates and Forecasts, by Deployment (2020-2032) (USD Million)
11.4.8.3 Japan Business Process Management Market Estimates and Forecasts, by organization size (2020-2032) (USD Million)
11.4.8.3 Japan Business Process Management Market Estimates and Forecasts, By Application (2020-2032) (USD Million)
11.4.9 South Korea
11.4.9.1 South Korea Business Process Management Market Estimates and Forecasts, by Solution (2020-2032) (USD Million)
11.4.9.2 South Korea Business Process Management Market Estimates and Forecasts, by Deployment (2020-2032) (USD Million)
11.4.9.3 South Korea Business Process Management Market Estimates and Forecasts, by organization size (2020-2032) (USD Million)
11.4.9.3 South Korea Business Process Management Market Estimates and Forecasts, By Application (2020-2032) (USD Million)
11.4.11 Vietnam
11.4.11.1 Vietnam Business Process Management Market Estimates and Forecasts, by Solution (2020-2032) (USD Million)
11.4.11.2 Vietnam Business Process Management Market Estimates and Forecasts, by Deployment (2020-2032) (USD Million)
11.4.11.3 Vietnam Business Process Management Market Estimates and Forecasts, by organization size (2020-2032) (USD Million)
11.4.11.3 Vietnam Business Process Management Market Estimates and Forecasts, By Application (2020-2032) (USD Million)
11.4.11 Singapore
11.4.11.1 Singapore Business Process Management Market Estimates and Forecasts, by Solution (2020-2032) (USD Million)
11.4.11.2 Singapore Business Process Management Market Estimates and Forecasts, by Deployment (2020-2032) (USD Million)
11.4.11.3 Singapore Business Process Management Market Estimates and Forecasts, by organization size (2020-2032) (USD Million)
11.4.11.3 Singapore Business Process Management Market Estimates and Forecasts, By Application (2020-2032) (USD Million)
11.4.12 Australia
11.4.12.1 Australia Business Process Management Market Estimates and Forecasts, by Solution (2020-2032) (USD Million)
11.4.12.2 Australia Business Process Management Market Estimates and Forecasts, by Deployment (2020-2032) (USD Million)
11.4.12.3 Australia Business Process Management Market Estimates and Forecasts, by organization size (2020-2032) (USD Million)
11.4.12.3 Australia Business Process Management Market Estimates and Forecasts, By Application (2020-2032) (USD Million)
11.4.13 Rest of Asia Pacific
11.4.13.1 Rest of Asia Pacific Business Process Management Market Estimates and Forecasts, by Solution (2020-2032) (USD Million)
11.4.13.2 Rest of Asia Pacific Business Process Management Market Estimates and Forecasts, by Deployment (2020-2032) (USD Million)
11.4.13.3 Rest of Asia Pacific Business Process Management Market Estimates and Forecasts, by organization size (2020-2032) (USD Million)
11.4.13.3 Rest of Asia Pacific Business Process Management Market Estimates and Forecasts, By Application (2020-2032) (USD Million)
11.5 Middle East and Africa
11.5.1 Middle East
11.5.1.1 Trends Analysis
11.5.1.2 Middle East Business Process Management Market Estimates and Forecasts, by Country (2020-2032) (USD Million)
11.5.1.3 Middle East Business Process Management Market Estimates and Forecasts, by Solution (2020-2032) (USD Million)
11.5.1.4 Middle East Business Process Management Market Estimates and Forecasts, by Deployment (2020-2032) (USD Million)
11.5.1.5 Middle East Business Process Management Market Estimates and Forecasts, by organization size (2020-2032) (USD Million)
11.5.1.5 Middle East Business Process Management Market Estimates and Forecasts, By Application (2020-2032) (USD Million)
11.5.1.6 UAE
11.5.1.6.1 UAE Business Process Management Market Estimates and Forecasts, by Solution (2020-2032) (USD Million)
11.5.1.6.2 UAE Business Process Management Market Estimates and Forecasts, by Deployment (2020-2032) (USD Million)
11.5.1.6.3 UAE Business Process Management Market Estimates and Forecasts, by organization size (2020-2032) (USD Million)
11.5.1.6.3 UAE Business Process Management Market Estimates and Forecasts, By Application (2020-2032) (USD Million)
11.5.1.7 Egypt
11.5.1.7.1 Egypt Business Process Management Market Estimates and Forecasts, by Solution (2020-2032) (USD Million)
11.5.1.7.2 Egypt Business Process Management Market Estimates and Forecasts, by Deployment (2020-2032) (USD Million)
11.5.1.7.3 Egypt Business Process Management Market Estimates and Forecasts, by organization size (2020-2032) (USD Million)
11.5.1.7.3 Egypt Business Process Management Market Estimates and Forecasts, By Application (2020-2032) (USD Million)
11.5.1.8 Saudi Arabia
11.5.1.8.1 Saudi Arabia Business Process Management Market Estimates and Forecasts, by Solution (2020-2032) (USD Million)
11.5.1.8.2 Saudi Arabia Business Process Management Market Estimates and Forecasts, by Deployment (2020-2032) (USD Million)
11.5.1.8.3 Saudi Arabia Business Process Management Market Estimates and Forecasts, by organization size (2020-2032) (USD Million)
11.5.1.8.3 Saudi Arabia Business Process Management Market Estimates and Forecasts, By Application (2020-2032) (USD Million)
11.5.1.9 Qatar
11.5.1.9.1 Qatar Business Process Management Market Estimates and Forecasts, by Solution (2020-2032) (USD Million)
11.5.1.9.2 Qatar Business Process Management Market Estimates and Forecasts, by Deployment (2020-2032) (USD Million)
11.5.1.9.3 Qatar Business Process Management Market Estimates and Forecasts, by organization size (2020-2032) (USD Million)
11.5.1.9.3 Qatar Business Process Management Market Estimates and Forecasts, By Application (2020-2032) (USD Million)
11.5.1.11 Rest of Middle East
11.5.1.11.1 Rest of Middle East Business Process Management Market Estimates and Forecasts, by Solution (2020-2032) (USD Million)
11.5.1.11.2 Rest of Middle East Business Process Management Market Estimates and Forecasts, by Deployment (2020-2032) (USD Million)
11.5.1.11.3 Rest of Middle East Business Process Management Market Estimates and Forecasts, by organization size (2020-2032) (USD Million)
11.5.1.11.3 Rest of Middle East Business Process Management Market Estimates and Forecasts, By Application (2020-2032) (USD Million)
11.5.2 Africa
11.5.2.1 Trends Analysis
11.5.2.2 Africa Business Process Management Market Estimates and Forecasts, by Country (2020-2032) (USD Million)
11.5.2.3 Africa Business Process Management Market Estimates and Forecasts, by Solution (2020-2032) (USD Million)
11.5.2.4 Africa Business Process Management Market Estimates and Forecasts, by Deployment (2020-2032) (USD Million)
11.5.2.5 Africa Business Process Management Market Estimates and Forecasts, by organization size (2020-2032) (USD Million)
11.5.2.8.3 Africa Business Process Management Market Estimates and Forecasts, By Application (2020-2032) (USD Million)
11.5.2.6 South Africa
11.5.2.6.1 South Africa Business Process Management Market Estimates and Forecasts, by Solution (2020-2032) (USD Million)
11.5.2.6.2 South Africa Business Process Management Market Estimates and Forecasts, by Deployment (2020-2032) (USD Million)
11.5.2.6.3 South Africa Business Process Management Market Estimates and Forecasts, by organization size (2020-2032) (USD Million)
11.5.2.8.3 South Africa Business Process Management Market Estimates and Forecasts, By Application (2020-2032) (USD Million)
11.5.2.7 Nigeria
11.5.2.7.1 Nigeria Business Process Management Market Estimates and Forecasts, by Solution (2020-2032) (USD Million)
11.5.2.7.2 Nigeria Business Process Management Market Estimates and Forecasts, by Deployment (2020-2032) (USD Million)
11.5.2.7.3 Nigeria Business Process Management Market Estimates and Forecasts, by organization size (2020-2032) (USD Million)
11.5.2.8.3 Nigeria Business Process Management Market Estimates and Forecasts, By Application (2020-2032) (USD Million)
11.5.2.8 Rest of Africa
11.5.2.8.1 Rest of Africa Business Process Management Market Estimates and Forecasts, by Solution (2020-2032) (USD Million)
11.5.2.8.2 Rest of Africa Business Process Management Market Estimates and Forecasts, by Deployment (2020-2032) (USD Million)
11.5.2.8.3 Rest of Africa Business Process Management Market Estimates and Forecasts, by organization size (2020-2032) (USD Million)
11.5.2.8.3 Rest of Africa Business Process Management Market Estimates and Forecasts, By Application (2020-2032) (USD Million)
11.6 Latin America
11.6.1 Trends Analysis
11.6.2 Latin America Business Process Management Market Estimates and Forecasts, by Country (2020-2032) (USD Million)
11.6.3 Latin America Business Process Management Market Estimates and Forecasts, by Solution (2020-2032) (USD Million)
11.6.4 Latin America Business Process Management Market Estimates and Forecasts, by Deployment (2020-2032) (USD Million)
11.6.5 Latin America Business Process Management Market Estimates and Forecasts, by organization size (2020-2032) (USD Million)
11.6.5 Latin America Business Process Management Market Estimates and Forecasts, By Application (2020-2032) (USD Million)
11.6.6 Brazil
11.6.6.1 Brazil Business Process Management Market Estimates and Forecasts, by Solution (2020-2032) (USD Million)
11.6.6.2 Brazil Business Process Management Market Estimates and Forecasts, by Deployment (2020-2032) (USD Million)
11.6.6.3 Brazil Business Process Management Market Estimates and Forecasts, by organization size (2020-2032) (USD Million)
11.6.6.3 Brazil Business Process Management Market Estimates and Forecasts, By Application (2020-2032) (USD Million)
11.6.7 Argentina
11.6.7.1 Argentina Business Process Management Market Estimates and Forecasts, by Solution (2020-2032) (USD Million)
11.6.7.2 Argentina Business Process Management Market Estimates and Forecasts, by Deployment (2020-2032) (USD Million)
11.6.7.3 Argentina Business Process Management Market Estimates and Forecasts, by organization size (2020-2032) (USD Million)
11.6.7.3 Argentina Business Process Management Market Estimates and Forecasts, By Application (2020-2032) (USD Million)
11.6.8 Colombia
11.6.8.1 Colombia Business Process Management Market Estimates and Forecasts, by Solution (2020-2032) (USD Million)
11.6.8.2 Colombia Business Process Management Market Estimates and Forecasts, by Deployment (2020-2032) (USD Million)
11.6.8.3 Colombia Business Process Management Market Estimates and Forecasts, by organization size (2020-2032) (USD Million)
11.6.8.3 Colombia Business Process Management Market Estimates and Forecasts, By Application (2020-2032) (USD Million)
11.6.9 Rest of Latin America
11.6.9.1 Rest of Latin America Business Process Management Market Estimates and Forecasts, by Solution (2020-2032) (USD Million)
11.6.9.2 Rest of Latin America Business Process Management Market Estimates and Forecasts, by Deployment (2020-2032) (USD Million)
11.6.9.3 Rest of Latin America Business Process Management Market Estimates and Forecasts, by organization size (2020-2032) (USD Million)
11.6.9.3 Rest of Latin America Business Process Management Market Estimates and Forecasts, By Application (2020-2032) (USD Million)
12. Company Profiles
12.1 IBM Corporation
12.1.1 Company Overview
12.1.2 Financial
12.1.3 Products/ Services Offered
12.1.4 SWOT Analysis
12.2 Pegasystems
12.2.1 Company Overview
12.2.2 Financial
12.2.3 Products/ Services Offered
12.2.4 SWOT Analysis
12.3 Appian
12.3.1 Company Overview
12.3.2 Financial
12.3.3 Products/ Services Offered
12.3.4 SWOT Analysis
12.4 Oracle
12.4.1 Company Overview
12.4.2 Financial
12.4.3 Products/ Services Offered
12.4.4 SWOT Analysis
12.5 Software AG
12.5.1 Company Overview
12.5.2 Financial
12.5.3 Products/ Services Offered
12.5.4 SWOT Analysis
12.6 Nintex
12.6.1 Company Overview
12.6.2 Financial
12.6.3 Products/ Services Offered
12.6.4 SWOT Analysis
12.7 OpenText
12.7.1 Company Overview
12.7.2 Financial
12.7.3 Products/ Services Offered
12.7.4 SWOT Analysis
12.8 Newgen Software
12.8.1 Company Overview
12.8.2 Financial
12.8.3 Products/ Services Offered
12.8.4 SWOT Analysis
12.9 Genpact
12.9.1 Company Overview
12.9.2 Financial
12.9.3 Products/ Services Offered
12.9.4 SWOT Analysis
12.10 TIBCO
12.10.1 Company Overview
12.10.2 Financial
12.10.3 Products/ Services Offered
12.10.4 SWOT Analysis
13. Use Cases and Best Practices
14. Conclusion
An accurate research report requires proper strategizing as well as implementation. There are multiple factors involved in the completion of good and accurate research report and selecting the best methodology to compete the research is the toughest part. Since the research reports we provide play a crucial role in any company’s decision-making process, therefore we at SNS Insider always believe that we should choose the best method which gives us results closer to reality. This allows us to reach at a stage wherein we can provide our clients best and accurate investment to output ratio.
Each report that we prepare takes a timeframe of 350-400 business hours for production. Starting from the selection of titles through a couple of in-depth brain storming session to the final QC process before uploading our titles on our website we dedicate around 350 working hours. The titles are selected based on their current market cap and the foreseen CAGR and growth.
The 5 steps process:
Step 1: Secondary Research:
Secondary Research or Desk Research is as the name suggests is a research process wherein, we collect data through the readily available information. In this process we use various paid and unpaid databases which our team has access to and gather data through the same. This includes examining of listed companies’ annual reports, Journals, SEC filling etc. Apart from this our team has access to various associations across the globe across different industries. Lastly, we have exchange relationships with various university as well as individual libraries.
Step 2: Primary Research
When we talk about primary research, it is a type of study in which the researchers collect relevant data samples directly, rather than relying on previously collected data. This type of research is focused on gaining content specific facts that can be sued to solve specific problems. Since the collected data is fresh and first hand therefore it makes the study more accurate and genuine.
We at SNS Insider have divided Primary Research into 2 parts.
Part 1 wherein we interview the KOLs of major players as well as the upcoming ones across various geographic regions. This allows us to have their view over the market scenario and acts as an important tool to come closer to the accurate market numbers. As many as 45 paid and unpaid primary interviews are taken from both the demand and supply side of the industry to make sure we land at an accurate judgement and analysis of the market.
This step involves the triangulation of data wherein our team analyses the interview transcripts, online survey responses and observation of on filed participants. The below mentioned chart should give a better understanding of the part 1 of the primary interview.
Part 2: In this part of primary research the data collected via secondary research and the part 1 of the primary research is validated with the interviews from individual consultants and subject matter experts.
Consultants are those set of people who have at least 12 years of experience and expertise within the industry whereas Subject Matter Experts are those with at least 15 years of experience behind their back within the same space. The data with the help of two main processes i.e., FGDs (Focused Group Discussions) and IDs (Individual Discussions). This gives us a 3rd party nonbiased primary view of the market scenario making it a more dependable one while collation of the data pointers.
Step 3: Data Bank Validation
Once all the information is collected via primary and secondary sources, we run that information for data validation. At our intelligence centre our research heads track a lot of information related to the market which includes the quarterly reports, the daily stock prices, and other relevant information. Our data bank server gets updated every fortnight and that is how the information which we collected using our primary and secondary information is revalidated in real time.
Step 4: QA/QC Process
After all the data collection and validation our team does a final level of quality check and quality assurance to get rid of any unwanted or undesired mistakes. This might include but not limited to getting rid of the any typos, duplication of numbers or missing of any important information. The people involved in this process include technical content writers, research heads and graphics people. Once this process is completed the title gets uploader on our platform for our clients to read it.
Step 5: Final QC/QA Process:
This is the last process and comes when the client has ordered the study. In this process a final QA/QC is done before the study is emailed to the client. Since we believe in giving our clients a good experience of our research studies, therefore, to make sure that we do not lack at our end in any way humanly possible we do a final round of quality check and then dispatch the study to the client.
Key Segments:
By Solution
Process Modeling
Monitoring & Optimization
Automation
Content & Document Management
Integration
Others
By Deployment
Cloud-based
On-premise
By organization size
Large Enterprise
SMEs
By Application
BFSI
IT
Healthcare
Retail
Manufacturing
Government & Defense
Others
Request for Segment Customization as per your Business Requirement: Segment Customization Request
REGIONAL COVERAGE:
North America
US
Canada
Mexico
Europe
Eastern Europe
Poland
Romania
Hungary
Turkey
Rest of Eastern Europe
Western Europe
Germany
France
UK
Italy
Spain
Netherlands
Switzerland
Austria
Rest of Western Europe
Asia Pacific
China
India
Japan
South Korea
Vietnam
Singapore
Australia
Rest of Asia Pacific
Middle East & Africa
Middle East
UAE
Egypt
Saudi Arabia
Qatar
Rest of the Middle East
Africa
Nigeria
South Africa
Rest of Africa
Latin America
Brazil
Argentina
Colombia
Request for Country Level Research Report: Country Level Customization Request
Available Customization
With the given market data, SNS Insider offers customization as per the company’s specific needs. The following customization options are available for the report:
Product Analysis
Criss-Cross segment analysis (e.g. Product X Application)
Product Matrix which gives a detailed comparison of product portfolio of each company
Geographic Analysis
Additional countries in any of the regions
Company Information
Detailed analysis and profiling of additional market players (Up to five)
Smart Cities Market was valued at USD 606.3 billion in 2023 and is expected to reach USD 3052.7 billion by 2032, growing at a CAGR of 19.69% from 2024-2032.
Network Attached Storage Market was worth USD 31.71 billion in 2023 and is predicted to be worth USD 109.72 billion by 2032, growing at a CAGR of 14.82% between 2024 and 2032.
Computer Vision Market Size was valued at USD 16.45 Billion in 2023 and is expected to reach USD 83.92 Billion by 2032 and grow at a CAGR of 19.85 % over the forecast period 2024-2032.
The Contract Lifecycle Management (CLM) Software Market Size was recorded at USD 1.72 Billion in 2023 and is expected to surpass USD 5.10 Billion by 2032, growing at a CAGR of 12.85 % over the forecast period 2024-2032.
The Video on Demand Market Size was valued at USD 97.16 Billion in 2023 and will reach USD 405 Billion by 2032 and grow at a CAGR of 17.2% by 2024-2032.
The Private LTE market, valued at USD 5.48 Billion in 2023, is projected to reach USD 14.88 Billion by 2032, growing at a compound annual growth rate CAGR of 12.41% during the forecast period.
Hi! Click one of our member below to chat on Phone