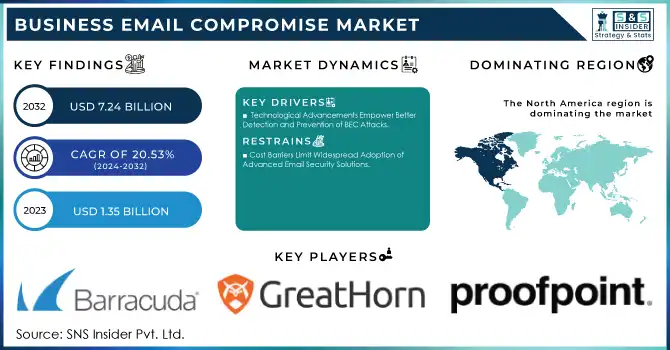
The Business Email Compromise Market was valued at USD 1.35 billion in 2023 and is expected to reach USD 7.24 billion by 2032, growing at a CAGR of 20.53% from 2024-2032.
To Get More Information on Business Email Compromise (BEC) Market - Request Sample Report
The Business Email Compromise market is witnessing substantial expansion as the incidence and complexity of cyberattacks aimed at companies globally keep increasing. Acronis' Cyberthreats Report for H1 2024 disclosed an astonishing 293% rise in email attacks relative to the prior year, highlighting a significant uptick in phishing and social engineering methods. Furthermore, the Internet Crime Complaint Center reports that from October 2013 to December 2023, there were more than 305,000 reported BEC cases worldwide, leading to an overall loss of USD 55.5 billion. The rise in cyber threats is primarily fueled by the growing dependence on digital communication platforms and remote work, which has heightened organizations' exposure to BEC risks. Consequently, there is an increasing need for sophisticated security measures that can identify and combat these email-related scams instantly. This increased demand for security tools is driving companies to allocate resources to systems that can avert financial losses and protect confidential data.
In response to the growing threats, the need for BEC prevention services is notably high in industries like finance, healthcare, and e-commerce, where the impacts of fraud are particularly significant. A recent report reveals that GenAI has caused a 1,760% increase in Business Email Compromise attacks, underscoring the growing magnitude of these dangers. In 2024, Abnormal Security disclosed that the manufacturing industry saw a 56% surge in BEC attacks and a 24% increase in Vendor Email Compromise attacks. As BEC strategies grow more advanced, businesses are increasingly seeking out innovative solutions driven by artificial intelligence and machine learning to maintain an edge over cybercriminals. These technologies improve the capacity to recognize questionable email behavior, automate threat identification, and simplify response measures, speeding up the expansion of the BEC prevention sector.
In 2024, Mimecast enhanced its email security solutions with AI-powered features to more effectively address Business Email Compromise attacks, underscoring the increasing trend of incorporating advanced technologies into cybersecurity systems. As we look ahead, the BEC market offers significant prospects as companies keep encountering changing cyber threats. As cybercriminals continuously evolve their tactics, companies must depend on robust cybersecurity frameworks that blend effortlessly with their current IT systems. Moreover, as businesses grow internationally, there will be a heightened demand for security solutions designed to adhere to local regulations and compliance requirements. This changing environment guarantees that the BEC market will stay vibrant, providing numerous chances for development and creativity in the future.
Market Dynamics
Drivers
The Shift to Remote and Hybrid Work Models Heightens Email Security Risks
The growing adoption of remote and hybrid work models has significantly altered the traditional business landscape, leading to an expanded attack surface. As employees access company emails from various locations and devices, email systems are exposed to greater vulnerabilities. Cybercriminals exploit these gaps through tactics like phishing, social engineering, and spoofing to carry out Business Email Compromise (BEC) attacks. Remote work environments often lack the same security controls and monitoring present in centralized office settings, making it more difficult to detect malicious activities. Furthermore, the blurred boundaries between personal and professional communication increase the risk of compromised accounts and fraudulent transactions. This shift underscores the urgent need for robust email security solutions to protect sensitive data and prevent significant financial losses, which fuels the demand for advanced security tools in the BEC market.
Technological Advancements Empower Better Detection and Prevention of BEC Attacks
Innovations in artificial intelligence, machine learning, and advanced threat detection systems are significantly enhancing the capability to identify and mitigate Business Email Compromise attacks. These technologies enable real-time analysis of email patterns and behaviors, allowing security systems to detect anomalies and suspicious activities faster than traditional methods. AI and machine learning algorithms continuously evolve, learning from new attack vectors and adapting to increasingly sophisticated phishing attempts. As a result, businesses can respond to potential threats with greater precision and speed. Additionally, predictive analytics allows for the early identification of emerging BEC tactics, enabling organizations to implement proactive defense strategies. The integration of these cutting-edge technologies into email security systems is critical to safeguarding sensitive communications and financial transactions, prompting widespread adoption across industries.
Restraints
Cost Barriers Limit Widespread Adoption of Advanced Email Security Solutions
The adoption of advanced email security solutions, such as AI-driven threat detection systems, can be prohibitively expensive, particularly for small and medium-sized enterprises. These businesses often face budget constraints and may find it difficult to justify the high upfront and ongoing costs associated with implementing sophisticated cybersecurity measures. While larger enterprises can absorb these expenses, SMEs may struggle to allocate sufficient resources for the necessary tools to protect against Business Email Compromise attacks. The cost of training employees, maintaining security systems, and continuously updating software further adds to the financial burden. As a result, many smaller organizations are either delayed in adopting these solutions or choose to rely on less robust, more affordable options, potentially leaving them vulnerable to evolving cyber threats.
The Constant Evolution of Cyberthreats Challenges Effective BEC Defense
Cybercriminals continuously adapt their tactics to bypass security systems, making it increasingly difficult for businesses to stay ahead of Business Email Compromise attacks. The dynamic nature of these cyber threats means that traditional security measures are often not enough to counter the latest phishing schemes, social engineering tactics, and email spoofing methods. As attackers refine their approaches, organizations are left scrambling to update their defenses, which can lead to gaps in protection. This rapid evolution poses a significant challenge for security solutions, requiring constant innovation and adaptation to prevent breaches. Additionally, the time it takes for businesses to implement new strategies or tools can result in missed opportunities for prevention, leaving organizations vulnerable to attacks. The fast-changing nature of cyber threats complicates the process of maintaining robust and effective BEC defenses.
Segment Analysis
By Component
In 2023, the Solution segment dominated the Business Email Compromise market, accounting for approximately 72% of the revenue share. This dominance is primarily due to the increasing demand for advanced security solutions that can prevent and detect sophisticated BEC attacks. The widespread adoption of AI-driven threat detection systems, along with robust email filtering technologies, has become essential for businesses to safeguard against rising cyber threats. As organizations prioritize proactive security measures, solutions offering enhanced protection continue to lead market growth.
The Service segment is expected to grow at the fastest CAGR of 22.24% from 2024 to 2032. This surge can be attributed to the increasing need for specialized services such as incident response, threat intelligence, and security consulting. As businesses face evolving BEC tactics, the demand for expert services to implement, manage, and optimize security solutions is growing rapidly. The increasing complexity of email-based threats has made continuous support and personalized solutions a vital aspect of comprehensive defense strategies.
By Organization Size
In 2023, the Large Enterprises segment led the Business Email Compromise market with the highest revenue share of approximately 66%. This dominance is largely attributed to their significant resources, which allow for comprehensive investments in advanced security solutions and dedicated cybersecurity teams. Large enterprises are prime targets for cybercriminals due to their valuable data and high-profile operations, making them more inclined to implement robust, multi-layered defenses against BEC attacks.
The SMEs segment is expected to grow at the fastest CAGR of about 22.14% from 2024 to 2032. As BEC attacks become more prevalent and sophisticated, SMEs are increasingly recognizing the importance of email security. Despite having fewer resources than large enterprises, SMEs are turning to more affordable and scalable security solutions, driving market growth. The rising awareness of BEC risks and the need to safeguard their operations and customer trust are key factors contributing to the rapid adoption of security measures in this segment.
By Vertical
In 2023, the BFSI segment led the Business Email Compromise market, capturing the largest revenue share of about 23%. This dominance is driven by the sector's high value and sensitivity to cyber threats, making it a prime target for BEC attacks. Financial institutions handle vast amounts of sensitive financial data and transactions, which require advanced email security solutions to prevent fraud and unauthorized access. Consequently, BFSI organizations continue to invest heavily in securing their communication channels against the growing threat of BEC.
The Healthcare segment is expected to grow at the fastest CAGR of 24.03% from 2024 to 2032. This rapid growth is fueled by the increasing digitalization of healthcare services, which has led to a surge in email-based communication. With healthcare organizations storing sensitive patient information, they are becoming more attractive targets for BEC attacks. As the sector faces mounting pressure to secure patient data and comply with regulatory requirements, the demand for specialized email security solutions is set to rise, driving the segment's expansion.
Regional Analysis
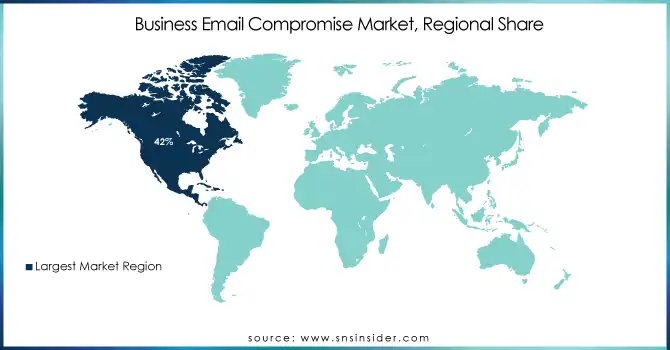
In 2023, North America dominated the Business Email Compromise market, accounting for approximately 42% of the revenue share. This leadership can be attributed to the region's highly developed infrastructure, technological advancements, and the presence of major financial institutions and corporations. As one of the most targeted regions for cyberattacks, North American businesses are increasingly adopting advanced email security solutions to protect sensitive data and prevent financial losses from BEC schemes. The growing awareness of cybersecurity risks and the regulatory landscape also contribute to the strong market presence.
The Asia Pacific region is expected to experience the fastest CAGR of 22.39% from 2024 to 2032. This rapid growth is driven by the region’s accelerating digital transformation and the expanding adoption of cloud-based services. As businesses in Asia Pacific increasingly shift to digital platforms, the need for robust email security solutions to counter BEC threats becomes more urgent. Additionally, rising awareness of cyber risks, along with improving cybersecurity frameworks, is fueling the demand for advanced protection, positioning the region for significant market expansion in the coming years.
Get Customized Report as per your Business Requirement - Request For Customized Report
Key Players
Acronis International GmbH (Acronis Cyber Protect, Acronis True Image)
Broadcom (Symantec Endpoint Protection, Web Security Service)
Cellopoint International Corp. (CelloPoint Mail Filtering, CelloPoint Data Protection)
Check Point Software Technologies Ltd. (Check Point Anti-Bot, Check Point Threat Prevention)
Fortra, LLC (GoAnywhere, Data Security Solutions)
GreatHorn, Inc. (GreatHorn Email Security, GreatHorn Phishing Detection)
Mimecast.com (Mimecast Email Security, Mimecast Archiving)
Proofpoint (Proofpoint Email Protection, Proofpoint Threat Response)
Tessian Limited (Tessian for Gmail, Tessian for Microsoft 365)
Trend Micro Incorporated (Trend Micro Apex One, Trend Micro Cloud App Security)
Agari Inc. (Agari Phishing Defense, Agari Email Security)
Armorblox Incorporation (Armorblox Email Security, Armorblox Threat Intelligence)
Abnormal Security Inc. (Abnormal Email Security, Abnormal Behavioral AI)
Barracuda Networks Incorporation (Barracuda Email Security, Barracuda Web Security)
Clearswift GmbH (ClearSwift Secure Email Gateway, ClearSwift Secure Web Gateway)
Cisco Inc. (Cisco Umbrella, Cisco Email Security)
Check Point Inc. (Check Point SandBlast, Check Point Endpoint Protection)
Fortinet Corporation (FortiMail, FortiGate)
GreatHorn Incorporation (GreatHorn Advanced Threat Protection, GreatHorn Digital Risk Protection)
Heimdal Security Solutions Company Ltd. (Heimdal Security Threat Prevention, Heimdal Endpoint Protection)
IRONSCALES (IRONSCALES Email Security, IRONSCALES Phishing Simulation)
Mimecast Limited (Mimecast Targeted Threat Protection, Mimecast Secure Email Gateway)
Proofpoint Inc. (Proofpoint Essentials, Proofpoint Advanced Threat Protection)
PhishLabs Corp. (PhishLabs Security Awareness Training, PhishLabs Phishing Protection)
Recent Developments:
In 2024, Cellopoint partnered with Abusix to integrate its Mail Intelligence for enhanced email security, reducing spam and malware incidents, cutting false positives and negatives, and improving analyst productivity.
In 2024, Mimecast introduced AI-powered updates to its email security solutions, focusing on enhancing protection against Business Email Compromise attacks. The updates leverage AI and natural language processing to detect payloadless threats, improve threat detection, and reduce the risk of insider data breaches.
Report Attributes | Details |
Market Size in 2023 | USD 1.35 Billion |
Market Size by 2032 | USD 7.24 Billion |
CAGR | CAGR of 20.53% From 2024 to 2032 |
Base Year | 2023 |
Forecast Period | 2024-2032 |
Historical Data | 2020-2022 |
Report Scope & Coverage | Market Size, Segments Analysis, Competitive Landscape, Regional Analysis, DROC & SWOT Analysis, Forecast Outlook |
Key Segments | • By Type (Solution, Service) • By Deployment (Cloud, On-premises) • By Organization Size (SMEs, Large Enterprises) • By Vertical (BFSI, Government, IT and Telecommunications, Energy and Utilities, Manufacturing, Retail and E-Commerce, Healthcare, Others) |
Regional Analysis/Coverage | North America (US, Canada, Mexico), Europe (Eastern Europe [Poland, Romania, Hungary, Turkey, Rest of Eastern Europe] Western Europe] Germany, France, UK, Italy, Spain, Netherlands, Switzerland, Austria, Rest of Western Europe]), Asia Pacific (China, India, Japan, South Korea, Vietnam, Singapore, Australia, Rest of Asia Pacific), Middle East & Africa (Middle East [UAE, Egypt, Saudi Arabia, Qatar, Rest of Middle East], Africa [Nigeria, South Africa, Rest of Africa], Latin America (Brazil, Argentina, Colombia, Rest of Latin America) |
Company Profiles | Acronis International GmbH, Broadcom, Cellopoint International Corp., Check Point Software Technologies Ltd., Fortra, LLC, GreatHorn, Inc., Mimecast.com, Proofpoint, Tessian Limited, Trend Micro Incorporated, Agari Inc., Armorblox Incorporation, Abnormal Security Inc., Barracuda Networks Incorporation, Clearswift GmbH, Cisco Inc., Check Point Inc., Fortinet Corporation, GreatHorn Incorporation, Heimdal Security Solutions Company Ltd., IRONSCALES, Mimecast Limited, Proofpoint Inc., PhishLabs Corp. |
Key Drivers | • The Shift to Remote and Hybrid Work Models Heightens Email Security Risks • Technological Advancements Empower Better Detection and Prevention of BEC Attacks |
RESTRAINTS | • Cost Barriers Limit Widespread Adoption of Advanced Email Security Solutions • The Constant Evolution of Cyberthreats Challenges Effective BEC Defense |
Ans: Business Email Compromise Market was valued at USD 1.35 billion in 2023 and is expected to reach USD 7.24 billion by 2032, growing at a CAGR of 20.53% from 2024-2032.
Ans. The Asia Pacific region is expected to grow at the fastest CAGR of 22.39% from 2024 to 2032.
Ans. The increasing prevalence of BEC attacks and rising awareness of email security are driving the demand for BEC solutions in SMEs.
Ans: Large Enterprises accounted for approximately 66% of the BEC market revenue share in 2023.
Ans: The Healthcare sector is expected to grow at the fastest CAGR of 24.03% from 2024 to 2032.
Table of Contents
1. Introduction
1.1 Market Definition
1.2 Scope (Inclusion and Exclusions)
1.3 Research Assumptions
2. Executive Summary
2.1 Market Overview
2.2 Regional Synopsis
2.3 Competitive Summary
3. Research Methodology
3.1 Top-Down Approach
3.2 Bottom-up Approach
3.3. Data Validation
3.4 Primary Interviews
4. Market Dynamics Impact Analysis
4.1 Market Driving Factors Analysis
4.1.1 Drivers
4.1.2 Restraints
4.2 PESTLE Analysis
4.3 Porter’s Five Forces Model
5. Statistical Insights and Trends Reporting
5.1 Adoption Rates of Emerging Technologies
5.2 Network Infrastructure Expansion, by Region
5.3 Cybersecurity Incidents, by Region (2020-2023)
5.4 Cloud Services Usage, by Region
6. Competitive Landscape
6.1 List of Major Companies, By Region
6.2 Market Share Analysis, By Region
6.3 Product Benchmarking
6.3.1 Product specifications and features
6.3.2 Pricing
6.4 Strategic Initiatives
6.4.1 Marketing and promotional activities
6.4.2 Distribution and supply chain strategies
6.4.3 Expansion plans and new product launches
6.4.4 Strategic partnerships and collaborations
6.5 Technological Advancements
6.6 Market Positioning and Branding
7. Business Email Compromise Market Segmentation, By Offering
7.1 Chapter Overview
7.2 Solution
7.2.1 Solution Market Trends Analysis (2020-2032)
7.2.2 Solution Market Size Estimates and Forecasts to 2032 (USD Billion)
7.3 Service
7.3.1 Service Market Trends Analysis (2020-2032)
7.3.2 Service Market Size Estimates and Forecasts to 2032 (USD Billion)
8. Business Email Compromise Market Segmentation, By Deployment
8.1 Chapter Overview
8.2 Cloud
8.2.1 Cloud Market Trends Analysis (2020-2032)
8.2.2 Cloud Market Size Estimates and Forecasts to 2032 (USD Billion)
8.3 On-premises
8.3.1 On-premises Market Trends Analysis (2020-2032)
8.3.2 On-premises Market Size Estimates and Forecasts to 2032 (USD Billion)
9. Business Email Compromise Market Segmentation, By Vertical
9.1 Chapter Overview
9.2 BFSI
9.2.1 BFSI Market Trends Analysis (2020-2032)
9.2.2 BFSI Market Size Estimates and Forecasts to 2032 (USD Billion)
9.3 Government
9.3.1 Government Market Trends Analysis (2020-2032)
9.3.2 Government Market Size Estimates and Forecasts to 2032 (USD Billion)
9.4 IT and Telecommunications
9.4.1 IT and Telecommunications Market Trends Analysis (2020-2032)
9.4.2 IT and Telecommunications Market Size Estimates and Forecasts to 2032 (USD Billion)
9.5 Energy and Utilities
9.5.1 Energy and Utilities Market Trends Analysis (2020-2032)
9.5.2 Energy and Utilities Market Size Estimates and Forecasts to 2032 (USD Billion)
9.6 Manufacturing
9.6.1 Manufacturing Market Trends Analysis (2020-2032)
9.6.2 Manufacturing Market Size Estimates and Forecasts to 2032 (USD Billion)
9.7 Retail and E-Commerce
9.7.1 Retail and E-Commerce Market Trends Analysis (2020-2032)
9.7.2 Retail and E-Commerce Market Size Estimates and Forecasts to 2032 (USD Billion)
9.8 Healthcare
9.8.1 Healthcare Market Trends Analysis (2020-2032)
9.8.2 Healthcare Market Size Estimates and Forecasts to 2032 (USD Billion)
9.9 Others
9.9.1 Others Market Trends Analysis (2020-2032)
9.9.2 Others Market Size Estimates and Forecasts to 2032 (USD Billion)
10. Business Email Compromise Market Segmentation, By Organization Size
10.1 Chapter Overview
10.2 SMEs
10.2.1 SMEs Market Trends Analysis (2020-2032)
10.2.2 SMEs Market Size Estimates and Forecasts to 2032 (USD Billion)
10.3 Large Enterprises
10.3.1 Large Enterprises Market Trends Analysis (2020-2032)
10.3.2 Large Enterprises Market Size Estimates and Forecasts to 2032 (USD Billion)
11. Regional Analysis
11.1 Chapter Overview
11.2 North America
11.2.1 Trends Analysis
11.2.2 North America Business Email Compromise Market Estimates and Forecasts, by Country (2020-2032) (USD Billion)
11.2.3 North America Business Email Compromise Market Estimates and Forecasts, By Offering (2020-2032) (USD Billion)
11.2.4 North America Business Email Compromise Market Estimates and Forecasts, By Deployment (2020-2032) (USD Billion)
11.2.5 North America Business Email Compromise Market Estimates and Forecasts, By Vertical (2020-2032) (USD Billion)
11.2.6 North America Business Email Compromise Market Estimates and Forecasts, By Organization Size (2020-2032) (USD Billion)
11.2.7 USA
11.2.7.1 USA Business Email Compromise Market Estimates and Forecasts, By Offering (2020-2032) (USD Billion)
11.2.7.2 USA Business Email Compromise Market Estimates and Forecasts, By Deployment (2020-2032) (USD Billion)
11.2.7.3 USA Business Email Compromise Market Estimates and Forecasts, By Vertical (2020-2032) (USD Billion)
11.2.7.4 USA Business Email Compromise Market Estimates and Forecasts, By Organization Size (2020-2032) (USD Billion)
11.2.8 Canada
11.2.8.1 Canada Business Email Compromise Market Estimates and Forecasts, By Offering (2020-2032) (USD Billion)
11.2.8.2 Canada Business Email Compromise Market Estimates and Forecasts, By Deployment (2020-2032) (USD Billion)
11.2.8.3 Canada Business Email Compromise Market Estimates and Forecasts, By Vertical (2020-2032) (USD Billion)
11.2.8.4 Canada Business Email Compromise Market Estimates and Forecasts, By Organization Size (2020-2032) (USD Billion)
11.2.9 Mexico
11.2.9.1 Mexico Business Email Compromise Market Estimates and Forecasts, By Offering (2020-2032) (USD Billion)
11.2.9.2 Mexico Business Email Compromise Market Estimates and Forecasts, By Deployment (2020-2032) (USD Billion)
11.2.9.3 Mexico Business Email Compromise Market Estimates and Forecasts, By Vertical (2020-2032) (USD Billion)
11.2.9.4 Mexico Business Email Compromise Market Estimates and Forecasts, By Organization Size (2020-2032) (USD Billion)
11.3 Europe
11.3.1 Eastern Europe
11.3.1.1 Trends Analysis
11.3.1.2 Eastern Europe Business Email Compromise Market Estimates and Forecasts, by Country (2020-2032) (USD Billion)
11.3.1.3 Eastern Europe Business Email Compromise Market Estimates and Forecasts, By Offering (2020-2032) (USD Billion)
11.3.1.4 Eastern Europe Business Email Compromise Market Estimates and Forecasts, By Deployment (2020-2032) (USD Billion)
11.3.1.5 Eastern Europe Business Email Compromise Market Estimates and Forecasts, By Vertical (2020-2032) (USD Billion)
11.3.1.6 Eastern Europe Business Email Compromise Market Estimates and Forecasts, By Organization Size (2020-2032) (USD Billion)
11.3.1.7 Poland
11.3.1.7.1 Poland Business Email Compromise Market Estimates and Forecasts, By Offering (2020-2032) (USD Billion)
11.3.1.7.2 Poland Business Email Compromise Market Estimates and Forecasts, By Deployment (2020-2032) (USD Billion)
11.3.1.7.3 Poland Business Email Compromise Market Estimates and Forecasts, By Vertical (2020-2032) (USD Billion)
11.3.1.7.4 Poland Business Email Compromise Market Estimates and Forecasts, By Organization Size (2020-2032) (USD Billion)
11.3.1.8 Romania
11.3.1.8.1 Romania Business Email Compromise Market Estimates and Forecasts, By Offering (2020-2032) (USD Billion)
11.3.1.8.2 Romania Business Email Compromise Market Estimates and Forecasts, By Deployment (2020-2032) (USD Billion)
11.3.1.8.3 Romania Business Email Compromise Market Estimates and Forecasts, By Vertical (2020-2032) (USD Billion)
11.3.1.8.4 Romania Business Email Compromise Market Estimates and Forecasts, By Organization Size (2020-2032) (USD Billion)
11.3.1.9 Hungary
11.3.1.9.1 Hungary Business Email Compromise Market Estimates and Forecasts, By Offering (2020-2032) (USD Billion)
11.3.1.9.2 Hungary Business Email Compromise Market Estimates and Forecasts, By Deployment (2020-2032) (USD Billion)
11.3.1.9.3 Hungary Business Email Compromise Market Estimates and Forecasts, By Vertical (2020-2032) (USD Billion)
11.3.1.9.4 Hungary Business Email Compromise Market Estimates and Forecasts, By Organization Size (2020-2032) (USD Billion)
11.3.1.10 Turkey
11.3.1.10.1 Turkey Business Email Compromise Market Estimates and Forecasts, By Offering (2020-2032) (USD Billion)
11.3.1.10.2 Turkey Business Email Compromise Market Estimates and Forecasts, By Deployment (2020-2032) (USD Billion)
11.3.1.10.3 Turkey Business Email Compromise Market Estimates and Forecasts, By Vertical (2020-2032) (USD Billion)
11.3.1.10.4 Turkey Business Email Compromise Market Estimates and Forecasts, By Organization Size (2020-2032) (USD Billion)
11.3.1.11 Rest of Eastern Europe
11.3.1.11.1 Rest of Eastern Europe Business Email Compromise Market Estimates and Forecasts, By Offering (2020-2032) (USD Billion)
11.3.1.11.2 Rest of Eastern Europe Business Email Compromise Market Estimates and Forecasts, By Deployment (2020-2032) (USD Billion)
11.3.1.11.3 Rest of Eastern Europe Business Email Compromise Market Estimates and Forecasts, By Vertical (2020-2032) (USD Billion)
11.3.1.11.4 Rest of Eastern Europe Business Email Compromise Market Estimates and Forecasts, By Organization Size (2020-2032) (USD Billion)
11.3.2 Western Europe
11.3.2.1 Trends Analysis
11.3.2.2 Western Europe Business Email Compromise Market Estimates and Forecasts, by Country (2020-2032) (USD Billion)
11.3.2.3 Western Europe Business Email Compromise Market Estimates and Forecasts, By Offering (2020-2032) (USD Billion)
11.3.2.4 Western Europe Business Email Compromise Market Estimates and Forecasts, By Deployment (2020-2032) (USD Billion)
11.3.2.5 Western Europe Business Email Compromise Market Estimates and Forecasts, By Vertical (2020-2032) (USD Billion)
11.3.2.6 Western Europe Business Email Compromise Market Estimates and Forecasts, By Organization Size (2020-2032) (USD Billion)
11.3.2.7 Germany
11.3.2.7.1 Germany Business Email Compromise Market Estimates and Forecasts, By Offering (2020-2032) (USD Billion)
11.3.2.7.2 Germany Business Email Compromise Market Estimates and Forecasts, By Deployment (2020-2032) (USD Billion)
11.3.2.7.3 Germany Business Email Compromise Market Estimates and Forecasts, By Vertical (2020-2032) (USD Billion)
11.3.2.7.4 Germany Business Email Compromise Market Estimates and Forecasts, By Organization Size (2020-2032) (USD Billion)
11.3.2.8 France
11.3.2.8.1 France Business Email Compromise Market Estimates and Forecasts, By Offering (2020-2032) (USD Billion)
11.3.2.8.2 France Business Email Compromise Market Estimates and Forecasts, By Deployment (2020-2032) (USD Billion)
11.3.2.8.3 France Business Email Compromise Market Estimates and Forecasts, By Vertical (2020-2032) (USD Billion)
11.3.2.8.4 France Business Email Compromise Market Estimates and Forecasts, By Organization Size (2020-2032) (USD Billion)
11.3.2.9 UK
11.3.2.9.1 UK Business Email Compromise Market Estimates and Forecasts, By Offering (2020-2032) (USD Billion)
11.3.2.9.2 UK Business Email Compromise Market Estimates and Forecasts, By Deployment (2020-2032) (USD Billion)
11.3.2.9.3 UK Business Email Compromise Market Estimates and Forecasts, By Vertical (2020-2032) (USD Billion)
11.3.2.9.4 UK Business Email Compromise Market Estimates and Forecasts, By Organization Size (2020-2032) (USD Billion)
11.3.2.10 Italy
11.3.2.10.1 Italy Business Email Compromise Market Estimates and Forecasts, By Offering (2020-2032) (USD Billion)
11.3.2.10.2 Italy Business Email Compromise Market Estimates and Forecasts, By Deployment (2020-2032) (USD Billion)
11.3.2.10.3 Italy Business Email Compromise Market Estimates and Forecasts, By Vertical (2020-2032) (USD Billion)
11.3.2.10.4 Italy Business Email Compromise Market Estimates and Forecasts, By Organization Size (2020-2032) (USD Billion)
11.3.2.11 Spain
11.3.2.11.1 Spain Business Email Compromise Market Estimates and Forecasts, By Offering (2020-2032) (USD Billion)
11.3.2.11.2 Spain Business Email Compromise Market Estimates and Forecasts, By Deployment (2020-2032) (USD Billion)
11.3.2.11.3 Spain Business Email Compromise Market Estimates and Forecasts, By Vertical (2020-2032) (USD Billion)
11.3.2.11.4 Spain Business Email Compromise Market Estimates and Forecasts, By Organization Size (2020-2032) (USD Billion)
11.3.2.12 Netherlands
11.3.2.12.1 Netherlands Business Email Compromise Market Estimates and Forecasts, By Offering (2020-2032) (USD Billion)
11.3.2.12.2 Netherlands Business Email Compromise Market Estimates and Forecasts, By Deployment (2020-2032) (USD Billion)
11.3.2.12.3 Netherlands Business Email Compromise Market Estimates and Forecasts, By Vertical (2020-2032) (USD Billion)
11.3.2.12.4 Netherlands Business Email Compromise Market Estimates and Forecasts, By Organization Size (2020-2032) (USD Billion)
11.3.2.13 Switzerland
11.3.2.13.1 Switzerland Business Email Compromise Market Estimates and Forecasts, By Offering (2020-2032) (USD Billion)
11.3.2.13.2 Switzerland Business Email Compromise Market Estimates and Forecasts, By Deployment (2020-2032) (USD Billion)
11.3.2.13.3 Switzerland Business Email Compromise Market Estimates and Forecasts, By Vertical (2020-2032) (USD Billion)
11.3.2.13.4 Switzerland Business Email Compromise Market Estimates and Forecasts, By Organization Size (2020-2032) (USD Billion)
11.3.2.14 Austria
11.3.2.14.1 Austria Business Email Compromise Market Estimates and Forecasts, By Offering (2020-2032) (USD Billion)
11.3.2.14.2 Austria Business Email Compromise Market Estimates and Forecasts, By Deployment (2020-2032) (USD Billion)
11.3.2.14.3 Austria Business Email Compromise Market Estimates and Forecasts, By Vertical (2020-2032) (USD Billion)
11.3.2.14.4 Austria Business Email Compromise Market Estimates and Forecasts, By Organization Size (2020-2032) (USD Billion)
11.3.2.15 Rest of Western Europe
11.3.2.15.1 Rest of Western Europe Business Email Compromise Market Estimates and Forecasts, By Offering (2020-2032) (USD Billion)
11.3.2.15.2 Rest of Western Europe Business Email Compromise Market Estimates and Forecasts, By Deployment (2020-2032) (USD Billion)
11.3.2.15.3 Rest of Western Europe Business Email Compromise Market Estimates and Forecasts, By Vertical (2020-2032) (USD Billion)
11.3.2.15.4 Rest of Western Europe Business Email Compromise Market Estimates and Forecasts, By Organization Size (2020-2032) (USD Billion)
11.4 Asia Pacific
11.4.1 Trends Analysis
11.4.2 Asia Pacific Business Email Compromise Market Estimates and Forecasts, by Country (2020-2032) (USD Billion)
11.4.3 Asia Pacific Business Email Compromise Market Estimates and Forecasts, By Offering (2020-2032) (USD Billion)
11.4.4 Asia Pacific Business Email Compromise Market Estimates and Forecasts, By Deployment (2020-2032) (USD Billion)
11.4.5 Asia Pacific Business Email Compromise Market Estimates and Forecasts, By Vertical (2020-2032) (USD Billion)
11.4.6 Asia Pacific Business Email Compromise Market Estimates and Forecasts, By Organization Size (2020-2032) (USD Billion)
11.4.7 China
11.4.7.1 China Business Email Compromise Market Estimates and Forecasts, By Offering (2020-2032) (USD Billion)
11.4.7.2 China Business Email Compromise Market Estimates and Forecasts, By Deployment (2020-2032) (USD Billion)
11.4.7.3 China Business Email Compromise Market Estimates and Forecasts, By Vertical (2020-2032) (USD Billion)
11.4.7.4 China Business Email Compromise Market Estimates and Forecasts, By Organization Size (2020-2032) (USD Billion)
11.4.8 India
11.4.8.1 India Business Email Compromise Market Estimates and Forecasts, By Offering (2020-2032) (USD Billion)
11.4.8.2 India Business Email Compromise Market Estimates and Forecasts, By Deployment (2020-2032) (USD Billion)
11.4.8.3 India Business Email Compromise Market Estimates and Forecasts, By Vertical (2020-2032) (USD Billion)
11.4.8.4 India Business Email Compromise Market Estimates and Forecasts, By Organization Size (2020-2032) (USD Billion)
11.4.9 Japan
11.4.9.1 Japan Business Email Compromise Market Estimates and Forecasts, By Offering (2020-2032) (USD Billion)
11.4.9.2 Japan Business Email Compromise Market Estimates and Forecasts, By Deployment (2020-2032) (USD Billion)
11.4.9.3 Japan Business Email Compromise Market Estimates and Forecasts, By Vertical (2020-2032) (USD Billion)
11.4.9.4 Japan Business Email Compromise Market Estimates and Forecasts, By Organization Size (2020-2032) (USD Billion)
11.4.10 South Korea
11.4.10.1 South Korea Business Email Compromise Market Estimates and Forecasts, By Offering (2020-2032) (USD Billion)
11.4.10.2 South Korea Business Email Compromise Market Estimates and Forecasts, By Deployment (2020-2032) (USD Billion)
11.4.10.3 South Korea Business Email Compromise Market Estimates and Forecasts, By Vertical (2020-2032) (USD Billion)
11.4.10.4 South Korea Business Email Compromise Market Estimates and Forecasts, By Organization Size (2020-2032) (USD Billion)
11.4.11 Vietnam
11.4.11.1 Vietnam Business Email Compromise Market Estimates and Forecasts, By Offering (2020-2032) (USD Billion)
11.4.11.2 Vietnam Business Email Compromise Market Estimates and Forecasts, By Deployment (2020-2032) (USD Billion)
11.4.11.3 Vietnam Business Email Compromise Market Estimates and Forecasts, By Vertical (2020-2032) (USD Billion)
11.4.11.4 Vietnam Business Email Compromise Market Estimates and Forecasts, By Organization Size (2020-2032) (USD Billion)
11.4.12 Singapore
11.4.12.1 Singapore Business Email Compromise Market Estimates and Forecasts, By Offering (2020-2032) (USD Billion)
11.4.12.2 Singapore Business Email Compromise Market Estimates and Forecasts, By Deployment (2020-2032) (USD Billion)
11.4.12.3 Singapore Business Email Compromise Market Estimates and Forecasts, By Vertical (2020-2032) (USD Billion)
11.4.12.4 Singapore Business Email Compromise Market Estimates and Forecasts, By Organization Size (2020-2032) (USD Billion)
11.4.13 Australia
11.4.13.1 Australia Business Email Compromise Market Estimates and Forecasts, By Offering (2020-2032) (USD Billion)
11.4.13.2 Australia Business Email Compromise Market Estimates and Forecasts, By Deployment (2020-2032) (USD Billion)
11.4.13.3 Australia Business Email Compromise Market Estimates and Forecasts, By Vertical (2020-2032) (USD Billion)
11.4.13.4 Australia Business Email Compromise Market Estimates and Forecasts, By Organization Size (2020-2032) (USD Billion)
11.4.14 Rest of Asia Pacific
11.4.14.1 Rest of Asia Pacific Business Email Compromise Market Estimates and Forecasts, By Offering (2020-2032) (USD Billion)
11.4.14.2 Rest of Asia Pacific Business Email Compromise Market Estimates and Forecasts, By Deployment (2020-2032) (USD Billion)
11.4.14.3 Rest of Asia Pacific Business Email Compromise Market Estimates and Forecasts, By Vertical (2020-2032) (USD Billion)
11.4.14.4 Rest of Asia Pacific Business Email Compromise Market Estimates and Forecasts, By Organization Size (2020-2032) (USD Billion)
11.5 Middle East and Africa
11.5.1 Middle East
11.5.1.1 Trends Analysis
11.5.1.2 Middle East Business Email Compromise Market Estimates and Forecasts, by Country (2020-2032) (USD Billion)
11.5.1.3 Middle East Business Email Compromise Market Estimates and Forecasts, By Offering (2020-2032) (USD Billion)
11.5.1.4 Middle East Business Email Compromise Market Estimates and Forecasts, By Deployment (2020-2032) (USD Billion)
11.5.1.5 Middle East Business Email Compromise Market Estimates and Forecasts, By Vertical (2020-2032) (USD Billion)
11.5.1.6 Middle East Business Email Compromise Market Estimates and Forecasts, By Organization Size (2020-2032) (USD Billion)
11.5.1.7 UAE
11.5.1.7.1 UAE Business Email Compromise Market Estimates and Forecasts, By Offering (2020-2032) (USD Billion)
11.5.1.7.2 UAE Business Email Compromise Market Estimates and Forecasts, By Deployment (2020-2032) (USD Billion)
11.5.1.7.3 UAE Business Email Compromise Market Estimates and Forecasts, By Vertical (2020-2032) (USD Billion)
11.5.1.7.4 UAE Business Email Compromise Market Estimates and Forecasts, By Organization Size (2020-2032) (USD Billion)
11.5.1.8 Egypt
11.5.1.8.1 Egypt Business Email Compromise Market Estimates and Forecasts, By Offering (2020-2032) (USD Billion)
11.5.1.8.2 Egypt Business Email Compromise Market Estimates and Forecasts, By Deployment (2020-2032) (USD Billion)
11.5.1.8.3 Egypt Business Email Compromise Market Estimates and Forecasts, By Vertical (2020-2032) (USD Billion)
11.5.1.8.4 Egypt Business Email Compromise Market Estimates and Forecasts, By Organization Size (2020-2032) (USD Billion)
11.5.1.9 Saudi Arabia
11.5.1.9.1 Saudi Arabia Business Email Compromise Market Estimates and Forecasts, By Offering (2020-2032) (USD Billion)
11.5.1.9.2 Saudi Arabia Business Email Compromise Market Estimates and Forecasts, By Deployment (2020-2032) (USD Billion)
11.5.1.9.3 Saudi Arabia Business Email Compromise Market Estimates and Forecasts, By Vertical (2020-2032) (USD Billion)
11.5.1.9.4 Saudi Arabia Business Email Compromise Market Estimates and Forecasts, By Organization Size (2020-2032) (USD Billion)
11.5.1.10 Qatar
11.5.1.10.1 Qatar Business Email Compromise Market Estimates and Forecasts, By Offering (2020-2032) (USD Billion)
11.5.1.10.2 Qatar Business Email Compromise Market Estimates and Forecasts, By Deployment (2020-2032) (USD Billion)
11.5.1.10.3 Qatar Business Email Compromise Market Estimates and Forecasts, By Vertical (2020-2032) (USD Billion)
11.5.1.10.4 Qatar Business Email Compromise Market Estimates and Forecasts, By Organization Size (2020-2032) (USD Billion)
11.5.1.11 Rest of Middle East
11.5.1.11.1 Rest of Middle East Business Email Compromise Market Estimates and Forecasts, By Offering (2020-2032) (USD Billion)
11.5.1.11.2 Rest of Middle East Business Email Compromise Market Estimates and Forecasts, By Deployment (2020-2032) (USD Billion)
11.5.1.11.3 Rest of Middle East Business Email Compromise Market Estimates and Forecasts, By Vertical (2020-2032) (USD Billion)
11.5.1.11.4 Rest of Middle East Business Email Compromise Market Estimates and Forecasts, By Organization Size (2020-2032) (USD Billion)
11.5.2 Africa
11.5.2.1 Trends Analysis
11.5.2.2 Africa Business Email Compromise Market Estimates and Forecasts, by Country (2020-2032) (USD Billion)
11.5.2.3 Africa Business Email Compromise Market Estimates and Forecasts, By Offering (2020-2032) (USD Billion)
11.5.2.4 Africa Business Email Compromise Market Estimates and Forecasts, By Deployment (2020-2032) (USD Billion)
11.5.2.5 Africa Business Email Compromise Market Estimates and Forecasts, By Vertical (2020-2032) (USD Billion)
11.5.2.6 Africa Business Email Compromise Market Estimates and Forecasts, By Organization Size (2020-2032) (USD Billion)
11.5.2.7 South Africa
11.5.2.7.1 South Africa Business Email Compromise Market Estimates and Forecasts, By Offering (2020-2032) (USD Billion)
11.5.2.7.2 South Africa Business Email Compromise Market Estimates and Forecasts, By Deployment (2020-2032) (USD Billion)
11.5.2.7.3 South Africa Business Email Compromise Market Estimates and Forecasts, By Vertical (2020-2032) (USD Billion)
11.5.2.7.4 South Africa Business Email Compromise Market Estimates and Forecasts, By Organization Size (2020-2032) (USD Billion)
11.5.2.8 Nigeria
11.5.2.8.1 Nigeria Business Email Compromise Market Estimates and Forecasts, By Offering (2020-2032) (USD Billion)
11.5.2.8.2 Nigeria Business Email Compromise Market Estimates and Forecasts, By Deployment (2020-2032) (USD Billion)
11.5.2.8.3 Nigeria Business Email Compromise Market Estimates and Forecasts, By Vertical (2020-2032) (USD Billion)
11.5.2.8.4 Nigeria Business Email Compromise Market Estimates and Forecasts, By Organization Size (2020-2032) (USD Billion)
11.5.2.9 Rest of Africa
11.5.2.9.1 Rest of Africa Business Email Compromise Market Estimates and Forecasts, By Offering (2020-2032) (USD Billion)
11.5.2.9.2 Rest of Africa Business Email Compromise Market Estimates and Forecasts, By Deployment (2020-2032) (USD Billion)
11.5.2.9.3 Rest of Africa Business Email Compromise Market Estimates and Forecasts, By Vertical (2020-2032) (USD Billion)
11.5.2.9.4 Rest of Africa Business Email Compromise Market Estimates and Forecasts, By Organization Size (2020-2032) (USD Billion)
11.6 Latin America
11.6.1 Trends Analysis
11.6.2 Latin America Business Email Compromise Market Estimates and Forecasts, by Country (2020-2032) (USD Billion)
11.6.3 Latin America Business Email Compromise Market Estimates and Forecasts, By Offering (2020-2032) (USD Billion)
11.6.4 Latin America Business Email Compromise Market Estimates and Forecasts, By Deployment (2020-2032) (USD Billion)
11.6.5 Latin America Business Email Compromise Market Estimates and Forecasts, By Vertical (2020-2032) (USD Billion)
11.6.6 Latin America Business Email Compromise Market Estimates and Forecasts, By Organization Size (2020-2032) (USD Billion)
11.6.7 Brazil
11.6.7.1 Brazil Business Email Compromise Market Estimates and Forecasts, By Offering (2020-2032) (USD Billion)
11.6.7.2 Brazil Business Email Compromise Market Estimates and Forecasts, By Deployment (2020-2032) (USD Billion)
11.6.7.3 Brazil Business Email Compromise Market Estimates and Forecasts, By Vertical (2020-2032) (USD Billion)
11.6.7.4 Brazil Business Email Compromise Market Estimates and Forecasts, By Organization Size (2020-2032) (USD Billion)
11.6.8 Argentina
11.6.8.1 Argentina Business Email Compromise Market Estimates and Forecasts, By Offering (2020-2032) (USD Billion)
11.6.8.2 Argentina Business Email Compromise Market Estimates and Forecasts, By Deployment (2020-2032) (USD Billion)
11.6.8.3 Argentina Business Email Compromise Market Estimates and Forecasts, By Vertical (2020-2032) (USD Billion)
11.6.8.4 Argentina Business Email Compromise Market Estimates and Forecasts, By Organization Size (2020-2032) (USD Billion)
11.6.9 Colombia
11.6.9.1 Colombia Business Email Compromise Market Estimates and Forecasts, By Offering (2020-2032) (USD Billion)
11.6.9.2 Colombia Business Email Compromise Market Estimates and Forecasts, By Deployment (2020-2032) (USD Billion)
11.6.9.3 Colombia Business Email Compromise Market Estimates and Forecasts, By Vertical (2020-2032) (USD Billion)
11.6.9.4 Colombia Business Email Compromise Market Estimates and Forecasts, By Organization Size (2020-2032) (USD Billion)
11.6.10 Rest of Latin America
11.6.10.1 Rest of Latin America Business Email Compromise Market Estimates and Forecasts, By Offering (2020-2032) (USD Billion)
11.6.10.2 Rest of Latin America Business Email Compromise Market Estimates and Forecasts, By Deployment (2020-2032) (USD Billion)
11.6.10.3 Rest of Latin America Business Email Compromise Market Estimates and Forecasts, By Vertical (2020-2032) (USD Billion)
11.6.10.4 Rest of Latin America Business Email Compromise Market Estimates and Forecasts, By Organization Size (2020-2032) (USD Billion)
12. Company Profiles
12.1 Acronis International GmbH
12.1.1 Company Overview
12.1.2 Financial
12.1.3 Products/ Services Offered
12.1.4 SWOT Analysis
12.2 Broadcom
12.2.1 Company Overview
12.2.2 Financial
12.2.3 Products/ Services Offered
12.2.4 SWOT Analysis
12.3 Cellopoint International Corp.
12.3.1 Company Overview
12.3.2 Financial
12.3.3 Products/ Services Offered
12.3.4 SWOT Analysis
12.4 Check Point Software Technologies Ltd.
12.4.1 Company Overview
12.4.2 Financial
12.4.3 Products/ Services Offered
12.4.4 SWOT Analysis
12.5 Fortra, LLC
12.5.1 Company Overview
12.5.2 Financial
12.5.3 Products/ Services Offered
12.5.4 SWOT Analysis
12.6 GreatHorn, Inc.
12.6.1 Company Overview
12.6.2 Financial
12.6.3 Products/ Services Offered
12.6.4 SWOT Analysis
12.7 Mimecast.com
12.7.1 Company Overview
12.7.2 Financial
12.7.3 Products/ Services Offered
12.7.4 SWOT Analysis
12.8 Proofpoint
12.8.1 Company Overview
12.8.2 Financial
12.8.3 Products/ Services Offered
12.8.4 SWOT Analysis
12.9 Tessian Limited
12.9.1 Company Overview
12.9.2 Financial
12.9.3 Products/ Services Offered
12.9.4 SWOT Analysis
12.10 Trend Micro Incorporated
12.10.1 Company Overview
12.10.2 Financial
12.10.3 Products/ Services Offered
12.10.4 SWOT Analysis
13. Use Cases and Best Practices
14. Conclusion
An accurate research report requires proper strategizing as well as implementation. There are multiple factors involved in the completion of good and accurate research report and selecting the best methodology to compete the research is the toughest part. Since the research reports we provide play a crucial role in any company’s decision-making process, therefore we at SNS Insider always believe that we should choose the best method which gives us results closer to reality. This allows us to reach at a stage wherein we can provide our clients best and accurate investment to output ratio.
Each report that we prepare takes a timeframe of 350-400 business hours for production. Starting from the selection of titles through a couple of in-depth brain storming session to the final QC process before uploading our titles on our website we dedicate around 350 working hours. The titles are selected based on their current market cap and the foreseen CAGR and growth.
The 5 steps process:
Step 1: Secondary Research:
Secondary Research or Desk Research is as the name suggests is a research process wherein, we collect data through the readily available information. In this process we use various paid and unpaid databases which our team has access to and gather data through the same. This includes examining of listed companies’ annual reports, Journals, SEC filling etc. Apart from this our team has access to various associations across the globe across different industries. Lastly, we have exchange relationships with various university as well as individual libraries.
Step 2: Primary Research
When we talk about primary research, it is a type of study in which the researchers collect relevant data samples directly, rather than relying on previously collected data. This type of research is focused on gaining content specific facts that can be sued to solve specific problems. Since the collected data is fresh and first hand therefore it makes the study more accurate and genuine.
We at SNS Insider have divided Primary Research into 2 parts.
Part 1 wherein we interview the KOLs of major players as well as the upcoming ones across various geographic regions. This allows us to have their view over the market scenario and acts as an important tool to come closer to the accurate market numbers. As many as 45 paid and unpaid primary interviews are taken from both the demand and supply side of the industry to make sure we land at an accurate judgement and analysis of the market.
This step involves the triangulation of data wherein our team analyses the interview transcripts, online survey responses and observation of on filed participants. The below mentioned chart should give a better understanding of the part 1 of the primary interview.
Part 2: In this part of primary research the data collected via secondary research and the part 1 of the primary research is validated with the interviews from individual consultants and subject matter experts.
Consultants are those set of people who have at least 12 years of experience and expertise within the industry whereas Subject Matter Experts are those with at least 15 years of experience behind their back within the same space. The data with the help of two main processes i.e., FGDs (Focused Group Discussions) and IDs (Individual Discussions). This gives us a 3rd party nonbiased primary view of the market scenario making it a more dependable one while collation of the data pointers.
Step 3: Data Bank Validation
Once all the information is collected via primary and secondary sources, we run that information for data validation. At our intelligence centre our research heads track a lot of information related to the market which includes the quarterly reports, the daily stock prices, and other relevant information. Our data bank server gets updated every fortnight and that is how the information which we collected using our primary and secondary information is revalidated in real time.
Step 4: QA/QC Process
After all the data collection and validation our team does a final level of quality check and quality assurance to get rid of any unwanted or undesired mistakes. This might include but not limited to getting rid of the any typos, duplication of numbers or missing of any important information. The people involved in this process include technical content writers, research heads and graphics people. Once this process is completed the title gets uploader on our platform for our clients to read it.
Step 5: Final QC/QA Process:
This is the last process and comes when the client has ordered the study. In this process a final QA/QC is done before the study is emailed to the client. Since we believe in giving our clients a good experience of our research studies, therefore, to make sure that we do not lack at our end in any way humanly possible we do a final round of quality check and then dispatch the study to the client.
Key Segments:
By Offering
Solution
Service
By Deployment
Cloud
On-premises
By Organization Size
SMEs
Large Enterprises
By Vertical
BFSI
Government
IT and Telecommunications
Energy and Utilities
Manufacturing
Retail and E-Commerce
Healthcare
Others
Request for Segment Customization as per your Business Requirement: Segment Customization Request
Regional Coverage:
North America
US
Canada
Mexico
Europe
Eastern Europe
Poland
Romania
Hungary
Turkey
Rest of Eastern Europe
Western Europe
Germany
France
UK
Italy
Spain
Netherlands
Switzerland
Austria
Rest of Western Europe
Asia Pacific
China
India
Japan
South Korea
Vietnam
Singapore
Australia
Rest of Asia Pacific
Middle East & Africa
Middle East
UAE
Egypt
Saudi Arabia
Qatar
Rest of the Middle East
Africa
Nigeria
South Africa
Rest of Africa
Latin America
Brazil
Argentina
Colombia
Rest of Latin America
Request for Country Level Research Report: Country Level Customization Request
Available Customization
With the given market data, SNS Insider offers customization as per the company’s specific needs. The following customization options are available for the report:
Product Analysis
Criss-Cross segment analysis (e.g. Product X Application)
Product Matrix which gives a detailed comparison of the product portfolio of each company
Geographic Analysis
Additional countries in any of the regions
Company Information
Detailed analysis and profiling of additional market players (Up to five)
AI In Asset Management Market was valued at USD 3.25 billion in 2023 and is expected to reach USD 23.01 billion by 2032, growing at a CAGR of 24.36% by 2032.
The Blockchain in Agriculture and Food Supply Chain Market Size was valued at USD 299.1 Million in 2023 and is expected to reach USD 7035.7 Million by 2032, growing at a CAGR of 42.1% over the forecast period 2024-2032.
The India Capability Centers Market will reach USD 149.31 bn by 2032 and was valued at USD 38.03 bn in 2023. The estimated CAGR is 14.61% for 2024-2032.
The Streaming Analytics Market size was valued at USD 22.97 Billion in 2023 and is expected to reach USD 231.35 Billion by 2032, and grow at a CAGR of 29.26 % over the forecast period 2024-2032.
Smart Helmet Market was valued at USD 742.65 million in 2023 and is expected to reach USD 3049.63 million by 2032, growing at a CAGR of 17.06% from 2024-2032.
The AI Training Dataset Market, valued at USD 2.23 billion in 2023 is expected to reach USD 14.67 billion by 2032, growing at a CAGR of 23.28% over 2024-2032.
Hi! Click one of our member below to chat on Phone