Burn Ointment Market Overview:
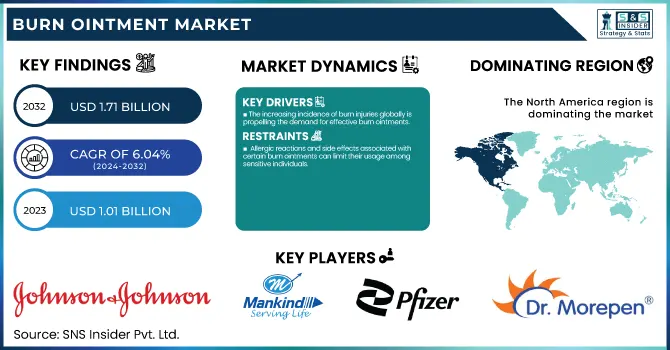
The Burn Ointment Market Size was valued at USD 1.01 Billion in 2023 and is expected to reach USD 1.71 billion by 2032, growing at a CAGR of 6.04% over the forecast period 2024-2032.
To Get more information on Burn Ointment Market - Request Free Sample Report
This report offers useful insights into statistics and trends of the Burn Ointment Market, covering all the important aspects. This includes an evaluation of burn incidence, prevalence by severity and region. The report examines prescription trends by region, noting differences in hospital and OTC sales. It also analyzes drug volume when it comes to production and usage for market demand purposes. It also offers a breakdown of health care spending on burn treatments, by government, insurers, and out-of-pocket. Finally, it examines regional thematic regulatory permissions and compliance trends in end-user markets that are driving market growth and innovation. Furthermore, rising burn cases, along with improved awareness regarding burn treatment are some of the factors strengthening the growth of the burn ointment market. In the U.S., around 486,000 people have fire-related injuries each year, underscoring the importance of burn treatments. In recent years, the U.S. dominated the global market, accounting for 78% market share of North America, and held a USD 325 million revenue share in 2023 driven due to the country features advanced healthcare infrastructure and high cognizance of burn safety.
Burn Ointment Market Dynamics
Driver
-
The increasing incidence of burn injuries globally is propelling the demand for effective burn ointments.
The growing number of burn injuries worldwide is a major factor contributing to the growth of the burn ointment market. An estimated 8,378,122 burn injuries occurred worldwide in 2019, corresponding to an age-standardized incidence rate of 118 per 100,000 people. More than two million people in the United States seek medical treatment for thermal burns each year, with about 75,000 of those cases requiring hospitalization and a third of those hospital stays lasting more than two months. In India, the annual incidence of burns varies from 700,000 to 800,000 cases with the majority of victims being women aged 16–35 years. More widespread loose-fitting clothing and unsafe kitchen environments have been contributing factors to accidental fires. Notably, about one-third of all burns in India result from clothing catching fire from open flames. The WHO African Region has the highest global rate for childhood burn deaths and the burn rates in the Western Pacific Region are 20 times higher than in the Americas. These statistics highlight the importance of developing effective burn care products/ointments for managing burn injuries in a variety of populations.
Moreover, the number of wildfire occurrences has increased as a result of global warming, intensifying burn-related health risks. A recent study found that climate change expanded the number of acres prone to wildfire risk by nearly 16%, resulting in greater exposure to toxic smoke particles and potential health issues. But a burn is among the wounds with a considerable number of cases worldwide demand and it needs suitable burn ointments for wound care, preventing infection, and promoting healing. As burn injuries remain prevalent across various demographics and regions, the demand for advanced burn care products continues to drive the market forward.
Restraint:
-
Allergic reactions and side effects associated with certain burn ointments can limit their usage among sensitive individuals.
Allergic reactions and adverse effects of burn ointments are serious challenges in the management of burn care. The medical complications associated with this range from simple skin contact reactions to debilitating dermatitis that may impede the service and healing process itself, leading to even more complicated medical scenarios. A study conducted in Northern India highlighted that 88% of cosmetic dermatitis cases occurred in females aged 20 to 49. While this study focused on cosmetics, it underscores the broader issue of topical product-induced dermatitis, which is pertinent to burn ointments as well. There are a lot of such reactions that require doctors and patients to take caution in choosing their burn ointments. Allergies and irritations to common agents must be avoided so that they do not aggravate the patient's condition. In addition, hypoallergenic formulations must be developed to meet the needs of sensitive individuals and minimize the occurrence of adverse reactions. Emphasizing patient safety and incompatibility of products will ensure that burn ointments address the varied needs of burn victims while limiting any deterioration due to possible allergic reactions.
Opportunity:
-
Advancements in burn ointment technology, such as the development of smart delivery systems, are enhancing treatment efficacy and expanding market potential.
These innovations in burn ointment technology offer a tremendous opportunity to help improve patient outcomes and conquer the worldwide burden of burn injuries. For example, these treatment tools could be composed of nanoparticles, such as silver and zinc oxide, and intracutaneous nanotechnology-enhanced dressings, which offer antimicrobial quality and wound healing. For example, hydrogel dressings imbued with silver nanoparticles have been found to speed up re-epithelialization whilst limiting scar formation. With over 1 million people in India facing moderate to severe burns every year, an effective way to treat them was the need of the hour. In Mumbai alone, burn injuries claimed over 700 lives over three years, outpacing deaths from diseases such as malaria or dengue.
Biological dressings and skin substitutes represent another advancement, utilizing materials such as amniotic membrane grafts that contain growth factors and extracellular matrix components to enhance wound healing and reduce scarring. Furthermore, sensor-enabled smart dressings are capable of monitoring wound healing by determining pH levels, temperature, and bacterial load allowing clinicians to assess wound healing and, subsequently, make accessible decisions regarding intervention and treatment as needed. These and other advances in burn ointments or related technology can potentially replete the standard of care, reduce mortality, and ultimately function to improve the quality of life for those who have experienced burns.
Challenge:
-
Maintaining sterility during ointment application poses significant challenges in both clinical and home settings.
Maintaining sterility during burn ointment application is crucial to prevent infections, yet it presents significant challenges in both clinical and home settings. Burn injuries are extremely prone to infections cause by the loss of the skin protective barrier. The infection rates are alarmingly high in burn patients, for example, one study found that 38.54% of the burn patients had wound-related infections. Even in clinical settings where strict infection control measures are employed, the probability of nosocomial infections is high. This risk is due to causes such as invasive procedures, longer hospital stays, and multidrug-resistant organisms. Research indicates that Pseudomonas infections were present in 57% of burn wound cases in certain units, highlighting the prevalence of such infections. The passage of microorganisms through the skin and mucosal linings of the body can lead to unimaginable injury, and in the home care environment, a sterile space is far more difficult to manage, as access to medical-grade configurations and education are often restricted. Patients and caregivers might not have adequate education and equipment to perform sterile ointment application, leading to the possibility of contamination. It is especially worrying since around 95% of burns happen in low- to middle-income countries that lack the resources and healthcare systems.
Burn Ointment Market Segmentation Analysis
By Product
The topical antibiotics segment dominated the market with a revenue share of 33% in 2023. This dominance can be attributed to the high acceptance of topical antibiotic ointments like Neosporin and Polysporin in home-care settings. Government statistics indicate that burns are a common injury, with over 300 children treated daily in U.S. emergency departments, emphasizing the need for effective infection prevention measures that topical antibiotics provide. The U.S. FDA's approval of various antibiotic ointments for burn care further supports this segment's growth. As the incidence of burns increases globally, the demand for topical antibiotics is expected to rise. These ointments are crucial in preventing infections, which are a significant concern in burn injuries. The effectiveness of topical antibiotics in managing minor to moderate burns has made them a preferred choice among consumers, contributing to their market dominance.
The growth of the topical antibiotics segment is also influenced by advancements in wound care technology. Innovations such as hydrogel-based dressings and bioactive compounds have enhanced the healing process, but topical antibiotics remain essential for infection control. This balance between new technologies and traditional treatments ensures that topical antibiotics continue to hold a significant market share.
By Depth of Burn
In 2023, the minor burns segment accounted for the largest revenue share in the market. The most common type of burn injury is a minor burn affecting just the outermost layer of skin. There are nearly 1.2 million cases of blaze wounds in the United States each year, according to the National Center for Injury Prevention and Control; many of these wounds are insignificant blazes. The significant prevalence of mild burns, as well as the availability of over-the-counter burn ointments, drives this segment. Moreover, with the implementation of government initiatives for burn prevention and treatment, the growth of this segment is also strengthened. Minor burns are often treated at home, which increases the demand for easily accessible burn ointments. This growing acceptance paired with the utility of these ointments for managing small, minor burns without extensive medical visits has made these ointments a preferred consumer choice. Moreover, increasing awareness for burn care and the significance of immediate management of minor burns have further boosted the demand for burn ointments catering to minor burns. The preschool segment of burns minor burns is facilitated by the easy accessibility of burn ointments in retail pharmacies and online channels. This easy accessibility allows consumers to get minor burns treated quickly enough to minimize complications and support healing. The combination of accessibility and effectiveness has solidified the minor burns segment as a leading market segment.
By End-use
In 2023, the hospital segment accounted for the highest revenue share in the market. Hospitals are the first places where the most serious burns are treated, and they require special doorways and facilities. Government statistics show that roughly 40,000 patients are admitted to U.S. hospitals each year for partial burns, underscoring the important role of hospitals in burn treatment. The dominance of this segment is supported by the availability of advanced burn treatment options and specialized burn units in hospitals. The growing prevalence of such burns results in high hospitalization rates, which translates into a high market share for the hospital-based segment. Burns are treated in a surgical setting. Burn ointments in hospitals are very important to prevent infection and healing of severe burns. Ointments that apply to burns are used in hospitals where they are specifically trained to use that segment care to further the patient outcome. Technological advancements in burn treatment also matriculate the growth of the hospital segment. Bioengineered skin grafts and advanced wound dressings are examples of innovations that have significantly improved burn care outcomes. However, burn ointments are still indispensable for infection control and wound healing, and still have a critical place in the hospital setting.
Burn Ointment Market Regional Insights
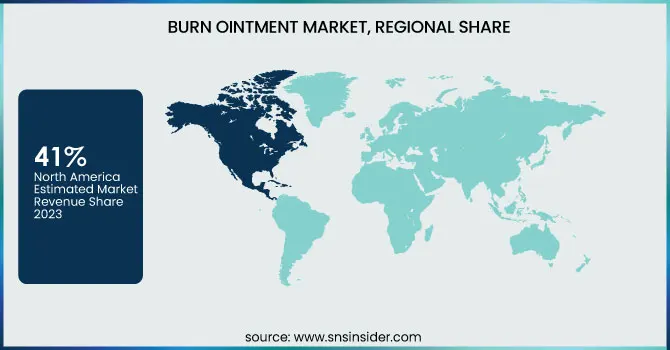
In 2023, North America was the leading region with a 41% revenue share of the burn ointment market, due to the large healthcare infrastructure that is already established, as well as the popularization of burn safety. The U.S. was a major country in this market, propelled by strong competition centered around product innovation and strategic partnerships. The flow of North America can be ascribed to the advancement of medical facilities and the presence of the key market players. Strengthening market growth is the region's focus on treatment, prevention, and management of burns, with campaigns such as the American Burn Association's awareness drive. The Asia-Pacific region is expected to record the highest CAGR, owing to growing healthcare awareness and government initiatives supporting this trend. Another factor for the growth of this region is the presence of several underserved opportunities along with increasing incidences of burnout, particularly in countries like China and India. In contrast, the Asia-Pacific region's rapid growth is fueled by improving healthcare infrastructure and increasing demand for burn care products, making it a promising market for future expansion.
Get Customized Report as per Your Business Requirement - Enquiry Now
Key Players in the Burn Ointment Market
-
Mankind Pharma
-
Pfizer Inc.
-
Dr. Morepen
-
Smith & Nephew PLC
-
ConvaTec Group PLC
-
GlaxoSmithKline PLC (GSK)
-
Sun Pharmaceutical Industries Ltd.
-
Perrigo Company PLC
-
3M
-
Cardinal Health
-
Integra LifeSciences Corporation
-
Anika Therapeutics
-
B. Braun Melsungen AG
-
Kinetic Concepts, Inc.
-
Wisconsin Pharmacal Company
-
Julphar
-
Beiersdorf AG
-
The Mentholatum Company, Inc.
Recent Developments
-
In 2024, Bharat Serums and Vaccines entered an exclusive agreement with MediWound to introduce NexoBrid into India, expanding access to advanced burn treatment.
-
In 2023, ConvaTec entered the wound treatment market after acquiring Acelity to bolster its advanced wound care portfolio backed up with burn ointments.
| Report Attributes | Details |
|---|---|
| Market Size in 2023 | USD 1.01 Billion |
| Market Size by 2032 | USD 1.74 Billion |
| CAGR | CAGR of 6.04% From 2024 to 2032 |
| Base Year | 2023 |
| Forecast Period | 2024-2032 |
| Historical Data | 2020-2022 |
| Report Scope & Coverage | Market Size, Segments Analysis, Competitive Landscape, Regional Analysis, DROC & SWOT Analysis, Forecast Outlook |
| Key Segments | • By Depth Of Burn (Minor Burns, Partial Thickness Burns, Full Thickness Burns) • By Product (Topical Antibiotics, Iodine, Silver, Others) • By End-use (Hospitals, Clinics, Others) |
| Regional Analysis/Coverage | North America (US, Canada, Mexico), Europe (Eastern Europe [Poland, Romania, Hungary, Turkey, Rest of Eastern Europe] Western Europe] Germany, France, UK, Italy, Spain, Netherlands, Switzerland, Austria, Rest of Western Europe]), Asia Pacific (China, India, Japan, South Korea, Vietnam, Singapore, Australia, Rest of Asia Pacific), Middle East & Africa (Middle East [UAE, Egypt, Saudi Arabia, Qatar, Rest of Middle East], Africa [Nigeria, South Africa, Rest of Africa], Latin America (Brazil, Argentina, Colombia, Rest of Latin America) |
| Company Profiles | Johnson & Johnson, Mankind Pharma, Pfizer Inc., Dr. Morepen, Smith & Nephew PLC, ConvaTec Group PLC, GlaxoSmithKline PLC (GSK), Cipla Limited, Sun Pharmaceutical Industries Ltd., Perrigo Company PLC, 3M, Cardinal Health, Integra LifeSciences Corporation, Anika Therapeutics, B. Braun Melsungen AG, Kinetic Concepts, Inc., Wisconsin Pharmacal Company, Julphar, Beiersdorf AG, The Mentholatum Company, Inc. |
