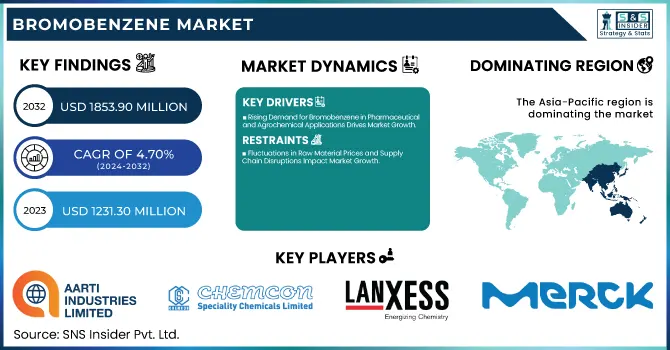
The Bromobenzene Market Size was valued at USD 1,231.30 Million in 2023 and is expected to reach USD 1,853.90 Million by 2032, growing at a CAGR of 4.70% over the forecast period of 2024-2032.
To Get more information on Bromobenzene Market - Request Free Sample Report
The Bromobenzene Market is expanding due to its rising demand in pharmaceuticals, agrochemicals, and chemical synthesis. Our report provides an in-depth cost structure analysis, detailing raw material, production, and logistics expenses to assess profitability. A raw material analysis explores sourcing trends and price fluctuations of benzene and bromine. Key regulatory and compliance requirements shaping the industry, including environmental and safety standards, are thoroughly examined. The report highlights investment and funding trends, showcasing mergers, acquisitions, and capital flows driving market expansion. Additionally, end-user consumption trends are analyzed to understand demand patterns across industries. This comprehensive assessment delivers valuable insights, enabling businesses to navigate challenges and capitalize on emerging opportunities in the evolving bromobenzene market.
Drivers
Rising Demand for Bromobenzene in Pharmaceutical and Agrochemical Applications Drives Market Growth
The increasing use of bromobenzene in pharmaceutical synthesis and agrochemical formulations is a significant driver of market expansion. In the pharmaceutical industry, bromobenzene serves as a key intermediate in drug synthesis, particularly in the production of analgesics, antiseptics, and other medicinal compounds. With the rising prevalence of chronic diseases and the growing demand for advanced pharmaceuticals, the need for high-quality bromobenzene continues to grow. Additionally, bromobenzene plays a crucial role in agrochemicals, particularly in the synthesis of pesticides and herbicides. As global agricultural output rises to meet the demands of a growing population, the need for effective crop protection chemicals increases. Stringent regulations promoting sustainable farming practices further drive innovation in agrochemical formulations, increasing the adoption of bromobenzene-based compounds. The expansion of these end-use industries, coupled with continuous research and development efforts, contributes to the long-term growth of the bromobenzene market.
Restraints
Fluctuations in Raw Material Prices and Supply Chain Disruptions Impact Market Growth
The volatility in raw material prices, particularly benzene and bromine, significantly affects the bromobenzene market by increasing production costs. Price fluctuations are influenced by factors such as crude oil variations, geopolitical tensions, and supply chain disruptions. Additionally, transportation constraints and trade restrictions further exacerbate supply chain challenges, leading to production delays and inconsistent availability of bromobenzene. Manufacturers often face difficulties in securing stable raw material supplies, impacting profit margins and overall market stability. The dependency on specific geographic regions for raw material sourcing also makes the market vulnerable to geopolitical risks and regulatory changes. These uncertainties create financial and operational challenges for industry players, affecting the long-term growth of the bromobenzene market.
Opportunities
Growing Demand for High-Purity Bromobenzene in Emerging Applications Creates Market Opportunities
The increasing demand for high-purity bromobenzene in specialized applications such as electronics, biotechnology, and advanced material synthesis presents significant growth opportunities. High-purity bromobenzene is crucial for precision chemical reactions, where contamination must be minimized. In the electronics industry, it is used in the development of semiconductor materials and specialty coatings. Additionally, the expanding field of biotechnology relies on high-purity brominated compounds for drug synthesis and diagnostic applications. As research institutions and industries invest in high-performance materials, the need for ultra-pure bromobenzene continues to rise. Companies focusing on advanced purification techniques and high-grade production processes can tap into this lucrative segment, driving market expansion.
Challenge
Increasing Competition from Alternative Chemical Intermediates Poses Market Challenges
The bromobenzene market is facing increasing competition from alternative chemical intermediates that offer similar functionalities with reduced environmental impact. Substitutes such as chlorinated and fluorinated compounds are being developed to replace bromobenzene in various applications. Additionally, industries are exploring greener alternatives that provide comparable performance while ensuring regulatory compliance. This growing preference for substitutes is creating challenges for bromobenzene manufacturers, compelling them to innovate and differentiate their products. Companies must focus on enhancing product efficiency, sustainability, and cost-effectiveness to maintain their market position.
By Grade
Pharmaceutical Grade dominated the bromobenzene market in 2023, holding a market share of 40.2%. The dominance of pharmaceutical-grade bromobenzene is primarily driven by its extensive use as a key intermediate in drug synthesis, particularly in the production of analgesics, antiseptics, and other medicinal compounds. The rising demand for high-purity raw materials in pharmaceutical formulations has further strengthened its position. According to the U.S. Food and Drug Administration (FDA), regulatory approvals for bromobenzene-based drug intermediates have increased, reflecting its critical role in modern medicine. Additionally, the European Medicines Agency (EMA) has emphasized stringent purity standards, encouraging manufacturers to invest in pharmaceutical-grade bromobenzene. The expansion of the global pharmaceutical sector, driven by increased healthcare spending and government-backed R&D initiatives, has further bolstered demand for this segment.
By Derivatives
Phenylmagnesium Bromide dominated the bromobenzene market in 2023, capturing 38.7% of the market share. This compound is widely used in Grignard reactions, making it essential for organic synthesis in pharmaceutical, chemical, and agrochemical industries. The dominance of this derivative is supported by its growing applications in drug development, particularly in the synthesis of active pharmaceutical ingredients (APIs). The U.S. National Institutes of Health (NIH) and pharmaceutical giants like Pfizer and Merck have increasingly relied on phenylmagnesium bromide for innovative drug formulations. Additionally, its role in specialty chemical manufacturing has grown, driven by advancements in material sciences and polymer research. The demand for high-efficiency reagents in laboratory and industrial applications has further solidified the segment’s leadership in the market.
By Purity
Bromobenzene with ≥99% purity dominated the bromobenzene market in 2023, accounting for 52.4% of the market share. The preference for high-purity bromobenzene is fueled by its critical role in pharmaceutical, electronic, and specialty chemical industries, where impurities can affect the quality and performance of final products. Regulatory bodies such as the U.S. Environmental Protection Agency (EPA) and the European Chemicals Agency (ECHA) have enforced stringent purity standards, further driving demand for high-grade bromobenzene. Major pharmaceutical companies, including GlaxoSmithKline and Novartis, have prioritized ≥99% purity bromobenzene in their synthesis processes, ensuring compliance with international quality standards. Additionally, its application in high-precision laboratory experiments and semiconductor manufacturing has strengthened its market position.
By Application
The Solvent segment dominated the bromobenzene market in 2023, securing 34.2% of the market share. Bromobenzene is widely used as a solvent in organic synthesis, facilitating chemical reactions in pharmaceutical, agrochemical, and industrial processes. Its superior solubility properties and ability to act as a reaction medium make it indispensable in large-scale production facilities. The American Chemical Society (ACS) has highlighted its role in enhancing reaction efficiency in drug formulation and specialty chemical synthesis. Furthermore, increased research in green chemistry has led to innovations in solvent recovery and recycling, making bromobenzene a cost-effective and sustainable option for manufacturers. The expansion of pharmaceutical and agrochemical industries has further reinforced the solvent segment’s dominance.
By End-Use Industry
The Pharmaceuticals segment dominated the bromobenzene market in 2023, commanding 43.5% of the market share. The growing pharmaceutical industry, driven by rising global healthcare needs and increased investment in drug development, has significantly boosted demand for bromobenzene. It serves as a crucial intermediate in producing essential drugs, including pain relievers and antiseptics. The World Health Organization (WHO) has reported increased demand for pharmaceutical raw materials, reflecting the segment's expansion. Additionally, government initiatives, such as the U.S. Biomedical Advanced Research and Development Authority (BARDA) funding for novel drug development, have further propelled market growth. The pharmaceutical sector's continued emphasis on high-quality raw materials and stringent regulatory compliance has solidified bromobenzene’s position in this segment.
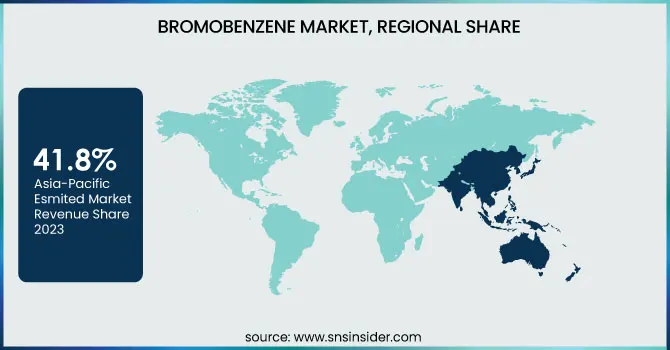
Asia Pacific dominated the bromobenzene market in 2023, holding a market share of 41.8%, driven by its strong industrial base, expanding pharmaceutical sector, and growing chemical manufacturing capabilities. Countries such as China, India, and Japan have been at the forefront of bromobenzene production and consumption due to their extensive pharmaceutical, agrochemical, and specialty chemical industries. China, the largest producer and consumer, benefits from well-established chemical manufacturing hubs such as Jiangsu and Shandong provinces, contributing to over 60% of the region’s bromobenzene output. According to the China Petroleum and Chemical Industry Federation (CPCIF), China’s chemical industry grew by 8.5% in 2023, further bolstering demand. India follows closely, with the Indian Pharmaceutical Alliance (IPA) reporting an 11% annual increase in pharmaceutical manufacturing, relying heavily on bromobenzene intermediates. Additionally, Japan's advanced R&D in organic synthesis and specialty chemicals, supported by investments from companies like Sumitomo Chemical and Mitsubishi Chemical, has further strengthened the region’s dominance.
Moreover, North America emerged as the fastest-growing region with a significant growth rate in the bromobenzene market during the forecast period. The growth is primarily driven by the rapid expansion of the pharmaceutical and agrochemical sectors, along with increased investment in specialty chemicals. The U.S. dominates the region, accounting for more than 75% of North America's bromobenzene consumption, driven by the presence of leading pharmaceutical companies such as Pfizer, Merck, and Johnson & Johnson, which extensively use bromobenzene-based intermediates in drug development. The U.S. Food and Drug Administration (FDA) has also increased approvals for bromobenzene-based drug intermediates, accelerating market demand. Canada is emerging as a key player, supported by its growing agrochemical sector, with Statistics Canada reporting a 7.2% rise in pesticide production in 2023. Mexico's chemical industry expansion, driven by trade agreements such as the USMCA, further propels regional growth, with a 5.4% increase in specialty chemical production reported by the National Institute of Statistics and Geography (INEGI).
Get Customized Report as per Your Business Requirement - Enquiry Now
Aarti Industries (Bromobenzene, Phenylmagnesium Bromide)
Chemcon Speciality Chemicals Limited (Bromobenzene, 1-Bromo-3-Chlorobenzene)
Dachang Jinxiu Wanbao New Technology Chemical Co., Ltd. (Bromobenzene, 4-Bromotoluene)
Haihang Industry Co., Ltd. (Bromobenzene, 4-Bromoanisole)
Hebei Chaozhong Chemical (Bromobenzene, 2-Bromotoluene)
Heranba Industries Ltd. (Bromobenzene, Phenylmagnesium Bromide)
Jiangsu Dacheng Pharmaceutical and Chemical Co., Ltd. (Bromobenzene, 2-Bromophenol)
Lanxess (Bromobenzene, 4-Bromoacetophenone)
Merck KGaA (Bromobenzene, 4-Bromoanisole)
Pragna Group (Bromobenzene, 4-Bromobiphenyl)
Shandong Henglian Chemical Co., Ltd. (Bromobenzene, 4-Bromophenol)
Shanghai Wescco Chemical Co., Ltd. (Bromobenzene, 4-Bromotoluene)
Shouguang Fukang Pharmaceutical Co., Ltd. (Bromobenzene, 3-Bromoanisole)
Shouguang Wuli Chemical Co., Ltd. (Bromobenzene, 1-Bromo-2-Chlorobenzene)
SONTARA ORGANO INDUSTRIES (Bromobenzene, 2-Bromonaphthalene)
Toyo Chemical Industrial (Bromobenzene, 4-Bromobenzyl Alcohol)
Weifang Yonhop Chemical Co., Ltd. (Bromobenzene, 4-Bromophenylacetic Acid)
Yancheng Longsheng Chemical Co., Ltd. (Bromobenzene, 2-Bromophenylboronic Acid)
Yogi Intermediates PVT. LTD. (Bromobenzene, 4-Bromo-2-Chlorotoluene)
Yurui (Shanghai) Chemical Co., Ltd. (Bromobenzene, 3-Bromo-1-Phenylpropane)
Report Attributes | Details |
---|---|
Market Size in 2023 | USD 1,231.30 Million |
Market Size by 2032 | 1,853.90 Million |
CAGR | CAGR of 4.70% From 2024 to 2032 |
Base Year | 2023 |
Forecast Period | 2024-2032 |
Historical Data | 2020-2022 |
Report Scope & Coverage | Market Size, Segments Analysis, Competitive Landscape, Regional Analysis, DROC & SWOT Analysis, Forecast Outlook |
Key Segments | •By Grade (Pharmaceutical Grade, Industrial Grade, Reagent Grade) •By Derivatives (Phenylmagnesium Bromide, Diphenyl Ether, Phencyclidine Precursors, Others) •By Purity (<99%, ≥99%) •By Application (Solvent, Chemical Intermediate, Grignard Reagent, Catalyst & Reagent in Organic Synthesis, Others) •By End-Use Industry (Pharmaceuticals, Agrochemicals, Chemicals, Others) |
Regional Analysis/Coverage | North America (US, Canada, Mexico), Europe (Eastern Europe [Poland, Romania, Hungary, Turkey, Rest of Eastern Europe] Western Europe] Germany, France, UK, Italy, Spain, Netherlands, Switzerland, Austria, Rest of Western Europe]), Asia Pacific (China, India, Japan, South Korea, Vietnam, Singapore, Australia, Rest of Asia Pacific), Middle East & Africa (Middle East [UAE, Egypt, Saudi Arabia, Qatar, Rest of Middle East], Africa [Nigeria, South Africa, Rest of Africa], Latin America (Brazil, Argentina, Colombia, Rest of Latin America) |
Company Profiles | Chemcon Speciality Chemicals Limited, Aarti Industries, Lanxess, Merck KGaA, Shandong Henglian Chemical Co. Ltd, Heranba Industries Ltd., Weifang Yonhop Chemical Co., Ltd., Yancheng Longshen Chemical Co., Ltd., Jiangsu Dacheng Pharmaceutical and Chemical Co., Ltd., Haihang Industry Co., Ltd.and other key players |
Ans: The Bromobenzene Market is expected to grow at a CAGR of 4.70% from 2024 to 2032.
Ans: The Bromobenzene Market is driven by rising demand in pharmaceuticals, agrochemicals, and chemical synthesis.
Ans: The Pharmaceuticals segment dominates the Bromobenzene Market with a 43.5% share.
Ans: Phenylmagnesium Bromide leads the Bromobenzene Market with a 38.7% share.
Ans: Aarti Industries, Lanxess, Merck KGaA, and Chemcon Speciality Chemicals are key players in the Bromobenzene Market.
Table of Contents:
1. Introduction
1.1 Market Definition
1.2 Scope (Inclusion and Exclusions)
1.3 Research Assumptions
2. Executive Summary
2.1 Market Overview
2.2 Regional Synopsis
2.3 Competitive Summary
3. Research Methodology
3.1 Top-Down Approach
3.2 Bottom-up Approach
3.3. Data Validation
3.4 Primary Interviews
4. Market Dynamics Impact Analysis
4.1 Market Driving Factors Analysis
4.1.1 Drivers
4.1.2 Restraints
4.2 PESTLE Analysis
4.3 Porter’s Five Forces Model
5. Statistical Insights and Trends Reporting
5.1 Cost Structure Analysis
5.2 Raw Material Analysis
5.3 Key Regulatory and Compliance Requirements
5.4 Investment and Funding Trends
5.5 End-User Consumption Trends
6. Competitive Landscape
6.1 List of Major Companies, By Region
6.2 Market Share Analysis, By Region
6.3 Product Benchmarking
6.3.1 Product specifications and features
6.3.2 Pricing
6.4 Strategic Initiatives
6.4.1 Marketing and promotional activities
6.4.2 Distribution and supply chain strategies
6.4.3 Expansion plans and new product launches
6.4.4 Strategic partnerships and collaborations
6.5 Technological Advancements
6.6 Market Positioning and Branding
7. Bromobenzene Market Segmentation, By Grade
7.1 Chapter Overview
7.2 Pharmaceutical Grade
7.2.1 Pharmaceutical Grade Market Trends Analysis (2020-2032)
7.2.2 Pharmaceutical Grade Market Size Estimates and Forecasts to 2032 (USD Billion)
7.3 Industrial Grade
7.3.1 Industrial Grade Market Trends Analysis (2020-2032)
7.3.2 Industrial Grade Market Size Estimates and Forecasts to 2032 (USD Billion)
7.4 Reagent Grade
7.4.1 Reagent Grade Market Trends Analysis (2020-2032)
7.4.2 Reagent Grade Market Size Estimates and Forecasts to 2032 (USD Billion)
8. Bromobenzene Market Segmentation, By Derivatives
8.1 Chapter Overview
8.2 Phenylmagnesium Bromide
8.2.1 Phenylmagnesium Bromide Market Trends Analysis (2020-2032)
8.2.2 Phenylmagnesium Bromide Market Size Estimates And Forecasts To 2032 (USD Billion)
8.3 Diphenyl Ether
8.3.1 Diphenyl Ether Market Trends Analysis (2020-2032)
8.3.2 Diphenyl Ether Market Size Estimates And Forecasts To 2032 (USD Billion)
8.4 Phencyclidine Precursors
8.4.1 Phencyclidine Precursors Market Trends Analysis (2020-2032)
8.4.2 Phencyclidine Precursors Market Size Estimates And Forecasts To 2032 (USD Billion)
8.5 Others
8.5.1 Others Market Trends Analysis (2020-2032)
8.5.2 Others Market Size Estimates And Forecasts To 2032 (USD Billion)
9. Bromobenzene Market Segmentation, By Crop Type
9.1 Chapter Overview
9.2 <99%
9.2.1 <99% Market Trends Analysis (2020-2032)
9.2.2 <99% Market Size Estimates And Forecasts To 2032 (USD Billion)
9.3 ≥99%
9.3.1 ≥99% Market Trends Analysis (2020-2032)
9.3.2 ≥99% Market Size Estimates And Forecasts To 2032 (USD Billion)
10. Bromobenzene Market Segmentation, By Application
10.1 Chapter Overview
10.2 Solvent
10.2.1 Solvent Market Trends Analysis (2020-2032)
10.2.2 Solvent Market Size Estimates And Forecasts To 2032 (USD Billion)
10.3 Chemical Intermediate
10.3.1 Chemical Intermediate Market Trends Analysis (2020-2032)
10.3.2 Chemical Intermediate Market Size Estimates And Forecasts To 2032 (USD Billion)
10.4 Grignard Reagent
10.4.1 Grignard Reagent Market Trends Analysis (2020-2032)
10.4.2 Grignard Reagent Market Size Estimates And Forecasts To 2032 (USD Billion)
10.5 Catalyst & Reagent in Organic Synthesis
10.5.1 Catalyst & Reagent in Organic Synthesis Market Trends Analysis (2020-2032)
10.5.2 Catalyst & Reagent in Organic Synthesis Market Size Estimates And Forecasts To 2032 (USD Billion)
10.6 Others
10.6.1 Others Market Trends Analysis (2020-2032)
10.6.2 Others Market Size Estimates And Forecasts To 2032 (USD Billion)
11. Bromobenzene Market Segmentation, By End-Use Industry
11.1 Chapter Overview
11.2 Pharmaceuticals
11.2.1 Pharmaceuticals Market Trends Analysis (2020-2032)
11.2.2 Pharmaceuticals Market Size Estimates And Forecasts To 2032 (USD Billion)
11.3 Agrochemicals
11.3.1 Agrochemicals Market Trends Analysis (2020-2032)
11.3.2 Agrochemicals Market Size Estimates And Forecasts To 2032 (USD Billion)
11.4 Chemicals
11.4.1 Chemicals Market Trends Analysis (2020-2032)
11.4.2 Chemicals Market Size Estimates And Forecasts To 2032 (USD Billion)
11.5 Others
11.5.1 Others Market Trends Analysis (2020-2032)
11.5.2 Others Market Size Estimates And Forecasts To 2032 (USD Billion)
12. Regional Analysis
12.1 Chapter Overview
12.2 North America
12.2.1 Trends Analysis
12.2.2 North America Bromobenzene Market Estimates And Forecasts, By Country (2020-2032) (USD Billion)
12.2.3 North America Bromobenzene Market Estimates And Forecasts, By Grade (2020-2032) (USD Billion)
12.2.4 North America Bromobenzene Market Estimates And Forecasts, By Derivatives (2020-2032) (USD Billion)
12.2.5 North America Bromobenzene Market Estimates And Forecasts, By Crop Type (2020-2032) (USD Billion)
12.2.6 North America Bromobenzene Market Estimates And Forecasts, By Application (2020-2032) (USD Billion)
12.2.7 North America Bromobenzene Market Estimates And Forecasts, By End-Use Industry (2020-2032) (USD Billion)
12.2.8 USA
12.2.8.1 USA Bromobenzene Market Estimates And Forecasts, By Grade (2020-2032) (USD Billion)
12.2.8.2 USA Bromobenzene Market Estimates And Forecasts, By Derivatives (2020-2032) (USD Billion)
12.2.8.3 USA Bromobenzene Market Estimates And Forecasts, By Crop Type (2020-2032) (USD Billion)
12.2.8.4 USA Bromobenzene Market Estimates And Forecasts, By Application (2020-2032) (USD Billion)
12.2.8.5 USA Bromobenzene Market Estimates And Forecasts, By End-Use Industry (2020-2032) (USD Billion)
12.2.9 Canada
12.2.9.1 Canada Bromobenzene Market Estimates And Forecasts, By Grade (2020-2032) (USD Billion)
12.2.9.2 Canada Bromobenzene Market Estimates And Forecasts, By Derivatives (2020-2032) (USD Billion)
12.2.9.3 Canada Bromobenzene Market Estimates And Forecasts, By Crop Type (2020-2032) (USD Billion)
12.2.9.4 Canada Bromobenzene Market Estimates And Forecasts, By Application (2020-2032) (USD Billion)
12.2.9.5 Canada Bromobenzene Market Estimates And Forecasts, By End-Use Industry (2020-2032) (USD Billion)
12.2.10 Mexico
12.2.10.1 Mexico Bromobenzene Market Estimates And Forecasts, By Grade (2020-2032) (USD Billion)
12.2.10.2 Mexico Bromobenzene Market Estimates And Forecasts, By Derivatives (2020-2032) (USD Billion)
12.2.10.3 Mexico Bromobenzene Market Estimates And Forecasts, By Crop Type (2020-2032) (USD Billion)
12.2.10.4 Mexico Bromobenzene Market Estimates And Forecasts, By Application (2020-2032) (USD Billion)
12.2.10.5 Mexico Bromobenzene Market Estimates And Forecasts, By End-Use Industry (2020-2032) (USD Billion)
12.3 Europe
12.3.1 Eastern Europe
12.3.1.1 Trends Analysis
12.3.1.2 Eastern Europe Bromobenzene Market Estimates And Forecasts, By Country (2020-2032) (USD Billion)
12.3.1.3 Eastern Europe Bromobenzene Market Estimates And Forecasts, By Grade (2020-2032) (USD Billion)
12.3.1.4 Eastern Europe Bromobenzene Market Estimates And Forecasts, By Derivatives (2020-2032) (USD Billion)
12.3.1.5 Eastern Europe Bromobenzene Market Estimates And Forecasts, By Crop Type (2020-2032) (USD Billion)
12.3.1.6 Eastern Europe Bromobenzene Market Estimates And Forecasts, By Application (2020-2032) (USD Billion)
12.3.1.7 Eastern Europe Bromobenzene Market Estimates And Forecasts, By End-Use Industry (2020-2032) (USD Billion)
12.3.1.8 Poland
12.3.1.8.1 Poland Bromobenzene Market Estimates And Forecasts, By Grade (2020-2032) (USD Billion)
12.3.1.8.2 Poland Bromobenzene Market Estimates And Forecasts, By Derivatives (2020-2032) (USD Billion)
12.3.1.8.3 Poland Bromobenzene Market Estimates And Forecasts, By Crop Type (2020-2032) (USD Billion)
12.3.1.8.4 Poland Bromobenzene Market Estimates And Forecasts, By Application (2020-2032) (USD Billion)
12.3.1.8.5 Poland Bromobenzene Market Estimates And Forecasts, By End-Use Industry (2020-2032) (USD Billion)
12.3.1.9 Romania
12.3.1.9.1 Romania Bromobenzene Market Estimates And Forecasts, By Grade (2020-2032) (USD Billion)
12.3.1.9.2 Romania Bromobenzene Market Estimates And Forecasts, By Derivatives (2020-2032) (USD Billion)
12.3.1.9.3 Romania Bromobenzene Market Estimates And Forecasts, By Crop Type (2020-2032) (USD Billion)
12.3.1.9.4 Romania Bromobenzene Market Estimates And Forecasts, By Application (2020-2032) (USD Billion)
12.3.1.9.5 Romania Bromobenzene Market Estimates And Forecasts, By End-Use Industry (2020-2032) (USD Billion)
12.3.1.10 Hungary
12.3.1.10.1 Hungary Bromobenzene Market Estimates And Forecasts, By Grade (2020-2032) (USD Billion)
12.3.1.10.2 Hungary Bromobenzene Market Estimates And Forecasts, By Derivatives (2020-2032) (USD Billion)
12.3.1.10.3 Hungary Bromobenzene Market Estimates And Forecasts, By Crop Type (2020-2032) (USD Billion)
12.3.1.10.4 Hungary Bromobenzene Market Estimates And Forecasts, By Application (2020-2032) (USD Billion)
12.3.1.10.5 Hungary Bromobenzene Market Estimates And Forecasts, By End-Use Industry (2020-2032) (USD Billion)
12.3.1.11 Turkey
12.3.1.11.1 Turkey Bromobenzene Market Estimates And Forecasts, By Grade (2020-2032) (USD Billion)
12.3.1.11.2 Turkey Bromobenzene Market Estimates And Forecasts, By Derivatives (2020-2032) (USD Billion)
12.3.1.11.3 Turkey Bromobenzene Market Estimates And Forecasts, By Crop Type (2020-2032) (USD Billion)
12.3.1.11.4 Turkey Bromobenzene Market Estimates And Forecasts, By Application (2020-2032) (USD Billion)
12.3.1.11.5 Turkey Bromobenzene Market Estimates And Forecasts, By End-Use Industry (2020-2032) (USD Billion)
12.3.1.12 Rest Of Eastern Europe
12.3.1.12.1 Rest Of Eastern Europe Bromobenzene Market Estimates And Forecasts, By Grade (2020-2032) (USD Billion)
12.3.1.12.2 Rest Of Eastern Europe Bromobenzene Market Estimates And Forecasts, By Derivatives (2020-2032) (USD Billion)
12.3.1.12.3 Rest Of Eastern Europe Bromobenzene Market Estimates And Forecasts, By Crop Type (2020-2032) (USD Billion)
12.3.1.12.4 Rest Of Eastern Europe Bromobenzene Market Estimates And Forecasts, By Application (2020-2032) (USD Billion)
12.3.1.12.5 Rest Of Eastern Europe Bromobenzene Market Estimates And Forecasts, By End-Use Industry (2020-2032) (USD Billion)
12.3.2 Western Europe
12.3.2.1 Trends Analysis
12.3.2.2 Western Europe Bromobenzene Market Estimates And Forecasts, By Country (2020-2032) (USD Billion)
12.3.2.3 Western Europe Bromobenzene Market Estimates And Forecasts, By Grade (2020-2032) (USD Billion)
12.3.2.4 Western Europe Bromobenzene Market Estimates And Forecasts, By Derivatives (2020-2032) (USD Billion)
12.3.2.5 Western Europe Bromobenzene Market Estimates And Forecasts, By Crop Type (2020-2032) (USD Billion)
12.3.2.6 Western Europe Bromobenzene Market Estimates And Forecasts, By Application (2020-2032) (USD Billion)
12.3.2.7 Western Europe Bromobenzene Market Estimates And Forecasts, By End-Use Industry (2020-2032) (USD Billion)
12.3.2.8 Germany
12.3.2.8.1 Germany Bromobenzene Market Estimates And Forecasts, By Grade (2020-2032) (USD Billion)
12.3.2.8.2 Germany Bromobenzene Market Estimates And Forecasts, By Derivatives (2020-2032) (USD Billion)
12.3.2.8.3 Germany Bromobenzene Market Estimates And Forecasts, By Crop Type (2020-2032) (USD Billion)
12.3.2.8.4 Germany Bromobenzene Market Estimates And Forecasts, By Application (2020-2032) (USD Billion)
12.3.2.8.5 Germany Bromobenzene Market Estimates And Forecasts, By End-Use Industry (2020-2032) (USD Billion)
12.3.2.9 France
12.3.2.9.1 France Bromobenzene Market Estimates And Forecasts, By Grade (2020-2032) (USD Billion)
12.3.2.9.2 France Bromobenzene Market Estimates And Forecasts, By Derivatives (2020-2032) (USD Billion)
12.3.2.9.3 France Bromobenzene Market Estimates And Forecasts, By Crop Type (2020-2032) (USD Billion)
12.3.2.9.4 France Bromobenzene Market Estimates And Forecasts, By Application (2020-2032) (USD Billion)
12.3.2.9.5 France Bromobenzene Market Estimates And Forecasts, By End-Use Industry (2020-2032) (USD Billion)
12.3.2.10 UK
12.3.2.10.1 UK Bromobenzene Market Estimates And Forecasts, By Grade (2020-2032) (USD Billion)
12.3.2.10.2 UK Bromobenzene Market Estimates And Forecasts, By Derivatives (2020-2032) (USD Billion)
12.3.2.10.3 UK Bromobenzene Market Estimates And Forecasts, By Crop Type (2020-2032) (USD Billion)
12.3.2.10.4 UK Bromobenzene Market Estimates And Forecasts, By Application (2020-2032) (USD Billion)
12.3.2.10.5 UK Bromobenzene Market Estimates And Forecasts, By End-Use Industry (2020-2032) (USD Billion)
12.3.2.11 Italy
12.3.2.11.1 Italy Bromobenzene Market Estimates And Forecasts, By Grade (2020-2032) (USD Billion)
12.3.2.11.2 Italy Bromobenzene Market Estimates And Forecasts, By Derivatives (2020-2032) (USD Billion)
12.3.2.11.3 Italy Bromobenzene Market Estimates And Forecasts, By Crop Type (2020-2032) (USD Billion)
12.3.2.11.4 Italy Bromobenzene Market Estimates And Forecasts, By Application (2020-2032) (USD Billion)
12.3.2.11.5 Italy Bromobenzene Market Estimates And Forecasts, By End-Use Industry (2020-2032) (USD Billion)
12.3.2.12 Spain
12.3.2.12.1 Spain Bromobenzene Market Estimates And Forecasts, By Grade (2020-2032) (USD Billion)
12.3.2.12.2 Spain Bromobenzene Market Estimates And Forecasts, By Derivatives (2020-2032) (USD Billion)
12.3.2.12.3 Spain Bromobenzene Market Estimates And Forecasts, By Crop Type (2020-2032) (USD Billion)
12.3.2.12.4 Spain Bromobenzene Market Estimates And Forecasts, By Application (2020-2032) (USD Billion)
12.3.2.12.5 Spain Bromobenzene Market Estimates And Forecasts, By End-Use Industry (2020-2032) (USD Billion)
12.3.2.13 Netherlands
12.3.2.13.1 Netherlands Bromobenzene Market Estimates And Forecasts, By Grade (2020-2032) (USD Billion)
12.3.2.13.2 Netherlands Bromobenzene Market Estimates And Forecasts, By Derivatives (2020-2032) (USD Billion)
12.3.2.13.3 Netherlands Bromobenzene Market Estimates And Forecasts, By Crop Type (2020-2032) (USD Billion)
12.3.2.13.4 Netherlands Bromobenzene Market Estimates And Forecasts, By Application (2020-2032) (USD Billion)
12.3.2.13.5 Netherlands Bromobenzene Market Estimates And Forecasts, By End-Use Industry (2020-2032) (USD Billion)
12.3.2.14 Switzerland
12.3.2.14.1 Switzerland Bromobenzene Market Estimates And Forecasts, By Grade (2020-2032) (USD Billion)
12.3.2.14.2 Switzerland Bromobenzene Market Estimates And Forecasts, By Derivatives (2020-2032) (USD Billion)
12.3.2.14.3 Switzerland Bromobenzene Market Estimates And Forecasts, By Crop Type (2020-2032) (USD Billion)
12.3.2.14.4 Switzerland Bromobenzene Market Estimates And Forecasts, By Application (2020-2032) (USD Billion)
12.3.2.12.5 Switzerland Bromobenzene Market Estimates And Forecasts, By End-Use Industry (2020-2032) (USD Billion)
12.3.2.15 Austria
12.3.2.15.1 Austria Bromobenzene Market Estimates And Forecasts, By Grade (2020-2032) (USD Billion)
12.3.2.15.2 Austria Bromobenzene Market Estimates And Forecasts, By Derivatives (2020-2032) (USD Billion)
12.3.2.15.3 Austria Bromobenzene Market Estimates And Forecasts, By Crop Type (2020-2032) (USD Billion)
12.3.2.15.4 Austria Bromobenzene Market Estimates And Forecasts, By Application (2020-2032) (USD Billion)
12.3.2.15.5 Austria Bromobenzene Market Estimates And Forecasts, By End-Use Industry (2020-2032) (USD Billion)
12.3.2.16 Rest Of Western Europe
12.3.2.16.1 Rest Of Western Europe Bromobenzene Market Estimates And Forecasts, By Grade (2020-2032) (USD Billion)
12.3.2.16.2 Rest Of Western Europe Bromobenzene Market Estimates And Forecasts, By Derivatives (2020-2032) (USD Billion)
12.3.2.16.3 Rest Of Western Europe Bromobenzene Market Estimates And Forecasts, By Crop Type (2020-2032) (USD Billion)
12.3.2.16.4 Rest Of Western Europe Bromobenzene Market Estimates And Forecasts, By Application (2020-2032) (USD Billion)
12.3.2.16.5 Rest Of Western Europe Bromobenzene Market Estimates And Forecasts, By End-Use Industry (2020-2032) (USD Billion)
12.4 Asia Pacific
12.4.1 Trends Analysis
12.4.2 Asia Pacific Bromobenzene Market Estimates And Forecasts, By Country (2020-2032) (USD Billion)
12.4.3 Asia Pacific Bromobenzene Market Estimates And Forecasts, By Grade (2020-2032) (USD Billion)
12.4.4 Asia Pacific Bromobenzene Market Estimates And Forecasts, By Derivatives (2020-2032) (USD Billion)
12.4.5 Asia Pacific Bromobenzene Market Estimates And Forecasts, By Crop Type (2020-2032) (USD Billion)
12.4.6 Asia Pacific Bromobenzene Market Estimates And Forecasts, By Application (2020-2032) (USD Billion)
12.4.7 Asia Pacific Bromobenzene Market Estimates And Forecasts, By End-Use Industry (2020-2032) (USD Billion)
12.4.8 China
12.4.8.1 China Bromobenzene Market Estimates And Forecasts, By Grade (2020-2032) (USD Billion)
12.4.8.2 China Bromobenzene Market Estimates And Forecasts, By Derivatives (2020-2032) (USD Billion)
12.4.8.3 China Bromobenzene Market Estimates And Forecasts, By Crop Type (2020-2032) (USD Billion)
12.4.8.4 China Bromobenzene Market Estimates And Forecasts, By Application (2020-2032) (USD Billion)
12.4.8.5 China Bromobenzene Market Estimates And Forecasts, By End-Use Industry (2020-2032) (USD Billion)
12.4.9 India
12.4.9.1 India Bromobenzene Market Estimates And Forecasts, By Grade (2020-2032) (USD Billion)
12.4.9.2 India Bromobenzene Market Estimates And Forecasts, By Derivatives (2020-2032) (USD Billion)
12.4.9.3 India Bromobenzene Market Estimates And Forecasts, By Crop Type (2020-2032) (USD Billion)
12.4.9.4 India Bromobenzene Market Estimates And Forecasts, By Application (2020-2032) (USD Billion)
12.4.9.5 India Bromobenzene Market Estimates And Forecasts, By End-Use Industry (2020-2032) (USD Billion)
12.4.10 Japan
12.4.10.1 Japan Bromobenzene Market Estimates And Forecasts, By Grade (2020-2032) (USD Billion)
12.4.10.2 Japan Bromobenzene Market Estimates And Forecasts, By Derivatives (2020-2032) (USD Billion)
12.4.10.3 Japan Bromobenzene Market Estimates And Forecasts, By Crop Type (2020-2032) (USD Billion)
12.4.10.4 Japan Bromobenzene Market Estimates And Forecasts, By Application (2020-2032) (USD Billion)
12.4.10.5 Japan Bromobenzene Market Estimates And Forecasts, By End-Use Industry (2020-2032) (USD Billion)
12.4.11 South Korea
12.4.11.1 South Korea Bromobenzene Market Estimates And Forecasts, By Grade (2020-2032) (USD Billion)
12.4.11.2 South Korea Bromobenzene Market Estimates And Forecasts, By Derivatives (2020-2032) (USD Billion)
12.4.11.3 South Korea Bromobenzene Market Estimates And Forecasts, By Crop Type (2020-2032) (USD Billion)
12.4.11.4 South Korea Bromobenzene Market Estimates And Forecasts, By Application (2020-2032) (USD Billion)
12.4.11.5 South Korea Bromobenzene Market Estimates And Forecasts, By End-Use Industry (2020-2032) (USD Billion)
12.4.12 Vietnam
12.4.12.1 Vietnam Bromobenzene Market Estimates And Forecasts, By Grade (2020-2032) (USD Billion)
12.4.12.2 Vietnam Bromobenzene Market Estimates And Forecasts, By Derivatives (2020-2032) (USD Billion)
12.4.12.3 Vietnam Bromobenzene Market Estimates And Forecasts, By Crop Type (2020-2032) (USD Billion)
12.4.12.4 Vietnam Bromobenzene Market Estimates And Forecasts, By Application (2020-2032) (USD Billion)
12.4.12.5 Vietnam Bromobenzene Market Estimates And Forecasts, By End-Use Industry (2020-2032) (USD Billion)
12.4.13 Singapore
12.4.13.1 Singapore Bromobenzene Market Estimates And Forecasts, By Grade (2020-2032) (USD Billion)
12.4.13.2 Singapore Bromobenzene Market Estimates And Forecasts, By Derivatives (2020-2032) (USD Billion)
12.4.13.3 Singapore Bromobenzene Market Estimates And Forecasts, By Crop Type (2020-2032) (USD Billion)
12.4.13.4 Singapore Bromobenzene Market Estimates And Forecasts, By Application (2020-2032) (USD Billion)
12.4.13.5 Singapore Bromobenzene Market Estimates And Forecasts, By End-Use Industry (2020-2032) (USD Billion)
12.4.14 Australia
12.4.14.1 Australia Bromobenzene Market Estimates And Forecasts, By Grade (2020-2032) (USD Billion)
12.4.14.2 Australia Bromobenzene Market Estimates And Forecasts, By Derivatives (2020-2032) (USD Billion)
12.4.14.3 Australia Bromobenzene Market Estimates And Forecasts, By Crop Type (2020-2032) (USD Billion)
12.4.14.4 Australia Bromobenzene Market Estimates And Forecasts, By Application (2020-2032) (USD Billion)
12.4.14.5 Australia Bromobenzene Market Estimates And Forecasts, By End-Use Industry (2020-2032) (USD Billion)
12.4.15 Rest Of Asia Pacific
12.4.15.1 Rest Of Asia Pacific Bromobenzene Market Estimates And Forecasts, By Grade (2020-2032) (USD Billion)
12.4.15.2 Rest Of Asia Pacific Bromobenzene Market Estimates And Forecasts, By Derivatives (2020-2032) (USD Billion)
12.4.15.3 Rest Of Asia Pacific Bromobenzene Market Estimates And Forecasts, By Crop Type (2020-2032) (USD Billion)
12.4.15.4 Rest Of Asia Pacific Bromobenzene Market Estimates And Forecasts, By Application (2020-2032) (USD Billion)
12.4.15.5 Rest Of Asia Pacific Bromobenzene Market Estimates And Forecasts, By End-Use Industry (2020-2032) (USD Billion)
12.5 Middle East And Africa
12.5.1 Middle East
12.5.1.1 Trends Analysis
12.5.1.2 Middle East Bromobenzene Market Estimates And Forecasts, By Country (2020-2032) (USD Billion)
12.5.1.3 Middle East Bromobenzene Market Estimates And Forecasts, By Grade (2020-2032) (USD Billion)
12.5.1.4 Middle East Bromobenzene Market Estimates And Forecasts, By Derivatives (2020-2032) (USD Billion)
12.5.1.5 Middle East Bromobenzene Market Estimates And Forecasts, By Crop Type (2020-2032) (USD Billion)
12.5.1.6 Middle East Bromobenzene Market Estimates And Forecasts, By Application (2020-2032) (USD Billion)
12.5.1.7 Middle East Bromobenzene Market Estimates And Forecasts, By End-Use Industry (2020-2032) (USD Billion)
12.5.1.8 UAE
12.5.1.8.1 UAE Bromobenzene Market Estimates And Forecasts, By Grade (2020-2032) (USD Billion)
12.5.1.8.2 UAE Bromobenzene Market Estimates And Forecasts, By Derivatives (2020-2032) (USD Billion)
12.5.1.8.3 UAE Bromobenzene Market Estimates And Forecasts, By Crop Type (2020-2032) (USD Billion)
12.5.1.8.4 UAE Bromobenzene Market Estimates And Forecasts, By Application (2020-2032) (USD Billion)
12.5.1.8.5 UAE Bromobenzene Market Estimates And Forecasts, By End-Use Industry (2020-2032) (USD Billion)
12.5.1.9 Egypt
12.5.1.9.1 Egypt Bromobenzene Market Estimates And Forecasts, By Grade (2020-2032) (USD Billion)
12.5.1.9.2 Egypt Bromobenzene Market Estimates And Forecasts, By Derivatives (2020-2032) (USD Billion)
12.5.1.9.3 Egypt Bromobenzene Market Estimates And Forecasts, By Crop Type (2020-2032) (USD Billion)
12.5.1.9.4 Egypt Bromobenzene Market Estimates And Forecasts, By Application (2020-2032) (USD Billion)
12.5.1.9.5 Egypt Bromobenzene Market Estimates And Forecasts, By End-Use Industry (2020-2032) (USD Billion)
12.5.1.10 Saudi Arabia
12.5.1.10.1 Saudi Arabia Bromobenzene Market Estimates And Forecasts, By Grade (2020-2032) (USD Billion)
12.5.1.10.2 Saudi Arabia Bromobenzene Market Estimates And Forecasts, By Derivatives (2020-2032) (USD Billion)
12.5.1.10.3 Saudi Arabia Bromobenzene Market Estimates And Forecasts, By Crop Type (2020-2032) (USD Billion)
12.5.1.10.4 Saudi Arabia Bromobenzene Market Estimates And Forecasts, By Application (2020-2032) (USD Billion)
12.5.1.10.5 Saudi Arabia Bromobenzene Market Estimates And Forecasts, By End-Use Industry (2020-2032) (USD Billion)
12.5.1.11 Qatar
12.5.1.11.1 Qatar Bromobenzene Market Estimates And Forecasts, By Grade (2020-2032) (USD Billion)
12.5.1.11.2 Qatar Bromobenzene Market Estimates And Forecasts, By Derivatives (2020-2032) (USD Billion)
12.5.1.11.3 Qatar Bromobenzene Market Estimates And Forecasts, By Crop Type (2020-2032) (USD Billion)
12.5.1.11.4 Qatar Bromobenzene Market Estimates And Forecasts, By Application (2020-2032) (USD Billion)
12.5.1.11.5 Qatar Bromobenzene Market Estimates And Forecasts, By End-Use Industry (2020-2032) (USD Billion)
12.5.1.12 Rest Of Middle East
12.5.1.12.1 Rest Of Middle East Bromobenzene Market Estimates And Forecasts, By Grade (2020-2032) (USD Billion)
12.5.1.12.2 Rest Of Middle East Bromobenzene Market Estimates And Forecasts, By Derivatives (2020-2032) (USD Billion)
12.5.1.12.3 Rest Of Middle East Bromobenzene Market Estimates And Forecasts, By Crop Type (2020-2032) (USD Billion)
12.5.1.12.4 Rest Of Middle East Bromobenzene Market Estimates And Forecasts, By Application (2020-2032) (USD Billion)
12.5.1.12.5 Rest Of Middle East Bromobenzene Market Estimates And Forecasts, By End-Use Industry (2020-2032) (USD Billion)
12.5.2 Africa
12.5.2.1 Trends Analysis
12.5.2.2 Africa Bromobenzene Market Estimates And Forecasts, By Country (2020-2032) (USD Billion)
12.5.2.3 Africa Bromobenzene Market Estimates And Forecasts, By Grade (2020-2032) (USD Billion)
12.5.2.4 Africa Bromobenzene Market Estimates And Forecasts, By Derivatives (2020-2032) (USD Billion)
12.5.2.5 Africa Bromobenzene Market Estimates And Forecasts, By Crop Type (2020-2032) (USD Billion)
12.5.2.6 Africa Bromobenzene Market Estimates And Forecasts, By Application (2020-2032) (USD Billion)
12.5.2.7 Africa Bromobenzene Market Estimates And Forecasts, By End-Use Industry (2020-2032) (USD Billion)
12.5.2.8 South Africa
12.5.2.8.1 South Africa Bromobenzene Market Estimates And Forecasts, By Grade (2020-2032) (USD Billion)
12.5.2.8.2 South Africa Bromobenzene Market Estimates And Forecasts, By Derivatives (2020-2032) (USD Billion)
12.5.2.8.3 South Africa Bromobenzene Market Estimates And Forecasts, By Crop Type (2020-2032) (USD Billion)
12.5.2.8.4 South Africa Bromobenzene Market Estimates And Forecasts, By Application (2020-2032) (USD Billion)
12.5.2.8.5 South Africa Bromobenzene Market Estimates And Forecasts, By End-Use Industry (2020-2032) (USD Billion)
12.5.2.9 Nigeria
12.5.2.9.1 Nigeria Bromobenzene Market Estimates And Forecasts, By Grade (2020-2032) (USD Billion)
12.5.2.9.2 Nigeria Bromobenzene Market Estimates And Forecasts, By Derivatives (2020-2032) (USD Billion)
12.5.2.9.3 Nigeria Bromobenzene Market Estimates And Forecasts, By Crop Type (2020-2032) (USD Billion)
12.5.2.9.4 Nigeria Bromobenzene Market Estimates And Forecasts, By Application (2020-2032) (USD Billion)
12.5.2.9.5 Nigeria Bromobenzene Market Estimates And Forecasts, By End-Use Industry (2020-2032) (USD Billion)
12.5.2.10 Rest Of Africa
12.5.2.10.1 Rest Of Africa Bromobenzene Market Estimates And Forecasts, By Grade (2020-2032) (USD Billion)
12.5.2.10.2 Rest Of Africa Bromobenzene Market Estimates And Forecasts, By Derivatives (2020-2032) (USD Billion)
12.5.2.10.3 Rest Of Africa Bromobenzene Market Estimates And Forecasts, By Crop Type (2020-2032) (USD Billion)
12.5.2.10.4 Rest Of Africa Bromobenzene Market Estimates And Forecasts, By Application (2020-2032) (USD Billion)
12.5.2.10.5 Rest Of Africa Bromobenzene Market Estimates And Forecasts, By End-Use Industry (2020-2032) (USD Billion)
12.6 Latin America
12.6.1 Trends Analysis
12.6.2 Latin America Bromobenzene Market Estimates And Forecasts, By Country (2020-2032) (USD Billion)
12.6.3 Latin America Bromobenzene Market Estimates And Forecasts, By Grade (2020-2032) (USD Billion)
12.6.4 Latin America Bromobenzene Market Estimates And Forecasts, By Derivatives (2020-2032) (USD Billion)
12.6.5 Latin America Bromobenzene Market Estimates And Forecasts, By Crop Type (2020-2032) (USD Billion)
12.6.6 Latin America Bromobenzene Market Estimates And Forecasts, By Application (2020-2032) (USD Billion)
12.6.7 Latin America Bromobenzene Market Estimates And Forecasts, By End-Use Industry (2020-2032) (USD Billion)
12.6.8 Brazil
12.6.8.1 Brazil Bromobenzene Market Estimates And Forecasts, By Grade (2020-2032) (USD Billion)
12.6.8.2 Brazil Bromobenzene Market Estimates And Forecasts, By Derivatives (2020-2032) (USD Billion)
12.6.8.3 Brazil Bromobenzene Market Estimates And Forecasts, By Crop Type (2020-2032) (USD Billion)
12.6.8.4 Brazil Bromobenzene Market Estimates And Forecasts, By Application (2020-2032) (USD Billion)
12.6.8.5 Brazil Bromobenzene Market Estimates And Forecasts, By End-Use Industry (2020-2032) (USD Billion)
12.6.9 Argentina
12.6.9.1 Argentina Bromobenzene Market Estimates And Forecasts, By Grade (2020-2032) (USD Billion)
12.6.9.2 Argentina Bromobenzene Market Estimates And Forecasts, By Derivatives (2020-2032) (USD Billion)
12.6.9.3 Argentina Bromobenzene Market Estimates And Forecasts, By Crop Type (2020-2032) (USD Billion)
12.6.9.4 Argentina Bromobenzene Market Estimates And Forecasts, By Application (2020-2032) (USD Billion)
12.6.9.5 Argentina Bromobenzene Market Estimates And Forecasts, By End-Use Industry (2020-2032) (USD Billion)
12.6.10 Colombia
12.6.10.1 Colombia Bromobenzene Market Estimates And Forecasts, By Grade (2020-2032) (USD Billion)
12.6.10.2 Colombia Bromobenzene Market Estimates And Forecasts, By Derivatives (2020-2032) (USD Billion)
12.6.10.3 Colombia Bromobenzene Market Estimates And Forecasts, By Crop Type (2020-2032) (USD Billion)
12.6.10.4 Colombia Bromobenzene Market Estimates And Forecasts, By Application (2020-2032) (USD Billion)
12.6.10.5 Colombia Bromobenzene Market Estimates And Forecasts, By End-Use Industry (2020-2032) (USD Billion)
12.6.11 Rest Of Latin America
12.6.11.1 Rest Of Latin America Bromobenzene Market Estimates And Forecasts, By Grade (2020-2032) (USD Billion)
12.6.11.2 Rest Of Latin America Bromobenzene Market Estimates And Forecasts, By Derivatives (2020-2032) (USD Billion)
12.6.11.3 Rest Of Latin America Bromobenzene Market Estimates And Forecasts, By Crop Type (2020-2032) (USD Billion)
12.6.11.4 Rest Of Latin America Bromobenzene Market Estimates And Forecasts, By Application (2020-2032) (USD Billion)
12.6.11.5 Rest Of Latin America Bromobenzene Market Estimates And Forecasts, By End-Use Industry (2020-2032) (USD Billion)
13. Company Profiles
13.1 Chemcon Speciality Chemicals Limited
13.1.1 Company Overview
13.1.2 Financial
13.1.3 Products/ Services Offered
13.1.4 SWOT Analysis
13.2 Aarti Industries
13.2.1 Company Overview
13.2.2 Financial
13.2.3 Products/ Services Offered
13.2.4 SWOT Analysis
13.3 Lanxess
13.3.1 Company Overview
13.3.2 Financial
13.3.3 Products/ Services Offered
13.3.4 SWOT Analysis
13.4 Merck KGaA
13.4.1 Company Overview
13.4.2 Financial
13.4.3 Products/ Services Offered
13.4.4 SWOT Analysis
13.5 Shandong Henglian Chemical Co. Ltd
13.5.1 Company Overview
13.5.2 Financial
13.5.3 Products/ Services Offered
13.5.4 SWOT Analysis
13.6 Heranba Industries Ltd.
13.6.1 Company Overview
13.6.2 Financial
13.6.3 Products/ Services Offered
13.6.4 SWOT Analysis
13.7 Weifang Yonhop Chemical Co., Ltd.
13.7.1 Company Overview
13.7.2 Financial
13.7.3 Products/ Services Offered
13.7.4 SWOT Analysis
13.8 Yancheng Longshen Chemical Co., Ltd.
13.8.1 Company Overview
13.8.2 Financial
13.8.3 Products/ Services Offered
13.8.4 SWOT Analysis
13.9 Jiangsu Dacheng Pharmaceutical and Chemical Co., Ltd.
13.9.1 Company Overview
13.9.2 Financial
13.9.3 Products/ Services Offered
13.9.4 SWOT Analysis
13.10 Haihang Industry Co., Ltd.
13.10.1 Company Overview
13.10.2 Financial
13.10.3 Products/ Services Offered
13.10.4 SWOT Analysis
14. Use Cases and Best Practices
15. Conclusion
An accurate research report requires proper strategizing as well as implementation. There are multiple factors involved in the completion of good and accurate research report and selecting the best methodology to compete the research is the toughest part. Since the research reports we provide play a crucial role in any company’s decision-making process, therefore we at SNS Insider always believe that we should choose the best method which gives us results closer to reality. This allows us to reach at a stage wherein we can provide our clients best and accurate investment to output ratio.
Each report that we prepare takes a timeframe of 350-400 business hours for production. Starting from the selection of titles through a couple of in-depth brain storming session to the final QC process before uploading our titles on our website we dedicate around 350 working hours. The titles are selected based on their current market cap and the foreseen CAGR and growth.
The 5 steps process:
Step 1: Secondary Research:
Secondary Research or Desk Research is as the name suggests is a research process wherein, we collect data through the readily available information. In this process we use various paid and unpaid databases which our team has access to and gather data through the same. This includes examining of listed companies’ annual reports, Journals, SEC filling etc. Apart from this our team has access to various associations across the globe across different industries. Lastly, we have exchange relationships with various university as well as individual libraries.
Step 2: Primary Research
When we talk about primary research, it is a type of study in which the researchers collect relevant data samples directly, rather than relying on previously collected data. This type of research is focused on gaining content specific facts that can be sued to solve specific problems. Since the collected data is fresh and first hand therefore it makes the study more accurate and genuine.
We at SNS Insider have divided Primary Research into 2 parts.
Part 1 wherein we interview the KOLs of major players as well as the upcoming ones across various geographic regions. This allows us to have their view over the market scenario and acts as an important tool to come closer to the accurate market numbers. As many as 45 paid and unpaid primary interviews are taken from both the demand and supply side of the industry to make sure we land at an accurate judgement and analysis of the market.
This step involves the triangulation of data wherein our team analyses the interview transcripts, online survey responses and observation of on filed participants. The below mentioned chart should give a better understanding of the part 1 of the primary interview.
Part 2: In this part of primary research the data collected via secondary research and the part 1 of the primary research is validated with the interviews from individual consultants and subject matter experts.
Consultants are those set of people who have at least 12 years of experience and expertise within the industry whereas Subject Matter Experts are those with at least 15 years of experience behind their back within the same space. The data with the help of two main processes i.e., FGDs (Focused Group Discussions) and IDs (Individual Discussions). This gives us a 3rd party nonbiased primary view of the market scenario making it a more dependable one while collation of the data pointers.
Step 3: Data Bank Validation
Once all the information is collected via primary and secondary sources, we run that information for data validation. At our intelligence centre our research heads track a lot of information related to the market which includes the quarterly reports, the daily stock prices, and other relevant information. Our data bank server gets updated every fortnight and that is how the information which we collected using our primary and secondary information is revalidated in real time.
Step 4: QA/QC Process
After all the data collection and validation our team does a final level of quality check and quality assurance to get rid of any unwanted or undesired mistakes. This might include but not limited to getting rid of the any typos, duplication of numbers or missing of any important information. The people involved in this process include technical content writers, research heads and graphics people. Once this process is completed the title gets uploader on our platform for our clients to read it.
Step 5: Final QC/QA Process:
This is the last process and comes when the client has ordered the study. In this process a final QA/QC is done before the study is emailed to the client. Since we believe in giving our clients a good experience of our research studies, therefore, to make sure that we do not lack at our end in any way humanly possible we do a final round of quality check and then dispatch the study to the client.
Key Segments:
By Grade
Pharmaceutical Grade
Industrial Grade
Reagent Grade
By Derivatives
Phenylmagnesium Bromide
Diphenyl Ether
Phencyclidine Precursors
Others
By Purity
<99%
≥99%
By Application
Solvent
Chemical Intermediate
Grignard Reagent
Catalyst & Reagent in Organic Synthesis
Others
By End-Use Industry
Pharmaceuticals
Agrochemicals
Chemicals
Others
Request for Segment Customization as per your Business Requirement: Segment Customization Request
Regional Coverage:
North America
US
Canada
Mexico
Europe
Eastern Europe
Poland
Romania
Hungary
Turkey
Rest of Eastern Europe
Western Europe
Germany
France
UK
Italy
Spain
Netherlands
Switzerland
Austria
Rest of Western Europe
Asia Pacific
China
India
Japan
South Korea
Vietnam
Singapore
Australia
Rest of Asia Pacific
Middle East & Africa
Middle East
UAE
Egypt
Saudi Arabia
Qatar
Rest of Middle East
Africa
Nigeria
South Africa
Rest of Africa
Latin America
Brazil
Argentina
Colombia
Rest of Latin America
Request for Country Level Research Report: Country Level Customization Request
Available Customization
With the given market data, SNS Insider offers customization as per the company’s specific needs. The following customization options are available for the report:
Detailed Volume Analysis
Criss-Cross segment analysis (e.g. Product X Application)
Competitive Product Benchmarking
Geographic Analysis
Additional countries in any of the regions
Customized Data Representation
Detailed analysis and profiling of additional market players
The Multi-Layer Cryogenic Insulation Market size was valued at USD 1114.6 Million in 2023 and is expected to reach USD 1981.22 Million by 2032, growing at a CAGR of 6.60% over the forecast period 2024-2032.
The Glycerol Derivatives Market Size was USD 16.0 Billion in 2023 and is expected to reach USD 28.4 Bn by 2032 and grow at a CAGR of 6.6% by 2024-2032.
Propylene Oxide Market was valued at USD 20.97 Billion in 2023 and is expected to reach USD 34.75 Billion by 2032, growing at a CAGR of 5.79% from 2024-2032.
Elastomers Market size was USD 97.80 billion in 2023 and is expected to reach USD 147.35 billion by 2032, growing at a CAGR of 4.23% from 2024 to 2032.
The Agrochemicals Market was USD 253.6 billion in 2023 and is expected to reach USD 354.8 billion by 2032, growing at a CAGR of 3.8% over the forecast period of 2024-2032.
The HVAC Filters Market size was valued at USD 3.90 billion in 2023 and is expected to reach USD 6.59 billion by 2032 and grow at a CAGR of 6.00% over the forecast period of 2024-2032.
Hi! Click one of our member below to chat on Phone