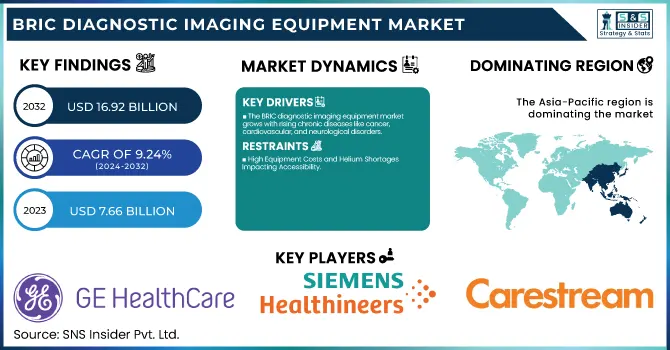
The BRIC Diagnostic Imaging Equipment Market Size was valued at USD 7.66 billion in 2023 and is expected to reach USD 16.92 billion by 2032 and grow at a CAGR of 9.24% over the forecast period 2024-2032. This report identifies the expanding incidence and prevalence of diseases as a driver for demand for enhanced diagnostic imaging products, in conjunction with growing health expenditures in the BRIC nations, driven by both public and private payors. The study delves into trends in the installation of diagnostic imaging equipment country by country based on differing patterns of infrastructure building and investment drivers. Moreover, it analyzes trends in technological adoption, such as the use of AI, cloud imaging, and point-of-care diagnostic solutions, that are improving accessibility and efficiency. It also evaluates the regulatory environment and policy, analyzing how it affects market growth, product approval, and standardization initiatives across these emerging markets.
To Get more information on BRIC Diagnostic Imaging Equipment Market - Request Free Sample Report
Drivers
The BRIC diagnostic imaging equipment market is driven by the rising prevalence of chronic diseases such as cancer, cardiovascular disorders, and neurological conditions.
With more than 4 million new cancer cases diagnosed in BRIC nations in 2020, the need for early and precise diagnosis has increased. Governments and private enterprises are investing heavily in healthcare infrastructure, which is driving the adoption of sophisticated imaging systems. The use of artificial intelligence (AI) in diagnostic imaging improves accuracy and efficiency, making imaging technology more appealing to healthcare providers. Moreover, widening applications like image-guided interventions and interventional procedures also support the increasing need for diagnostic imaging solutions.
Restraints
High Equipment Costs and Helium Shortages Impacting Accessibility
While offering promising expansion, the market has challenges that include the expensive cost of high-tech imaging equipment. MRI devices, for example, are priced above USD 1 million, a cost that small hospitals and clinics cannot meet. Moreover, the lack of helium, a component used in MRI technology, has raised operating costs and maintenance issues. Limited budgets and increasing equipment costs limit the diffusion of advanced imaging modalities, especially in low-budget healthcare institutions. These fiscal and logistical obstacles significantly impede market penetration in some areas.
Opportunities
AI-Powered Imaging and Mobile Diagnostics Expanding Access
Growing trends of AI-based imaging and mobile diagnostics services offer viable opportunities in the BRIC marketplace. AI ensures accuracy in interpreting images, avoiding mistakes, and increasing efficiency in the hands of radiologists. Portable X-ray and ultrasound solutions are widening remote and underserved areas' accessibility. The widespread use of teleradiology services further distances radiologists and patients, bringing timely and correct diagnoses. These developments not only enhance the care of patients but also generate additional revenue streams for market participants, driving market expansion.
Challenges
Growing Adoption of Refurbished Equipment and System Integration Issues
The growing trend towards second-hand imaging machines presents a challenge to producers of new equipment. Cost-sensitive hospitals tend to prefer second-hand systems, and this impacts the sale of brand-new diagnostic imaging solutions. Standalone imaging devices also tend to have problems with interoperability, which results in inefficiencies in data handling and hospital workflow. Limited integration with hospital information systems creates delays in diagnosis and treatment planning. It demands low-cost new products and better system compatibility with today's healthcare IT infrastructures to overcome such issues.
By Modality
In 2023, MRI systems were the leading modality in the BRIC diagnostic imaging equipment market, with a high market share. This leadership is mainly due to technological innovation that has improved imaging capabilities, resulting in accurate and early detection of diseases. The non-invasive nature of MRI procedures has seen them gain greater acceptance by patients and healthcare professionals. Furthermore, the increase in the occurrence of chronic conditions like cancer and neurological disorders has increased the need for accurate diagnostic equipment, further supporting the use of MRI systems. Furthermore, growing healthcare expenditures in BRIC nations have enabled the acquisition of sophisticated MRI equipment, securing their market dominance.
Nuclear imaging equipment has become the most rapidly expanding sector in the BRIC diagnostic imaging equipment market. Its rapid expansion is fueled by mounting cases of chronic diseases, such as cardiovascular disease and cancers, that require sophisticated diagnostic equipment for proper evaluation and treatment planning. The fact that nuclear imaging can offer information about function at the molecular level provides tremendous benefits over conventional imaging modalities, resulting in its quicker adoption. In addition, advances in technology have made the systems more user-friendly and affordable, prompting healthcare institutions to incorporate them into their diagnostic services. Government efforts towards enhancing healthcare infrastructure and early detection of diseases have also contributed significantly to the growth of nuclear imaging systems in BRIC countries.
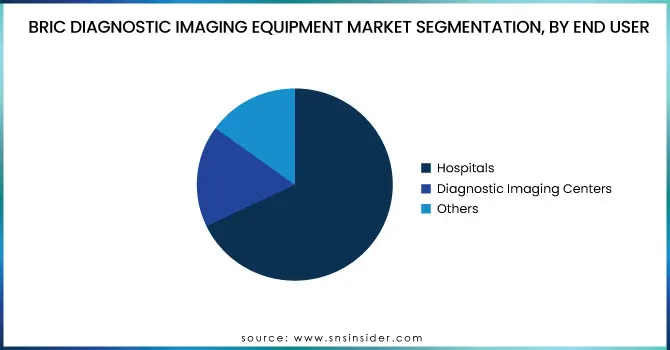
By End User
Hospitals have retained their status as the leading end-users of the BRIC diagnostic imaging equipment market, with a substantial share in 2023. This is because they provide a complete range of diagnostic services, both for inpatients and outpatients. The inclusion of sophisticated imaging technologies in hospital environments guarantees the ready availability of diagnostic information, enabling quick clinical decision-making. Moreover, hospitals tend to have the budget to invest in advanced imaging technology, which guarantees quality patient care. The automation and digitization of radiology processes in hospitals have also increased operational efficiency, further solidifying their position as market leaders in the diagnostic imaging equipment market.
Diagnostic imaging centers are seeing a high growth rate in the BRIC nations, representing the most rapidly growing end-user segment. The rise is a result of growing demands for specialist imaging services and a trend away from inpatient diagnostic operations. The centers have specialized expertise and are generally able to deliver more rapid service than larger hospital facilities, making them appealing to patients interested in streamlined diagnostic solutions. The growth of such centers is also fueled by reduced operational expenses and the capacity to implement new technologies quickly, meeting the changing demands of patients and healthcare professionals. Additionally, favorable government policies and investments in healthcare infrastructure have made it easier to set up and expand diagnostic imaging centers in BRIC countries, leading to their growing market share.
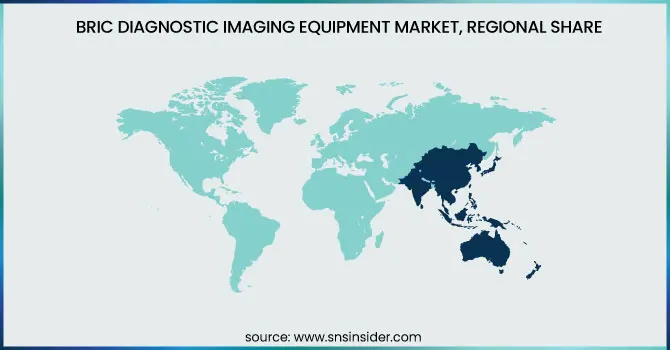
The BRIC Diagnostic Imaging Equipment Market is characterized by varying regional patterns shaped by economic expansion, development of healthcare infrastructure, and advancements in technology. The market is dominated by China based on its enormous healthcare system, high penetration of AI-driven imaging solutions, and robust support by the government for domestic producers such as United Imaging and Neusoft Corporation. The nation leads the market share of diagnostic imaging installations, especially in city-based hospitals.
India is the fastest-growing market, driven by rising healthcare investments, a growing burden of chronic diseases, and increasing access to diagnostic services in rural India. The growth of private diagnostic imaging centers and the adoption of cost-effective imaging solutions from local players such as Allengers and CURA Healthcare further drive the market.
Brazil is experiencing steady growth with support from government efforts to update public healthcare centers and improve imaging access. The need for digital radiography and ultrasound equipment is growing, particularly in private hospitals. Nevertheless, economic fluctuations can create challenges.
Russia boasts a well-developed imaging market, with increased investments in new modalities such as MRI and CT. Domestic producers like NP JSC Amico and government initiatives for local production are fortifying market dynamics. Geopolitical trends, though, affect dependence on imports and price structures.
Get Customized Report as per Your Business Requirement - Enquiry Now
GE Healthcare – Revolution CT, Optima XR646 X-ray System, LOGIQ E10 Ultrasound, SIGNA Architect MRI
Siemens Healthineers – SOMATOM Force CT, MAGNETOM Vida MRI, ACUSON Sequoia Ultrasound, MAMMOMAT Revelation Mammography, NAEOTOM Alpha
Koninklijke Philips N.V. – Ingenia Ambition MRI, IQon Spectral CT, EPIQ Elite Ultrasound, DigitalDiagnost C90 X-ray System
Canon Medical Systems Corporation – Aquilion ONE CT, Vantage Orian MRI, Aplio i-series Ultrasound, Radrex-i Digital X-ray System
Carestream Health, Inc. – OnSight 3D Extremity System, DRX-Revolution Mobile X-ray System, Touch Prime Ultrasound
Hologic, Inc. – Selenia Dimensions Mammography, Affirm Prone Biopsy System, Fluoroscan Insight FD Mini C-Arm
Hitachi, Ltd. – Supria CT Scanner, Echelon Smart MRI, ARIETTA 850 Ultrasound
Allengers – MARS 15 CT Scanner, Tesla MRI, Muson Ultrasound, Digital Radiography Systems
CURA Healthcare – CURA DicomPACS DX-R X-ray System, CURA Ultrasound Systems
Neusoft Corporation – NeuViz CT Scanner, NeuMR MRI System, Ultrasound Diagnostic Systems
NP JSC Amico – Magnetom Open MRI, CT Scanners, Digital X-ray Systems
SONTU Medical Imaging Equipment Co., Ltd. – Digital Radiography Systems, Ultrasound Imaging Systems
FUJIFILM Holdings Corporation – FCT Embrace CT, Arietta 850 Ultrasound, Amulet Innovality Mammography
United Imaging Healthcare Co., Ltd. – uCT 780, uMR 790, uMI 780, uDR 780
In Feb 2025, AsiaMedic Limited and Sunway Equity Holdings launched AsiaMedic Sunway Imaging, a new medical diagnostic imaging center at Royal Square, Novena. This marks a major expansion of their imaging capabilities, strengthening their presence in the medical diagnostics sector.
In Feb 2025, Diagnostica e Terapia Centro Aktis in Marano di Napoli expanded its imaging capabilities with new CT and MRI scanners. The upgrade was made possible through a collaboration between diagnostic service provider Fora and advanced imaging company United Imaging.
| Report Attributes | Details |
|---|---|
| Market Size in 2023 | USD 7.66 billion |
| Market Size by 2032 | USD 16.92 billion |
| CAGR | CAGR of 9.24% From 2024 to 2032 |
| Base Year | 2023 |
| Forecast Period | 2024-2032 |
| Historical Data | 2020-2022 |
| Report Scope & Coverage | Market Size, Segments Analysis, Competitive Landscape, Regional Analysis, DROC & SWOT Analysis, Forecast Outlook |
| Key Segments | • By Modality [X-ray Imaging Systems (By Technology, By Portability), Computed Tomography (CT) Scanners (By Technology, Conventional CT Market), Ultrasound Systems (By Technology), Magnetic Resonance Imaging (MRI) Systems (By Architecture, By Field Strength), Nuclear Imaging Systems (SPECT Systems, Hybrid PET Systems), Mammography Systems] • By End User [Hospitals, Diagnostic Imaging Centers, Others] |
| Regional Analysis/Coverage | North America (US, Canada, Mexico), Europe (Eastern Europe [Poland, Romania, Hungary, Turkey, Rest of Eastern Europe] Western Europe] Germany, France, UK, Italy, Spain, Netherlands, Switzerland, Austria, Rest of Western Europe]), Asia Pacific (China, India, Japan, South Korea, Vietnam, Singapore, Australia, Rest of Asia Pacific), Middle East & Africa (Middle East [UAE, Egypt, Saudi Arabia, Qatar, Rest of Middle East], Africa [Nigeria, South Africa, Rest of Africa], Latin America (Brazil, Argentina, Colombia, Rest of Latin America) |
| Company Profiles | GE Healthcare, Siemens Healthineers, Koninklijke Philips N.V., Canon Medical Systems Corporation, Carestream Health, Inc., Hologic, Inc., Hitachi, Ltd., Allengers, CURA Healthcare, Neusoft Corporation, NP JSC Amico, SONTU Medical Imaging Equipment Co., Ltd., FUJIFILM Holdings Corporation, United Imaging Healthcare Co., Ltd. |
Ans: The BRIC Diagnostic Imaging Equipment market is anticipated to grow at a CAGR of 9.24 % from 2024 to 2032.
Ans: The market is expected to reach USD 16.92 billion by 2032, increasing from USD 7.66 billion in 2023.
Ans: The BRIC diagnostic imaging equipment market is driven by the rising prevalence of chronic diseases such as cancer, cardiovascular disorders, and neurological conditions.
Ans: High Equipment Costs and Helium Shortages Impacting Accessibility
Ans: China dominated the BRIC Diagnostic Imaging Equipment market.
Table of content
1. Introduction
1.1 Market Definition
1.2 Scope (Inclusion and Exclusions)
1.3 Research Assumptions
2. Executive Summary
2.1 Market Overview
2.2 Regional Synopsis
2.3 Competitive Summary
3. Research Methodology
3.1 Top-Down Approach
3.2 Bottom-up Approach
3.3. Data Validation
3.4 Primary Interviews
4. Market Dynamics Impact Analysis
4.1 Market Driving Factors Analysis
4.1.2 Drivers
4.1.2 Restraints
4.1.3 Opportunities
4.1.4 Challenges
4.2 PESTLE Analysis
4.3 Porter’s Five Forces Model
5. Statistical Insights and Trends Reporting
5.1 Incidence and Prevalence of Diseases Driving Demand (2023)
5.2 Diagnostic Imaging Equipment Installation Trends (2023), by Country
5.3 Healthcare Spending on Diagnostic Imaging, by Country and Payor (2023)
5.4 Technological Adoption Trends in Imaging Equipment (2023-2032)
5.5 Regulatory and Policy Impact on Market Growth
6. Competitive Landscape
6.1 List of Major Companies, By Region
6.2 Market Share Analysis, By Region
6.3 Service Benchmarking
6.3.1 Service specifications and features
6.3.2 Pricing
6.4 Strategic Initiatives
6.4.1 Marketing and promotional activities
6.4.2 Distribution and Supply Chain Strategies
6.4.3 Expansion plans and new Service launches
6.4.4 Strategic partnerships and collaborations
6.5 Technological Advancements
6.6 Market Positioning and Branding
7. BRIC Diagnostic Imaging Equipment Market Segmentation, by Modality
7.2 X-ray Imaging Systems
7.2.1 X-ray Imaging Systems Market Trends Analysis (2020-2032)
7.2.2 X-ray Imaging Systems Market Size Estimates and Forecasts to 2032 (USD Billion)
7.2.3 By Technology
7.2.3.1 By Technology Market Trends Analysis (2020-2032)
7.2.3.2 By Technology Market Size Estimates and Forecasts to 2032 (USD Billion)
7.2.4 By Portability
7.2.4.1 By Portability Market Trends Analysis (2020-2032)
7.2.4.2 By Portability Market Size Estimates and Forecasts to 2032 (USD Billion)
7.3 Computed Tomography (CT) Scanners
7.3.1 Computed Tomography (CT) Scanners Market Trends Analysis (2020-2032)
7.3.2 Computed Tomography (CT) Scanners Market Size Estimates and Forecasts to 2032 (USD Billion)
7.3.3 By Technology
7.3.3.1 By Technology Market Trends Analysis (2020-2032)
7.3.3.2 By Technology Market Size Estimates and Forecasts to 2032 (USD Billion)
7.3.4 Conventional CT Market
7.3.4.1 Conventional CT Market Trends Analysis (2020-2032)
7.3.4.2 Conventional CT Market Size Estimates and Forecasts to 2032 (USD Billion)
7.4 Ultrasound Systems
7.4.1 Ultrasound Systems Market Trends Analysis (2020-2032)
7.4.2 Ultrasound Systems Market Size Estimates and Forecasts to 2032 (USD Billion)
7.4.3 By Technology
7.4.3.1 By Technology Market Trends Analysis (2020-2032)
7.4.3.2 By Technology Market Size Estimates and Forecasts to 2032 (USD Billion)
7.5 Magnetic Resonance Imaging (MRI) Systems
7.5.1 Magnetic Resonance Imaging (MRI) Systems Market Trends Analysis (2020-2032)
7.5.2 Magnetic Resonance Imaging (MRI) Systems Market Size Estimates and Forecasts to 2032 (USD Billion)
7.5.3 By Architecture
7.5.3.1 By Architecture Market Trends Analysis (2020-2032)
7.5.3.2 By Architecture Market Size Estimates and Forecasts to 2032 (USD Billion)
7.5.4 By Field Strength
7.5.4.1 By Field Strength Market Trends Analysis (2020-2032)
7.5.4.2 By Field Strength Market Size Estimates and Forecasts to 2032 (USD Billion)
7.6 Nuclear Imaging Systems
7.6.1 Nuclear Imaging Systems Market Trends Analysis (2020-2032)
7.6.2 Nuclear Imaging Systems Market Size Estimates and Forecasts to 2032 (USD Billion)
7.6.3 SPECT Systems
7.6.3.1 SPECT Systems Market Trends Analysis (2020-2032)
7.6.3.2 SPECT Systems Market Size Estimates and Forecasts to 2032 (USD Billion)
7.6.4 Hybrid PET Systems
7.6.4.1 Hybrid PET Systems Market Trends Analysis (2020-2032)
7.6.4.2 Hybrid PET Systems Market Size Estimates and Forecasts to 2032 (USD Billion)
7.7 Mammography Systems
7.7.1 Mammography Systems Market Trends Analysis (2020-2032)
7.7.2 Mammography Systems Market Size Estimates and Forecasts to 2032 (USD Billion)
8. BRIC Diagnostic Imaging Equipment Market Segmentation, by End User
8.2 Hospitals
8.2.1 Hospitals Market Trends Analysis (2020-2032)
8.2.2 Hospitals Market Size Estimates and Forecasts to 2032 (USD Billion)
8.3 Diagnostic Imaging Centers
8.3.1 Diagnostic Imaging Centers Market Trends Analysis (2020-2032)
8.3.2 Diagnostic Imaging Centers Market Size Estimates and Forecasts to 2032 (USD Billion)
8.4 Others
8.4.1 Others Market Trends Analysis (2020-2032)
8.4.2 Others Market Size Estimates and Forecasts to 2032 (USD Billion)
9. Regional Analysis
9.1 Chapter Overview
9.2 North America
9.2.1 Trends Analysis
9.2.2 North America BRIC Diagnostic Imaging Equipment Market Estimates and Forecasts, by Country (2020-2032) (USD Billion)
9.2.3 North America BRIC Diagnostic Imaging Equipment Market Estimates and Forecasts, by Modality (2020-2032) (USD Billion)
9.2.4 North America BRIC Diagnostic Imaging Equipment Market Estimates and Forecasts, by End User (2020-2032) (USD Billion)
9.2.5 USA
9.2.5.1 USA BRIC Diagnostic Imaging Equipment Market Estimates and Forecasts, by Modality (2020-2032) (USD Billion)
9.2.5.2 USA BRIC Diagnostic Imaging Equipment Market Estimates and Forecasts, by End User (2020-2032) (USD Billion)
9.2.6 Canada
9.2.6.1 Canada BRIC Diagnostic Imaging Equipment Market Estimates and Forecasts, by Modality (2020-2032) (USD Billion)
9.2.6.2 Canada BRIC Diagnostic Imaging Equipment Market Estimates and Forecasts, by End User (2020-2032) (USD Billion)
9.2.7 Mexico
9.2.7.1 Mexico BRIC Diagnostic Imaging Equipment Market Estimates and Forecasts, by Modality (2020-2032) (USD Billion)
9.2.7.2 Mexico BRIC Diagnostic Imaging Equipment Market Estimates and Forecasts, by End User (2020-2032) (USD Billion)
9.3 Europe
9.3.1 Eastern Europe
9.3.1.1 Trends Analysis
9.3.1.2 Eastern Europe BRIC Diagnostic Imaging Equipment Market Estimates and Forecasts, by Country (2020-2032) (USD Billion)
9.3.1.3 Eastern Europe BRIC Diagnostic Imaging Equipment Market Estimates and Forecasts, by Modality (2020-2032) (USD Billion)
9.3.1.4 Eastern Europe BRIC Diagnostic Imaging Equipment Market Estimates and Forecasts, by End User (2020-2032) (USD Billion)
9.3.1.5 Poland
9.3.1.5.1 Poland BRIC Diagnostic Imaging Equipment Market Estimates and Forecasts, by Modality (2020-2032) (USD Billion)
9.3.1.5.2 Poland BRIC Diagnostic Imaging Equipment Market Estimates and Forecasts, by End User (2020-2032) (USD Billion)
9.3.1.6 Romania
9.3.1.6.1 Romania BRIC Diagnostic Imaging Equipment Market Estimates and Forecasts, by Modality (2020-2032) (USD Billion)
9.3.1.6.2 Romania BRIC Diagnostic Imaging Equipment Market Estimates and Forecasts, by End User (2020-2032) (USD Billion)
9.3.1.7 Hungary
9.3.1.7.1 Hungary BRIC Diagnostic Imaging Equipment Market Estimates and Forecasts, by Modality (2020-2032) (USD Billion)
9.3.1.7.2 Hungary BRIC Diagnostic Imaging Equipment Market Estimates and Forecasts, by End User (2020-2032) (USD Billion)
9.3.1.8 Turkey
9.3.1.8.1 Turkey BRIC Diagnostic Imaging Equipment Market Estimates and Forecasts, by Modality (2020-2032) (USD Billion)
9.3.1.8.2 Turkey BRIC Diagnostic Imaging Equipment Market Estimates and Forecasts, by End User (2020-2032) (USD Billion)
9.3.1.9 Rest of Eastern Europe
9.3.1.9.1 Rest of Eastern Europe BRIC Diagnostic Imaging Equipment Market Estimates and Forecasts, by Modality (2020-2032) (USD Billion)
9.3.1.9.2 Rest of Eastern Europe BRIC Diagnostic Imaging Equipment Market Estimates and Forecasts, by End User (2020-2032) (USD Billion)
9.3.2 Western Europe
9.3.2.1 Trends Analysis
9.3.2.2 Western Europe BRIC Diagnostic Imaging Equipment Market Estimates and Forecasts, by Country (2020-2032) (USD Billion)
9.3.2.3 Western Europe BRIC Diagnostic Imaging Equipment Market Estimates and Forecasts, by Modality (2020-2032) (USD Billion)
9.3.2.4 Western Europe BRIC Diagnostic Imaging Equipment Market Estimates and Forecasts, by End User (2020-2032) (USD Billion)
9.3.2.5 Germany
9.3.2.5.1 Germany BRIC Diagnostic Imaging Equipment Market Estimates and Forecasts, by Modality (2020-2032) (USD Billion)
9.3.2.5.2 Germany BRIC Diagnostic Imaging Equipment Market Estimates and Forecasts, by End User (2020-2032) (USD Billion)
9.3.2.6 France
9.3.2.6.1 France BRIC Diagnostic Imaging Equipment Market Estimates and Forecasts, by Modality (2020-2032) (USD Billion)
9.3.2.6.2 France BRIC Diagnostic Imaging Equipment Market Estimates and Forecasts, by End User (2020-2032) (USD Billion)
9.3.2.7 UK
9.3.2.7.1 UK BRIC Diagnostic Imaging Equipment Market Estimates and Forecasts, by Modality (2020-2032) (USD Billion)
9.3.2.7.2 UK BRIC Diagnostic Imaging Equipment Market Estimates and Forecasts, by End User (2020-2032) (USD Billion)
9.3.2.8 Italy
9.3.2.8.1 Italy BRIC Diagnostic Imaging Equipment Market Estimates and Forecasts, by Modality (2020-2032) (USD Billion)
9.3.2.8.2 Italy BRIC Diagnostic Imaging Equipment Market Estimates and Forecasts, by End User (2020-2032) (USD Billion)
9.3.2.9 Spain
9.3.2.9.1 Spain BRIC Diagnostic Imaging Equipment Market Estimates and Forecasts, by Modality (2020-2032) (USD Billion)
9.3.2.9.2 Spain BRIC Diagnostic Imaging Equipment Market Estimates and Forecasts, by End User (2020-2032) (USD Billion)
9.3.2.10 Netherlands
9.3.2.10.1 Netherlands BRIC Diagnostic Imaging Equipment Market Estimates and Forecasts, by Modality (2020-2032) (USD Billion)
9.3.2.10.2 Netherlands BRIC Diagnostic Imaging Equipment Market Estimates and Forecasts, by End User (2020-2032) (USD Billion)
9.3.2.11 Switzerland
9.3.2.11.1 Switzerland BRIC Diagnostic Imaging Equipment Market Estimates and Forecasts, by Modality (2020-2032) (USD Billion)
9.3.2.11.2 Switzerland BRIC Diagnostic Imaging Equipment Market Estimates and Forecasts, by End User (2020-2032) (USD Billion)
9.3.2.12 Austria
9.3.2.12.1 Austria BRIC Diagnostic Imaging Equipment Market Estimates and Forecasts, by Modality (2020-2032) (USD Billion)
9.3.2.12.2 Austria BRIC Diagnostic Imaging Equipment Market Estimates and Forecasts, by End User (2020-2032) (USD Billion)
9.3.2.13 Rest of Western Europe
9.3.2.13.1 Rest of Western Europe BRIC Diagnostic Imaging Equipment Market Estimates and Forecasts, by Modality (2020-2032) (USD Billion)
9.3.2.13.2 Rest of Western Europe BRIC Diagnostic Imaging Equipment Market Estimates and Forecasts, by End User (2020-2032) (USD Billion)
9.4 Asia Pacific
9.4.1 Trends Analysis
9.4.2 Asia Pacific BRIC Diagnostic Imaging Equipment Market Estimates and Forecasts, by Country (2020-2032) (USD Billion)
9.4.3 Asia Pacific BRIC Diagnostic Imaging Equipment Market Estimates and Forecasts, by Modality (2020-2032) (USD Billion)
9.4.4 Asia Pacific BRIC Diagnostic Imaging Equipment Market Estimates and Forecasts, by End User (2020-2032) (USD Billion)
9.4.5 China
9.4.5.1 China BRIC Diagnostic Imaging Equipment Market Estimates and Forecasts, by Modality (2020-2032) (USD Billion)
9.4.5.2 China BRIC Diagnostic Imaging Equipment Market Estimates and Forecasts, by End User (2020-2032) (USD Billion)
9.4.6 India
9.4.5.1 India BRIC Diagnostic Imaging Equipment Market Estimates and Forecasts, by Modality (2020-2032) (USD Billion)
9.4.5.2 India BRIC Diagnostic Imaging Equipment Market Estimates and Forecasts, by End User (2020-2032) (USD Billion)
9.4.5 Japan
9.4.5.1 Japan BRIC Diagnostic Imaging Equipment Market Estimates and Forecasts, by Modality (2020-2032) (USD Billion)
9.4.5.2 Japan BRIC Diagnostic Imaging Equipment Market Estimates and Forecasts, by End User (2020-2032) (USD Billion)
9.4.6 South Korea
9.4.6.1 South Korea BRIC Diagnostic Imaging Equipment Market Estimates and Forecasts, by Modality (2020-2032) (USD Billion)
9.4.6.2 South Korea BRIC Diagnostic Imaging Equipment Market Estimates and Forecasts, by End User (2020-2032) (USD Billion)
9.4.7 Vietnam
9.4.7.1 Vietnam BRIC Diagnostic Imaging Equipment Market Estimates and Forecasts, by Modality (2020-2032) (USD Billion)
9.2.7.2 Vietnam BRIC Diagnostic Imaging Equipment Market Estimates and Forecasts, by End User (2020-2032) (USD Billion)
9.4.8 Singapore
9.4.8.1 Singapore BRIC Diagnostic Imaging Equipment Market Estimates and Forecasts, by Modality (2020-2032) (USD Billion)
9.4.8.2 Singapore BRIC Diagnostic Imaging Equipment Market Estimates and Forecasts, by End User (2020-2032) (USD Billion)
9.4.9 Australia
9.4.9.1 Australia BRIC Diagnostic Imaging Equipment Market Estimates and Forecasts, by Modality (2020-2032) (USD Billion)
9.4.9.2 Australia BRIC Diagnostic Imaging Equipment Market Estimates and Forecasts, by End User (2020-2032) (USD Billion)
9.4.10 Rest of Asia Pacific
9.4.10.1 Rest of Asia Pacific BRIC Diagnostic Imaging Equipment Market Estimates and Forecasts, by Modality (2020-2032) (USD Billion)
9.4.10.2 Rest of Asia Pacific BRIC Diagnostic Imaging Equipment Market Estimates and Forecasts, by End User (2020-2032) (USD Billion)
9.5 Middle East and Africa
9.5.1 Middle East
9.5.1.1 Trends Analysis
9.5.1.2 Middle East BRIC Diagnostic Imaging Equipment Market Estimates and Forecasts, by Country (2020-2032) (USD Billion)
9.5.1.3 Middle East BRIC Diagnostic Imaging Equipment Market Estimates and Forecasts, by Modality (2020-2032) (USD Billion)
9.5.1.4 Middle East BRIC Diagnostic Imaging Equipment Market Estimates and Forecasts, by End User (2020-2032) (USD Billion)
9.5.1.5 UAE
9.5.1.5.1 UAE BRIC Diagnostic Imaging Equipment Market Estimates and Forecasts, by Modality (2020-2032) (USD Billion)
9.5.1.5.2 UAE BRIC Diagnostic Imaging Equipment Market Estimates and Forecasts, by End User (2020-2032) (USD Billion)
9.5.1.6 Egypt
9.5.1.6.1 Egypt BRIC Diagnostic Imaging Equipment Market Estimates and Forecasts, by Modality (2020-2032) (USD Billion)
9.5.1.6.2 Egypt BRIC Diagnostic Imaging Equipment Market Estimates and Forecasts, by End User (2020-2032) (USD Billion)
9.5.1.7 Saudi Arabia
9.5.1.7.1 Saudi Arabia BRIC Diagnostic Imaging Equipment Market Estimates and Forecasts, by Modality (2020-2032) (USD Billion)
9.5.1.7.2 Saudi Arabia BRIC Diagnostic Imaging Equipment Market Estimates and Forecasts, by End User (2020-2032) (USD Billion)
9.5.1.8 Qatar
9.5.1.8.1 Qatar BRIC Diagnostic Imaging Equipment Market Estimates and Forecasts, by Modality (2020-2032) (USD Billion)
9.5.1.8.2 Qatar BRIC Diagnostic Imaging Equipment Market Estimates and Forecasts, by End User (2020-2032) (USD Billion)
9.5.1.9 Rest of Middle East
9.5.1.9.1 Rest of Middle East BRIC Diagnostic Imaging Equipment Market Estimates and Forecasts, by Modality (2020-2032) (USD Billion)
9.5.1.9.2 Rest of Middle East BRIC Diagnostic Imaging Equipment Market Estimates and Forecasts, by End User (2020-2032) (USD Billion)
9.5.2 Africa
9.5.2.1 Trends Analysis
9.5.2.2 Africa BRIC Diagnostic Imaging Equipment Market Estimates and Forecasts, by Country (2020-2032) (USD Billion)
9.5.2.3 Africa BRIC Diagnostic Imaging Equipment Market Estimates and Forecasts, by Modality (2020-2032) (USD Billion)
9.5.2.4 Africa BRIC Diagnostic Imaging Equipment Market Estimates and Forecasts, by End User (2020-2032) (USD Billion)
9.5.2.5 South Africa
9.5.2.5.1 South Africa BRIC Diagnostic Imaging Equipment Market Estimates and Forecasts, by Modality (2020-2032) (USD Billion)
9.5.2.5.2 South Africa BRIC Diagnostic Imaging Equipment Market Estimates and Forecasts, by End User (2020-2032) (USD Billion)
9.5.2.6 Nigeria
9.5.2.6.1 Nigeria BRIC Diagnostic Imaging Equipment Market Estimates and Forecasts, by Modality (2020-2032) (USD Billion)
9.5.2.6.2 Nigeria BRIC Diagnostic Imaging Equipment Market Estimates and Forecasts, by End User (2020-2032) (USD Billion)
9.6 Latin America
9.6.1 Trends Analysis
9.6.2 Latin America BRIC Diagnostic Imaging Equipment Market Estimates and Forecasts, by Country (2020-2032) (USD Billion)
9.6.3 Latin America BRIC Diagnostic Imaging Equipment Market Estimates and Forecasts, by Modality (2020-2032) (USD Billion)
9.6.4 Latin America BRIC Diagnostic Imaging Equipment Market Estimates and Forecasts, by End User (2020-2032) (USD Billion)
9.6.5 Brazil
9.6.5.1 Brazil BRIC Diagnostic Imaging Equipment Market Estimates and Forecasts, by Modality (2020-2032) (USD Billion)
9.6.5.2 Brazil BRIC Diagnostic Imaging Equipment Market Estimates and Forecasts, by End User (2020-2032) (USD Billion)
9.6.6 Argentina
9.6.6.1 Argentina BRIC Diagnostic Imaging Equipment Market Estimates and Forecasts, by Modality (2020-2032) (USD Billion)
9.6.6.2 Argentina BRIC Diagnostic Imaging Equipment Market Estimates and Forecasts, by End User (2020-2032) (USD Billion)
9.6.7 Colombia
9.6.7.1 Colombia BRIC Diagnostic Imaging Equipment Market Estimates and Forecasts, by Modality (2020-2032) (USD Billion)
9.6.7.2 Colombia BRIC Diagnostic Imaging Equipment Market Estimates and Forecasts, by End User (2020-2032) (USD Billion)
9.6.8 Rest of Latin America
9.6.8.1 Rest of Latin America BRIC Diagnostic Imaging Equipment Market Estimates and Forecasts, by Modality (2020-2032) (USD Billion)
9.6.8.2 Rest of Latin America BRIC Diagnostic Imaging Equipment Market Estimates and Forecasts, by End User (2020-2032) (USD Billion)
10. Company Profiles
10.1 GE Healthcare
10.1.1 Company Overview
10.1.2 Financial
10.1.3 Products/ Services Offered
10.1.4 SWOT Analysis
10.2 Siemens Healthineers
10.2.1 Company Overview
10.2.2 Financial
10.2.3 Products/ Services Offered
10.2.4 SWOT Analysis
10.3 Koninklijke Philips N.V.
10.3.1 Company Overview
10.3.2 Financial
10.3.3 Products/ Services Offered
10.3.4 SWOT Analysis
10.4 Canon Medical Systems Corporation
10.4.1 Company Overview
10.4.2 Financial
10.4.3 Products/ Services Offered
10.4.4 SWOT Analysis
10.5 Carestream Health, Inc.
10.5.1 Company Overview
10.5.2 Financial
10.5.3 Products/ Services Offered
10.5.4 SWOT Analysis
10.6 Hologic, Inc.
10.6.1 Company Overview
10.6.2 Financial
10.6.3 Products/ Services Offered
10.6.4 SWOT Analysis
10.7 Hitachi, Ltd.
10.7.1 Company Overview
10.7.2 Financial
10.7.3 Products/ Services Offered
10.7.4 SWOT Analysis
10.8 Allengers
10.8.1 Company Overview
10.8.2 Financial
10.8.3 Products/ Services Offered
10.8.4 SWOT Analysis
10.9 CURA Healthcare
10.9.1 Company Overview
10.9.2 Financial
10.9.3 Products/ Services Offered
10.9.4 SWOT Analysis
10.10 Neusoft Corporation
10.10.1 Company Overview
10.10.2 Financial
10.10.3 Products/ Services Offered
10.10.4 SWOT Analysis
11. Use Cases and Best Practices
12. Conclusion
An accurate research report requires proper strategizing as well as implementation. There are multiple factors involved in the completion of good and accurate research report and selecting the best methodology to compete the research is the toughest part. Since the research reports we provide play a crucial role in any company’s decision-making process, therefore we at SNS Insider always believe that we should choose the best method which gives us results closer to reality. This allows us to reach at a stage wherein we can provide our clients best and accurate investment to output ratio.
Each report that we prepare takes a timeframe of 350-400 business hours for production. Starting from the selection of titles through a couple of in-depth brain storming session to the final QC process before uploading our titles on our website we dedicate around 350 working hours. The titles are selected based on their current market cap and the foreseen CAGR and growth.
The 5 steps process:
Step 1: Secondary Research:
Secondary Research or Desk Research is as the name suggests is a research process wherein, we collect data through the readily available information. In this process we use various paid and unpaid databases which our team has access to and gather data through the same. This includes examining of listed companies’ annual reports, Journals, SEC filling etc. Apart from this our team has access to various associations across the globe across different industries. Lastly, we have exchange relationships with various university as well as individual libraries.

Step 2: Primary Research
When we talk about primary research, it is a type of study in which the researchers collect relevant data samples directly, rather than relying on previously collected data. This type of research is focused on gaining content specific facts that can be sued to solve specific problems. Since the collected data is fresh and first hand therefore it makes the study more accurate and genuine.
We at SNS Insider have divided Primary Research into 2 parts.
Part 1 wherein we interview the KOLs of major players as well as the upcoming ones across various geographic regions. This allows us to have their view over the market scenario and acts as an important tool to come closer to the accurate market numbers. As many as 45 paid and unpaid primary interviews are taken from both the demand and supply side of the industry to make sure we land at an accurate judgement and analysis of the market.
This step involves the triangulation of data wherein our team analyses the interview transcripts, online survey responses and observation of on filed participants. The below mentioned chart should give a better understanding of the part 1 of the primary interview.

Part 2: In this part of primary research the data collected via secondary research and the part 1 of the primary research is validated with the interviews from individual consultants and subject matter experts.
Consultants are those set of people who have at least 12 years of experience and expertise within the industry whereas Subject Matter Experts are those with at least 15 years of experience behind their back within the same space. The data with the help of two main processes i.e., FGDs (Focused Group Discussions) and IDs (Individual Discussions). This gives us a 3rd party nonbiased primary view of the market scenario making it a more dependable one while collation of the data pointers.
Step 3: Data Bank Validation
Once all the information is collected via primary and secondary sources, we run that information for data validation. At our intelligence centre our research heads track a lot of information related to the market which includes the quarterly reports, the daily stock prices, and other relevant information. Our data bank server gets updated every fortnight and that is how the information which we collected using our primary and secondary information is revalidated in real time.

Step 4: QA/QC Process
After all the data collection and validation our team does a final level of quality check and quality assurance to get rid of any unwanted or undesired mistakes. This might include but not limited to getting rid of the any typos, duplication of numbers or missing of any important information. The people involved in this process include technical content writers, research heads and graphics people. Once this process is completed the title gets uploader on our platform for our clients to read it.
Step 5: Final QC/QA Process:
This is the last process and comes when the client has ordered the study. In this process a final QA/QC is done before the study is emailed to the client. Since we believe in giving our clients a good experience of our research studies, therefore, to make sure that we do not lack at our end in any way humanly possible we do a final round of quality check and then dispatch the study to the client.
Key Segments
By Modality
X-ray Imaging Systems
By Technology
By Portability
Computed Tomography (CT) Scanners
By Technology
Conventional CT Market
Ultrasound Systems
By Technology
Magnetic Resonance Imaging (MRI) Systems
By Architecture
By Field Strength
Nuclear Imaging Systems
SPECT Systems
Hybrid PET Systems
Mammography Systems
By End User
Hospitals
Diagnostic Imaging Centers
Others
Request for Segment Customization as per your Business Requirement: Segment Customization Request
Regional Coverage:
North America
US
Canada
Mexico
Europe
Eastern Europe
Poland
Romania
Hungary
Turkey
Rest of Eastern Europe
Western Europe
Germany
France
UK
Italy
Spain
Netherlands
Switzerland
Austria
Rest of Western Europe
Asia Pacific
China
India
Japan
South Korea
Vietnam
Singapore
Australia
Rest of Asia Pacific
Middle East & Africa
Middle East
UAE
Egypt
Saudi Arabia
Qatar
Rest of Middle East
Africa
Nigeria
South Africa
Rest of Africa
Latin America
Brazil
Argentina
Colombia
Rest of Latin America
Request for Country Level Research Report: Country Level Customization Request
Available Customization
With the given market data, SNS Insider offers customization as per the company’s specific needs. The following customization options are available for the report:
Detailed Volume Analysis
Criss-Cross segment analysis (e.g. Product X Application)
Competitive Product Benchmarking
Geographic Analysis
Additional countries in any of the regions
Customized Data Representation
Detailed analysis and profiling of additional market players
The Microneedle Drug Delivery Systems Market Size was USD 6.1 billion in 2023, expected to reach USD 11.6 billion by 2032, growing at a CAGR of 7.4%.
The Biohacking Market size was valued at USD 21.12 billion in 2023 and is expected to reach USD 85.78 billion by 2032 and grow at a CAGR of 16.86%.
The Single-use Bioprocessing Market size was USD 26.8 billion in 2023 and is expected to reach USD 100.9 billion by 2032 at a CAGR of 15.9%.
The Nucleic Acid Amplification Testing Market size was USD 7.36 billion in 2023 and is projected to reach USD 20.62 billion by 2032, growing at a 12.16% CAGR.
Mental Health Market Size was valued at USD 415.7 Billion in 2023 and is expected to reach USD 592.6 Billion by 2032, growing at a CAGR of 4.04% over the forecast period 2024-2032.
The Pharmaceutical Contract Manufacturing Market size was USD 161.76 billion in 2023, projected to hit USD 300.34 billion by 2032, growing at 7.15% CAGR.

Hi! Click one of our member below to chat on Phone
© 2025 All Rights Reserved by SNS Insider Pvt Ltd


