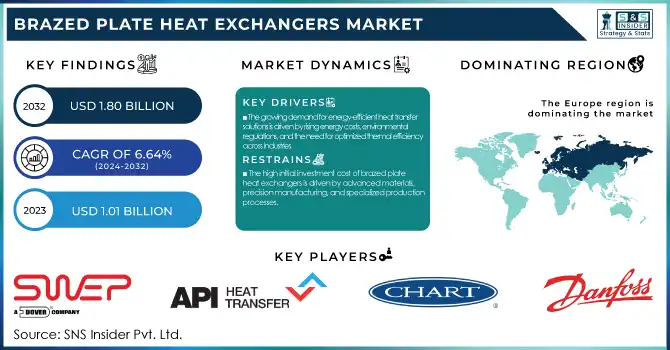
The Brazed Plate Heat Exchangers Market Size was esteemed at USD 1.01 billion in 2023 and is supposed to arrive at USD 1.80 billion by 2032 with a growing CAGR of 6.64% over the forecast period 2024-2032. The report offers a unique perspective on the Brazed Plate Heat Exchangers Market by analyzing production output and capacity utilization trends across key regions, highlighting efficiency benchmarks. It provides in-depth maintenance and downtime metrics, offering insights into operational reliability. Additionally, the study tracks technological advancements and adoption rates regionally, showcasing innovation trends. Export-import trade statistics reveal global trade dynamics, identifying key exporting and importing nations. Furthermore, the report includes sustainability trends, material innovations, and regulatory impacts, making it a comprehensive industry outlook beyond conventional market metrics.
To Get more information on Brazed Plate Heat Exchangers Market - Request Free Sample Report
Drivers
The growing demand for energy-efficient heat transfer solutions is driven by rising energy costs, environmental regulations, and the need for optimized thermal efficiency across industries.
The Brazed Plate Heat Exchangers Market is experiencing significant growth, driven by the increasing demand for energy-efficient heat transfer solutions across various industries. As energy prices soar and environmental regulations tighten, industries are focusing on thermal efficiency to bring down operating costs and carbon emissions. With compact designs, high efficiencies in heat transfer, and lower maintenance, brazed plate heat exchangers are ideal for HVAC, refrigeration, power generation, and industrial applications. As a result, their adoption is expected to witness a considerable increase owing to their capacity to maximize electricity efficiencies in renewable energy solutions, district heating, and cooling systems for data centers, as per the market trends. Also, technological advancements, such as improved brazing techniques and corrosion-resistant materials, are improving their longevity and performance. The drive toward more sustainable and green energy initiatives is also fueling market growth and is causing manufacturers and end-users around the globe to focus on energy-efficient heat transfer solutions.
Restraint
The high initial investment cost of brazed plate heat exchangers is driven by advanced materials, precision manufacturing, and specialized production processes.
The high initial investment cost of brazed plate heat exchangers (BPHEs) is a significant challenge for market growth. Must-have materials like stainless steel melt and copper make them longer-lasting and more efficient, but they also add to the overhead cost of designing these heat exchangers. And advanced manufacturing methods like precision brazing and automation add to the costs. BPHEs are more expensive than traditional heat exchangers due to additional capital expenditures associated with specialized equipment and a highly trained workforce needed for manufacturing. The cost of implementation is a major stumbling block, especially with small and medium-sized enterprises (SMEs) with their budget limits. Furthermore, for larger-scale heat transfer requirements, when considering capital and operating costs, it may be less expensive (in the long-run) to utilize alternative technologies like shell-and-tube heat exchangers. Yet, despite the high initial cost, BPHEs demonstrate long-term energy efficiency, lower maintenance costs, and space management ability, which makes them a favorable selection for multiple industrial applications.
Opportunities
In industrial applications, advancements in brazing techniques and corrosion-resistant materials enhance durability, efficiency, and performance of brazed plate heat exchangers.
Technological advancements in brazed plate heat exchangers focus on enhancing performance, durability, and efficiency. Advanced brazing techniques, including vacuum and controlled atmosphere brazing, can provide improved joint strength, and reduced potential for leakage, as well as increased thermal conductivity. Furthermore, advancements in corrosion-resistant materials, such as stainless-steel alloys and specialized coatings, have improved the longevity of heat exchangers, allowing them to meet the demands of more aggressive applications like chemical processing and marine environments. Advancements in microchannel configurations and improved surface modifications have also led to increased heat exchange efficiency, resulting in decreased energy usage and operation expenses. Furthermore, manufacturers are incorporating intelligent monitoring technologies to ensure real-time performance tracking and predictive maintenance to reduce downtime. These innovations meet the increasing need for energy-efficient, compact solutions in HVAC, refrigeration, and power generation markets. With industries focusing on sustainability day by day, further advancements in the field of material science and brazing technology should support the growth of the market.
Challenges
Stringent environmental regulations require manufacturers to enhance energy efficiency, reduce emissions, and comply with evolving standards, increasing production costs and operational complexity.
Stringent environmental regulations pose a significant challenge for the Brazed Plate Heat Exchangers Market, as manufacturers must comply with strict emission norms and energy efficiency standards. Governments and regulatory bodies governments and regulatory bodies are implementing policies to minimize carbon emissions and increase energy efficiency in industrial processes. These regulations impose the use of environmentally friendly materials, enhance thermal efficiency and restrict refrigerant leakage for heat exchanger manufacturers, resulting in escalated production costs. Also, each regional standard that has to be complied with (US: ASME, Europe: PED, etc.; additional: ISO 14001) makes the global business all the more complex. Affordability becomes a challenge because manufacturers are compelled to invest in R&D to improve efficiency and remain compliant. Additionally, constant changes in environmental legislation mean that firms must continually adapt, causing supply chain disruption and longer product development times. However, companies willing to integrate sustainable technologies and adapt to changing regulations stand to benefit from the rapidly growing market for energy-efficient products and services.
By Product
The Multi Circuit segment dominated with a market share of over 68% in 2023, due to its superior efficiency and versatility in handling multiple fluid streams simultaneously. More complex industrial applications may benefit from high performance heat exchangers built for control of temperature in your case. Their extensive use in the industrial applications like HVAC, refrigeration, power generation, and chemical processing industries enhances their position in the marketplace. Based on the number of circuits, their configuration can meet diverse operational needs, transmitting high heat in the system with the least energy in the system. Increase in focus on cost reduction and sustainability in various industries has led to manufacturers preferring multi-circuit brazed plate heat exchangers, owing to their potential to reduce energy loss and enhance output from the systems. Consequently, this sector still dominates the market, fulfilling distinct industrial and commercial heating and cooling requirements.
By Application
The HVAC-R segment dominated with a market share of over 32% in 2023, during the very year due to the important nature of such claims serving applications like heating, ventilation, air conditioning, and refrigeration. Air also represents heating and cooling in the HVAC-R systems, and Air -to-Heat or Heat-to-Air is the heat exchangers made to transfer energy from air to environmental systems as such. Growing emphasis on sustainability and energy scrutiny has led to the implementation of strict regulatory guidelines, like efficiency standards from the U.S. Department of Energy (DOE) and the EU’s F-Gas Regulation, fueling the demand for modernized heat transfer solutions. Moreover, growing adoption of heat pumps, district heating, and commercial refrigeration systems further bolstered the market dominance. As urbanization and climate control requirements grow, so too does the global demand for brazed plate heat exchangers in the HVAC-R sector.
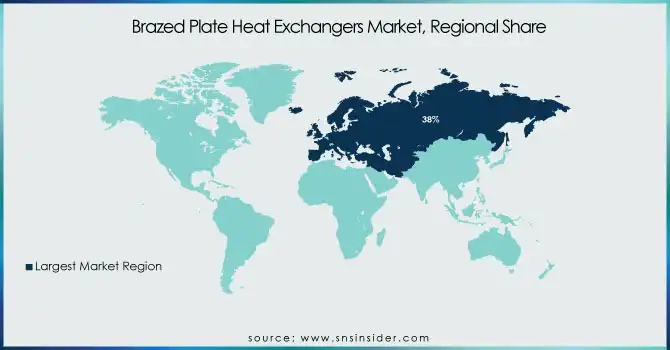
Europe region dominates with a market share of over 38% in 2023, owing to the stringency of energy-efficient regulations and a robust industrial framework. Coherent emission control initiatives (for example, the Energy Efficiency Directive in EU) consolidating pressure on heat exchangers (high performance) applications in process and manufacturing (HVAC, refrigeration and other applications) in the region. The increasing emphasis on renewable energy sources, such as solar thermal and geothermal heating, is also a growth factor for brazed plate heat exchangers. It is expected that countries like Germany, France, and the United Kingdom further boost the innovative technology adoption and Sustainability projects, which will positively impact the growth of the market. As global service providers, the growing focus on energy conservation and the presence of major players across Europe make this a key market; there are regular investments towards energy conservation & foam products, as much as spray foam, and eco-friendly solutions for efficient heat exchange.
Asia-Pacific is the fastest-growing region in the Brazed Plate Heat Exchangers Market, due to rapid industrialization, urbanization, and infrastructure development in the region. The epitome of urbanization can be witnessed in Implementing economies like China, India, and Japan, which are experiencing a boom in demand for HVAC systems on account of increasing temperatures, construction activities, and commercialization. The adoption of energy-efficient heat transfer equipment is also being fueled by the growing requirements from power generation, chemical, and petrochemical industries. Market growth is significantly propelled by government initiatives promoting energy efficiency and the adoption of renewable energy sources. Global players are enticed here by the affordability of manufacturing and the presence of raw materials, resulting in enhanced investment and technology transfer. The need for compact and energy-efficient heat exchangers will drive this growth as industries continue to expand.
Get Customized Report as per Your Business Requirement - Enquiry Now
Some of the major key players in the Brazed Plate Heat Exchangers Market
SWEP International AB (Brazed Plate Heat Exchangers for HVAC, Refrigeration, and Industrial Applications)
API Heat Transfer (Industrial Brazed Plate Heat Exchangers for Energy and Process Industries)
Chart Industries, Inc. (Brazed Plate Heat Exchangers for Cryogenic and LNG Applications)
Danfoss (Compact Brazed Plate Heat Exchangers for HVAC, Refrigeration, and District Heating)
Hisaka Works, Ltd. (Stainless Steel Brazed Plate Heat Exchangers for Chemical and Food Processing)
Kelvion Holding GmbH (Customized Brazed Plate Heat Exchangers for Industrial and Energy Applications)
AIC (Brazed Plate Heat Exchangers for HVAC, Marine, and Hydronic Heating Systems)
Xylem Inc. (Brazed Plate Heat Exchangers for Water and Wastewater Treatment Systems)
Alfa Laval (High-Efficiency Brazed Plate Heat Exchangers for Industrial, Food, and Beverage Applications)
HRS Heat Exchangers (Brazed Plate Heat Exchangers for Thermal Processing in Food and Chemical Industries)
Kaori Heat Treatment Co., Ltd. (Brazed Plate Heat Exchangers for Renewable Energy and HVAC)
Funke Wärmeaustauscher Apparatebau GmbH (Brazed Plate Heat Exchangers for Oil Cooling and Process Engineering)
Hydac International GmbH (Brazed Plate Heat Exchangers for Hydraulic and Industrial Cooling Systems)
Güntner GmbH & Co. KG (Brazed Plate Heat Exchangers for Air Conditioning and Refrigeration)
Onda S.p.A. (Brazed Plate Heat Exchangers for HVAC, Cooling, and Process Industries)
Mueller Industries, Inc. (Brazed Plate Heat Exchangers for Residential and Commercial Heating Systems)
Boyd Corporation (Brazed Plate Heat Exchangers for Electronics and Data Center Cooling)
SWEP North America (Energy-Efficient Brazed Plate Heat Exchangers for Heat Recovery Applications)
Sondex A/S (SPX FLOW) (Brazed Plate Heat Exchangers for Marine, Chemical, and Power Applications)
Brazetek (Standard and Custom Brazed Plate Heat Exchangers for HVAC and Industrial Processes)
Suppliers for (Reliable BPHEs for cooling, heating, and refrigeration systems) on Brazed Plate Heat Exchangers Market
Alfa Laval
Kelvion Holding GmbH
SWEP International AB
Danfoss A/S
Xylem Inc.
API Heat Transfer
Chart Industries
Hisaka Works, Ltd.
Kaori Heat Treatment Co., Ltd.
Paul Mueller Company
RECENT DEVELOPMENT
In July 2024: SWEP, a leading global supplier of brazed plate heat exchangers (BPHEs) and a part of Dover (NYSE: DOV), announced the launch of the SWEP 190 series. These heat exchangers are designed to optimize performance with low-global warming potential (GWP) and natural refrigerants.
| Report Attributes | Details |
|---|---|
| Market Size in 2023 | USD 1.01 Billion |
| Market Size by 2032 | USD 11.80 Billion |
| CAGR | CAGR of 6.64% From 2024 to 2032 |
| Base Year | 2023 |
| Forecast Period | 2024-2032 |
| Historical Data | 2020-2022 |
| Report Scope & Coverage | Market Size, Segments Analysis, Competitive Landscape, Regional Analysis, DROC & SWOT Analysis, Forecast Outlook |
| Key Segments | • By Product (Single Circuit, Multi Circuit) • By Application (HVAC-R, Chemical & Petrochemical, Food & Beverage, Power Generation, Heavy Industry, Others) |
| Regional Analysis/Coverage | North America (US, Canada, Mexico), Europe (Eastern Europe [Poland, Romania, Hungary, Turkey, Rest of Eastern Europe] Western Europe] Germany, France, UK, Italy, Spain, Netherlands, Switzerland, Austria, Rest of Western Europe]), Asia Pacific (China, India, Japan, South Korea, Vietnam, Singapore, Australia, Rest of Asia Pacific), Middle East & Africa (Middle East [UAE, Egypt, Saudi Arabia, Qatar, Rest of Middle East], Africa [Nigeria, South Africa, Rest of Africa], Latin America (Brazil, Argentina, Colombia, Rest of Latin America) |
| Company Profiles | SWEP International AB, API Heat Transfer, Chart Industries, Inc., Danfoss, Hisaka Works, Ltd., Kelvion Holding GmbH, AIC, Xylem Inc., Alfa Laval, HRS Heat Exchangers, Kaori Heat Treatment Co., Ltd., Funke Wärmeaustauscher Apparatebau GmbH, Hydac International GmbH, Güntner GmbH & Co. KG, Onda S.p.A., Mueller Industries, Inc., Boyd Corporation, SWEP North America, Sondex A/S (SPX FLOW), Brazetek |
Ans: The Brazed Plate Heat Exchangers Market is expected to grow at a CAGR of 6.64% during 2024-2032.
Ans: The Brazed Plate Heat Exchangers Market was USD 1.01 billion in 2023 and is expected to reach USD 1.80 billion by 2032.
Ans: The growing demand for energy-efficient heat transfer solutions is driven by rising energy costs, environmental regulations, and the need for optimized thermal efficiency across industries.
Ans: The “Multi Circuit” segment dominated the Brazed Plate Heat Exchangers Market.
Ans: Europe dominated the Brazed Plate Heat Exchangers Market in 2023
Table of Contents:
1. Introduction
1.1 Market Definition
1.2 Scope (Inclusion and Exclusions)
1.3 Research Assumptions
2. Executive Summary
2.1 Market Overview
2.2 Regional Synopsis
2.3 Competitive Summary
3. Research Methodology
3.1 Top-Down Approach
3.2 Bottom-up Approach
3.3. Data Validation
3.4 Primary Interviews
4. Market Dynamics Impact Analysis
4.1 Market Driving Factors Analysis
4.1.2 Drivers
4.1.2 Restraints
4.1.3 Opportunities
4.1.4 Challenges
4.2 PESTLE Analysis
4.3 Porter’s Five Forces Model
5. Statistical Insights and Trends Reporting
5.1 Market Production Output, by Region (2020-2023)
5.2 Capacity Utilization Rates, by Region (2020-2023)
5.3 Maintenance and Downtime Metrics for Brazed Plate Heat Exchangers
5.4 Technological Advancements and Adoption Rates, by Region
5.5 Export/Import Trade Statistics, by Region (2023)
6. Competitive Landscape
6.1 List of Major Companies, By Region
6.2 Market Share Analysis, By Region
6.3 Product Benchmarking
6.3.1 Product specifications and features
6.3.2 Pricing
6.4 Strategic Initiatives
6.4.1 Marketing and promotional activities
6.4.2 Distribution and Supply Chain Strategies
6.4.3 Expansion plans and new product launches
6.4.4 Strategic partnerships and collaborations
6.5 Technological Advancements
6.6 Market Positioning and Branding
7. Brazed Plate Heat Exchangers Market Segmentation, By Product
7.1 Chapter Overview
7.2 Single Circuit
7.2.1 Single Circuit Market Trends Analysis (2020-2032)
7.2.2 Single Circuit Market Size Estimates and Forecasts to 2032 (USD Billion)
7.3 Multi Circuit
7.3.1 Multi Circuit Market Trends Analysis (2020-2032)
7.3.2 Multi Circuit Market Size Estimates and Forecasts to 2032 (USD Billion)
8. Brazed Plate Heat Exchangers Market Segmentation, By Application
8.1 Chapter Overview
8.2 HVAC-R
8.2.1 HVAC-R Market Trends Analysis (2020-2032)
8.2.2 HVAC-R Market Size Estimates and Forecasts to 2032 (USD Billion)
8.3 Chemical & Petrochemical
8.3.1 Chemical & Petrochemical Market Trends Analysis (2020-2032)
8.3.2 Chemical & Petrochemical Market Size Estimates and Forecasts to 2032 (USD Billion)
8.4 Food & Beverage
8.4.1 Food & Beverage Market Trends Analysis (2020-2032)
8.4.2 Food & Beverage Market Size Estimates and Forecasts to 2032 (USD Billion)
8.5 Power Generation
8.5.1 Power Generation Market Trends Analysis (2020-2032)
8.5.2 Power Generation Market Size Estimates and Forecasts to 2032 (USD Billion)
8.6 Heavy Industry
8.6.1 Heavy Industry Market Trends Analysis (2020-2032)
8.6.2 Heavy Industry Market Size Estimates and Forecasts to 2032 (USD Billion)
8.7 Others
8.7.1 Others Market Trends Analysis (2020-2032)
8.7.2 Others Market Size Estimates and Forecasts to 2032 (USD Billion)
9. Regional Analysis
9.1 Chapter Overview
9.2 North America
9.2.1 Trends Analysis
9.2.2 North America Brazed Plate Heat Exchangers Market Estimates and Forecasts, by Country (2020-2032) (USD Billion)
9.2.3 North America Brazed Plate Heat Exchangers Market Estimates and Forecasts, By Product (2020-2032) (USD Billion)
9.2.4 North America Brazed Plate Heat Exchangers Market Estimates and Forecasts, By Application (2020-2032) (USD Billion)
9.2.5 USA
9.2.5.1 USA Brazed Plate Heat Exchangers Market Estimates and Forecasts, By Product (2020-2032) (USD Billion)
9.2.5.2 USA Brazed Plate Heat Exchangers Market Estimates and Forecasts, By Application (2020-2032) (USD Billion)
9.2.6 Canada
9.2.6.1 Canada Brazed Plate Heat Exchangers Market Estimates and Forecasts, By Product (2020-2032) (USD Billion)
9.2.6.2 Canada Brazed Plate Heat Exchangers Market Estimates and Forecasts, By Application (2020-2032) (USD Billion)
9.2.7 Mexico
9.2.7.1 Mexico Brazed Plate Heat Exchangers Market Estimates and Forecasts, By Product (2020-2032) (USD Billion)
9.2.7.2 Mexico Brazed Plate Heat Exchangers Market Estimates and Forecasts, By Application (2020-2032) (USD Billion)
9.3 Europe
9.3.1 Eastern Europe
9.3.1.1 Trends Analysis
9.3.1.2 Eastern Europe Brazed Plate Heat Exchangers Market Estimates and Forecasts, by Country (2020-2032) (USD Billion)
9.3.1.3 Eastern Europe Brazed Plate Heat Exchangers Market Estimates and Forecasts, By Product (2020-2032) (USD Billion)
9.3.1.4 Eastern Europe Brazed Plate Heat Exchangers Market Estimates and Forecasts, By Application (2020-2032) (USD Billion)
9.3.1.5 Poland
9.3.1.5.1 Poland Brazed Plate Heat Exchangers Market Estimates and Forecasts, By Product (2020-2032) (USD Billion)
9.3.1.5.2 Poland Brazed Plate Heat Exchangers Market Estimates and Forecasts, By Application (2020-2032) (USD Billion)
9.3.1.6 Romania
9.3.1.6.1 Romania Brazed Plate Heat Exchangers Market Estimates and Forecasts, By Product (2020-2032) (USD Billion)
9.3.1.6.2 Romania Brazed Plate Heat Exchangers Market Estimates and Forecasts, By Application (2020-2032) (USD Billion)
9.3.1.7 Hungary
9.3.1.7.1 Hungary Brazed Plate Heat Exchangers Market Estimates and Forecasts, By Product (2020-2032) (USD Billion)
9.3.1.7.2 Hungary Brazed Plate Heat Exchangers Market Estimates and Forecasts, By Application (2020-2032) (USD Billion)
9.3.1.8 Turkey
9.3.1.8.1 Turkey Brazed Plate Heat Exchangers Market Estimates and Forecasts, By Product (2020-2032) (USD Billion)
9.3.1.8.2 Turkey Brazed Plate Heat Exchangers Market Estimates and Forecasts, By Application (2020-2032) (USD Billion)
9.3.1.9 Rest of Eastern Europe
9.3.1.9.1 Rest of Eastern Europe Brazed Plate Heat Exchangers Market Estimates and Forecasts, By Product (2020-2032) (USD Billion)
9.3.1.9.2 Rest of Eastern Europe Brazed Plate Heat Exchangers Market Estimates and Forecasts, By Application (2020-2032) (USD Billion)
9.3.2 Western Europe
9.3.2.1 Trends Analysis
9.3.2.2 Western Europe Brazed Plate Heat Exchangers Market Estimates and Forecasts, by Country (2020-2032) (USD Billion)
9.3.2.3 Western Europe Brazed Plate Heat Exchangers Market Estimates and Forecasts, By Product (2020-2032) (USD Billion)
9.3.2.4 Western Europe Brazed Plate Heat Exchangers Market Estimates and Forecasts, By Application (2020-2032) (USD Billion)
9.3.2.5 Germany
9.3.2.5.1 Germany Brazed Plate Heat Exchangers Market Estimates and Forecasts, By Product (2020-2032) (USD Billion)
9.3.2.5.2 Germany Brazed Plate Heat Exchangers Market Estimates and Forecasts, By Application (2020-2032) (USD Billion)
9.3.2.6 France
9.3.2.6.1 France Brazed Plate Heat Exchangers Market Estimates and Forecasts, By Product (2020-2032) (USD Billion)
9.3.2.6.2 France Brazed Plate Heat Exchangers Market Estimates and Forecasts, By Application (2020-2032) (USD Billion)
9.3.2.7 UK
9.3.2.7.1 UK Brazed Plate Heat Exchangers Market Estimates and Forecasts, By Product (2020-2032) (USD Billion)
9.3.2.7.2 UK Brazed Plate Heat Exchangers Market Estimates and Forecasts, By Application (2020-2032) (USD Billion)
9.3.2.8 Italy
9.3.2.8.1 Italy Brazed Plate Heat Exchangers Market Estimates and Forecasts, By Product (2020-2032) (USD Billion)
9.3.2.8.2 Italy Brazed Plate Heat Exchangers Market Estimates and Forecasts, By Application (2020-2032) (USD Billion)
9.3.2.9 Spain
9.3.2.9.1 Spain Brazed Plate Heat Exchangers Market Estimates and Forecasts, By Product (2020-2032) (USD Billion)
9.3.2.9.2 Spain Brazed Plate Heat Exchangers Market Estimates and Forecasts, By Application (2020-2032) (USD Billion)
9.3.2.10 Netherlands
9.3.2.10.1 Netherlands Brazed Plate Heat Exchangers Market Estimates and Forecasts, By Product (2020-2032) (USD Billion)
9.3.2.10.2 Netherlands Brazed Plate Heat Exchangers Market Estimates and Forecasts, By Application (2020-2032) (USD Billion)
9.3.2.11 Switzerland
9.3.2.11.1 Switzerland Brazed Plate Heat Exchangers Market Estimates and Forecasts, By Product (2020-2032) (USD Billion)
9.3.2.11.2 Switzerland Brazed Plate Heat Exchangers Market Estimates and Forecasts, By Application (2020-2032) (USD Billion)
9.3.2.12 Austria
9.3.2.12.1 Austria Brazed Plate Heat Exchangers Market Estimates and Forecasts, By Product (2020-2032) (USD Billion)
9.3.2.12.2 Austria Brazed Plate Heat Exchangers Market Estimates and Forecasts, By Application (2020-2032) (USD Billion)
9.3.2.13 Rest of Western Europe
9.3.2.13.1 Rest of Western Europe Brazed Plate Heat Exchangers Market Estimates and Forecasts, By Product (2020-2032) (USD Billion)
9.3.2.13.2 Rest of Western Europe Brazed Plate Heat Exchangers Market Estimates and Forecasts, By Application (2020-2032) (USD Billion)
9.4 Asia Pacific
9.4.1 Trends Analysis
9.4.2 Asia Pacific Brazed Plate Heat Exchangers Market Estimates and Forecasts, by Country (2020-2032) (USD Billion)
9.4.3 Asia Pacific Brazed Plate Heat Exchangers Market Estimates and Forecasts, By Product (2020-2032) (USD Billion)
9.4.4 Asia Pacific Brazed Plate Heat Exchangers Market Estimates and Forecasts, By Application (2020-2032) (USD Billion)
9.4.5 China
9.4.5.1 China Brazed Plate Heat Exchangers Market Estimates and Forecasts, By Product (2020-2032) (USD Billion)
9.4.5.2 China Brazed Plate Heat Exchangers Market Estimates and Forecasts, By Application (2020-2032) (USD Billion)
9.4.6 India
9.4.5.1 India Brazed Plate Heat Exchangers Market Estimates and Forecasts, By Product (2020-2032) (USD Billion)
9.4.5.2 India Brazed Plate Heat Exchangers Market Estimates and Forecasts, By Application (2020-2032) (USD Billion)
9.4.5 Japan
9.4.5.1 Japan Brazed Plate Heat Exchangers Market Estimates and Forecasts, By Product (2020-2032) (USD Billion)
9.4.5.2 Japan Brazed Plate Heat Exchangers Market Estimates and Forecasts, By Application (2020-2032) (USD Billion)
9.4.6 South Korea
9.4.6.1 South Korea Brazed Plate Heat Exchangers Market Estimates and Forecasts, By Product (2020-2032) (USD Billion)
9.4.6.2 South Korea Brazed Plate Heat Exchangers Market Estimates and Forecasts, By Application (2020-2032) (USD Billion)
9.4.7 Vietnam
9.4.7.1 Vietnam Brazed Plate Heat Exchangers Market Estimates and Forecasts, By Product (2020-2032) (USD Billion)
9.2.7.2 Vietnam Brazed Plate Heat Exchangers Market Estimates and Forecasts, By Application (2020-2032) (USD Billion)
9.4.8 Singapore
9.4.8.1 Singapore Brazed Plate Heat Exchangers Market Estimates and Forecasts, By Product (2020-2032) (USD Billion)
9.4.8.2 Singapore Brazed Plate Heat Exchangers Market Estimates and Forecasts, By Application (2020-2032) (USD Billion)
9.4.9 Australia
9.4.9.1 Australia Brazed Plate Heat Exchangers Market Estimates and Forecasts, By Product (2020-2032) (USD Billion)
9.4.9.2 Australia Brazed Plate Heat Exchangers Market Estimates and Forecasts, By Application (2020-2032) (USD Billion)
9.4.10 Rest of Asia Pacific
9.4.10.1 Rest of Asia Pacific Brazed Plate Heat Exchangers Market Estimates and Forecasts, By Product (2020-2032) (USD Billion)
9.4.10.2 Rest of Asia Pacific Brazed Plate Heat Exchangers Market Estimates and Forecasts, By Application (2020-2032) (USD Billion)
9.5 Middle East and Africa
9.5.1 Middle East
9.5.1.1 Trends Analysis
9.5.1.2 Middle East Brazed Plate Heat Exchangers Market Estimates and Forecasts, by Country (2020-2032) (USD Billion)
9.5.1.3 Middle East Brazed Plate Heat Exchangers Market Estimates and Forecasts, By Product (2020-2032) (USD Billion)
9.5.1.4 Middle East Brazed Plate Heat Exchangers Market Estimates and Forecasts, By Application (2020-2032) (USD Billion)
9.5.1.5 UAE
9.5.1.5.1 UAE Brazed Plate Heat Exchangers Market Estimates and Forecasts, By Product (2020-2032) (USD Billion)
9.5.1.5.2 UAE Brazed Plate Heat Exchangers Market Estimates and Forecasts, By Application (2020-2032) (USD Billion)
9.5.1.6 Egypt
9.5.1.6.1 Egypt Brazed Plate Heat Exchangers Market Estimates and Forecasts, By Product (2020-2032) (USD Billion)
9.5.1.6.2 Egypt Brazed Plate Heat Exchangers Market Estimates and Forecasts, By Application (2020-2032) (USD Billion)
9.5.1.7 Saudi Arabia
9.5.1.7.1 Saudi Arabia Brazed Plate Heat Exchangers Market Estimates and Forecasts, By Product (2020-2032) (USD Billion)
9.5.1.7.2 Saudi Arabia Brazed Plate Heat Exchangers Market Estimates and Forecasts, By Application (2020-2032) (USD Billion)
9.5.1.8 Qatar
9.5.1.8.1 Qatar Brazed Plate Heat Exchangers Market Estimates and Forecasts, By Product (2020-2032) (USD Billion)
9.5.1.8.2 Qatar Brazed Plate Heat Exchangers Market Estimates and Forecasts, By Application (2020-2032) (USD Billion)
9.5.1.9 Rest of Middle East
9.5.1.9.1 Rest of Middle East Brazed Plate Heat Exchangers Market Estimates and Forecasts, By Product (2020-2032) (USD Billion)
9.5.1.9.2 Rest of Middle East Brazed Plate Heat Exchangers Market Estimates and Forecasts, By Application (2020-2032) (USD Billion)
9.5.2 Africa
9.5.2.1 Trends Analysis
9.5.2.2 Africa Brazed Plate Heat Exchangers Market Estimates and Forecasts, by Country (2020-2032) (USD Billion)
9.5.2.3 Africa Brazed Plate Heat Exchangers Market Estimates and Forecasts, By Product (2020-2032) (USD Billion)
9.5.2.4 Africa Brazed Plate Heat Exchangers Market Estimates and Forecasts, By Application (2020-2032) (USD Billion)
9.5.2.5 South Africa
9.5.2.5.1 South Africa Brazed Plate Heat Exchangers Market Estimates and Forecasts, By Product (2020-2032) (USD Billion)
9.5.2.5.2 South Africa Brazed Plate Heat Exchangers Market Estimates and Forecasts, By Application (2020-2032) (USD Billion)
9.5.2.6 Nigeria
9.5.2.6.1 Nigeria Brazed Plate Heat Exchangers Market Estimates and Forecasts, By Product (2020-2032) (USD Billion)
9.5.2.6.2 Nigeria Brazed Plate Heat Exchangers Market Estimates and Forecasts, By Application (2020-2032) (USD Billion)
9.5.2.7 Rest of Africa
9.5.2.7.1 Rest of Africa Brazed Plate Heat Exchangers Market Estimates and Forecasts, By Product (2020-2032) (USD Billion)
9.5.2.7.2 Rest of Africa Brazed Plate Heat Exchangers Market Estimates and Forecasts, By Application (2020-2032) (USD Billion)
9.6 Latin America
9.6.1 Trends Analysis
9.6.2 Latin America Brazed Plate Heat Exchangers Market Estimates and Forecasts, by Country (2020-2032) (USD Billion)
9.6.3 Latin America Brazed Plate Heat Exchangers Market Estimates and Forecasts, By Product (2020-2032) (USD Billion)
9.6.4 Latin America Brazed Plate Heat Exchangers Market Estimates and Forecasts, By Application (2020-2032) (USD Billion)
9.6.5 Brazil
9.6.5.1 Brazil Brazed Plate Heat Exchangers Market Estimates and Forecasts, By Product (2020-2032) (USD Billion)
9.6.5.2 Brazil Brazed Plate Heat Exchangers Market Estimates and Forecasts, By Application (2020-2032) (USD Billion)
9.6.6 Argentina
9.6.6.1 Argentina Brazed Plate Heat Exchangers Market Estimates and Forecasts, By Product (2020-2032) (USD Billion)
9.6.6.2 Argentina Brazed Plate Heat Exchangers Market Estimates and Forecasts, By Application (2020-2032) (USD Billion)
9.6.7 Colombia
9.6.7.1 Colombia Brazed Plate Heat Exchangers Market Estimates and Forecasts, By Product (2020-2032) (USD Billion)
9.6.7.2 Colombia Brazed Plate Heat Exchangers Market Estimates and Forecasts, By Application (2020-2032) (USD Billion)
9.6.8 Rest of Latin America
9.6.8.1 Rest of Latin America Brazed Plate Heat Exchangers Market Estimates and Forecasts, By Product (2020-2032) (USD Billion)
9.6.8.2 Rest of Latin America Brazed Plate Heat Exchangers Market Estimates and Forecasts, By Application (2020-2032) (USD Billion)
10. Company Profiles
10.1 SWEP International AB
10.1.1 Company Overview
10.1.2 Financial
10.1.3 Products/ Services Offered
110.1.4 SWOT Analysis
10.2 API Heat Transfer
10.2.1 Company Overview
10.2.2 Financial
10.2.3 Products/ Services Offered
10.2.4 SWOT Analysis
10.3 Charts Industries, Inc.
10.3.1 Company Overview
10.3.2 Financial
10.3.3 Products/ Services Offered
10.3.4 SWOT Analysis
10.4 Danfoss
10.4.1 Company Overview
10.4.2 Financial
10.4.3 Products/ Services Offered
10.4.4 SWOT Analysis
10.5 Hisaka Works, Ltd.
10.5.1 Company Overview
10.5.2 Financial
10.5.3 Products/ Services Offered
10.5.4 SWOT Analysis
10.6 Kelvion Holding GmbH
10.6.1 Company Overview
10.6.2 Financial
10.6.3 Products/ Services Offered
10.6.4 SWOT Analysis
10.7 AIC
10.7.1 Company Overview
10.7.2 Financial
10.7.3 Products/ Services Offered
10.7.4 SWOT Analysis
10.8 Xylem Inc.
10.8.1 Company Overview
10.8.2 Financial
10.8.3 Products/ Services Offered
10.8.4 SWOT Analysis
10.9 Alfa Laval
10.9.1 Company Overview
10.9.2 Financial
10.9.3 Products/ Services Offered
10.9.4 SWOT Analysis
10.10 HRS Heat Exchangers
10.9.1 Company Overview
10.9.2 Financial
10.9.3 Products/ Services Offered
10.9.4 SWOT Analysis
11. Use Cases and Best Practices
12. Conclusion
An accurate research report requires proper strategizing as well as implementation. There are multiple factors involved in the completion of good and accurate research report and selecting the best methodology to compete the research is the toughest part. Since the research reports we provide play a crucial role in any company’s decision-making process, therefore we at SNS Insider always believe that we should choose the best method which gives us results closer to reality. This allows us to reach at a stage wherein we can provide our clients best and accurate investment to output ratio.
Each report that we prepare takes a timeframe of 350-400 business hours for production. Starting from the selection of titles through a couple of in-depth brain storming session to the final QC process before uploading our titles on our website we dedicate around 350 working hours. The titles are selected based on their current market cap and the foreseen CAGR and growth.
The 5 steps process:
Step 1: Secondary Research:
Secondary Research or Desk Research is as the name suggests is a research process wherein, we collect data through the readily available information. In this process we use various paid and unpaid databases which our team has access to and gather data through the same. This includes examining of listed companies’ annual reports, Journals, SEC filling etc. Apart from this our team has access to various associations across the globe across different industries. Lastly, we have exchange relationships with various university as well as individual libraries.

Step 2: Primary Research
When we talk about primary research, it is a type of study in which the researchers collect relevant data samples directly, rather than relying on previously collected data. This type of research is focused on gaining content specific facts that can be sued to solve specific problems. Since the collected data is fresh and first hand therefore it makes the study more accurate and genuine.
We at SNS Insider have divided Primary Research into 2 parts.
Part 1 wherein we interview the KOLs of major players as well as the upcoming ones across various geographic regions. This allows us to have their view over the market scenario and acts as an important tool to come closer to the accurate market numbers. As many as 45 paid and unpaid primary interviews are taken from both the demand and supply side of the industry to make sure we land at an accurate judgement and analysis of the market.
This step involves the triangulation of data wherein our team analyses the interview transcripts, online survey responses and observation of on filed participants. The below mentioned chart should give a better understanding of the part 1 of the primary interview.

Part 2: In this part of primary research the data collected via secondary research and the part 1 of the primary research is validated with the interviews from individual consultants and subject matter experts.
Consultants are those set of people who have at least 12 years of experience and expertise within the industry whereas Subject Matter Experts are those with at least 15 years of experience behind their back within the same space. The data with the help of two main processes i.e., FGDs (Focused Group Discussions) and IDs (Individual Discussions). This gives us a 3rd party nonbiased primary view of the market scenario making it a more dependable one while collation of the data pointers.
Step 3: Data Bank Validation
Once all the information is collected via primary and secondary sources, we run that information for data validation. At our intelligence centre our research heads track a lot of information related to the market which includes the quarterly reports, the daily stock prices, and other relevant information. Our data bank server gets updated every fortnight and that is how the information which we collected using our primary and secondary information is revalidated in real time.

Step 4: QA/QC Process
After all the data collection and validation our team does a final level of quality check and quality assurance to get rid of any unwanted or undesired mistakes. This might include but not limited to getting rid of the any typos, duplication of numbers or missing of any important information. The people involved in this process include technical content writers, research heads and graphics people. Once this process is completed the title gets uploader on our platform for our clients to read it.
Step 5: Final QC/QA Process:
This is the last process and comes when the client has ordered the study. In this process a final QA/QC is done before the study is emailed to the client. Since we believe in giving our clients a good experience of our research studies, therefore, to make sure that we do not lack at our end in any way humanly possible we do a final round of quality check and then dispatch the study to the client.
Key Segments:
By Product
Single Circuit
Multi Circuit
By Application
HVAC-R
Chemical & Petrochemical
Food & Beverage
Power Generation
Heavy Industry
Others
Request for Segment Customization as per your Business Requirement: Segment Customization Request
Regional Coverage:
North America
US
Canada
Mexico
Europe
Eastern Europe
Poland
Romania
Hungary
Turkey
Rest of Eastern Europe
Western Europe
Germany
France
UK
Italy
Spain
Netherlands
Switzerland
Austria
Rest of Western Europe
Asia Pacific
China
India
Japan
South Korea
Vietnam
Singapore
Australia
Rest of Asia Pacific
Middle East & Africa
Middle East
UAE
Egypt
Saudi Arabia
Qatar
Rest of Middle East
Africa
Nigeria
South Africa
Rest of Africa
Latin America
Brazil
Argentina
Colombia
Rest of Latin America
Request for Country Level Research Report: Country Level Customization Request
Available Customization
With the given market data, SNS Insider offers customization as per the company’s specific needs. The following customization options are available for the report:
Detailed Volume Analysis
Criss-Cross segment analysis (e.g. Product X Application)
Competitive Product Benchmarking
Geographic Analysis
Additional countries in any of the regions
Customized Data Representation
Detailed analysis and profiling of additional market players
Variable Air Volume Box Market Size was valued at USD 5.84 Billion in 2023 and is expected to reach USD 10.03 Billion by 2032 and grow at a CAGR of 6.27% over the forecast period 2024-2032.
The Overhead Cranes Market size was valued at USD 5.24 Billion in 2023 and is expected to reach USD 8.68 Billion by 2032 and grow at a CAGR of 5.78% over the forecast period 2024-2032.
The Brake Lathe Machine Market Size was estimated at USD 3.08 billion in 2023 and is expected to arrive at USD 4.66 billion by 2032 with a growing CAGR of 4.7% over the forecast period 2024-2032.
The Energy Recovery Ventilator Market size was estimated at USD 4.44 Billion in 2023 and is expected to reach USD 10.73 Billion by 2032 at a CAGR of 10.30% during the forecast period of 2024-2032.
The Tamper-Evident Labels Market size was valued at USD 16.98 billion in 2023. It is expected to grow to USD 25.08 billion by 2032 and grow at a CAGR of 4.43% over the forecast period of 2024-2032.
The Oil and Gas Accumulators Market Size was esteemed at USD 2450.5 million in 2023 and is supposed to arrive at USD 4241.9 million by 2031 and develop at a CAGR of 7.1% over the forecast period 2024-2031.

Hi! Click one of our member below to chat on Phone
© 2025 All Rights Reserved by SNS Insider Pvt Ltd


