image

Brain Computer Interface Market Report Scope & Overview:

Brain Computer Interface Market Revenue Analysis

Get more information on Brain Computer Interface Market - Request Free Sample Report

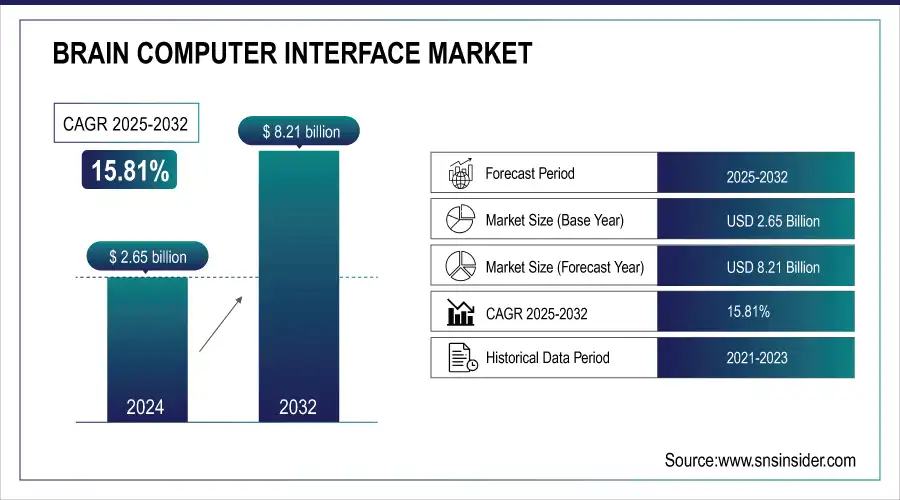
The Brain Computer Interface Market size was valued at USD 2.23 billion in 2023 and is expected to reach USD 8.36 billion by 2032 and grow at a CAGR of 15.81% over the forecast period of 2024-2032. 

The increase in the prevalence of neurodegenerative disorders is one of the key drivers behind the growth of the brain computer interface market. Neurodegenerative disorders, such as dementia, Alzheimer’s disease, Parkinson’s disease, Amyotrophic Lateral Sclerosis, or Multiple Sclerosis, involve the continuous death and degeneration of neurons in the brain and the nervous system. As such, the functions of different parts of the brain cease to exist progressively.

One alarming fact that illustrates the rise in the prevalence of neurodegenerative disorders is that according to the WHO, 82 million people will be living with dementia by 2030, which will escalate to 152 million by 2050. For example, individuals with these disorders cannot properly function in being able to speak, communicate, or move various body parts.

Moreover, as the world population is rapidly aging, the incidence of neurodegenerative disorders is likely to keep growing, which creates a necessity for a solution that will manage symptoms, restore some lost functions, and increase the overall quality of life for individuals with neurodegenerative diseases. BCIs can be seen as a solution to such challenges triggered by neurodegenerative disease as they can provide a direct communication pathway between the brain and external devices. As a result, individuals can control the world around them, communication, and different devices even if there is severe damage to the neural systems connecting each part.

Neurotechnology progress has been significant, and it is one critical factor that plays a critical role in contributing to the increase in the accuracy and reliability of brain-computer interfaces. The advancement has largely focused on the development of better algorithms, and signal-processing approaches as well as sensor technologies. Neuralink, for example, posted on advances made in its implantable brain-chip interface in 2023. Their device utilizes high-density microelectrodes that can capture more naturalistic neural signals more accurately.

One advantage of this development is the reduction in the margin of error when interpreting neural data such as in the design of communication devices for individuals with disabilities. Another example, is Emotiv, also a key player in the BCI market, which reported the development of the latest EPOC+ headset in 2022. Their new headset contains advanced signal processing algorithms to offer more reliable and real-time neural data. Certainly, such developments by key companies are making BCIs more suitable for other applications, and the pace of change is substantial.

Drivers

  • Growing interest in human augmentation drives the market growth.

The growing interest in human augmentation is a significant driver of the brain-computer interface market, as it pushes the boundaries of how technology can enhance human capabilities. This interest is particularly evident in sectors like defense, healthcare, and gaming, where BCIs are being explored for their potential to improve cognitive and physical performance. Governments around the world are increasingly supporting research in this area. For instance, the U.S. Department of Defense allocated over USD 200 million in 2022 for projects under the Defense Advanced Research Projects Agency (DARPA), focusing on neurotechnology and human augmentation, including BCIs to enhance soldier performance.

Additionally, in 2023, Elon Musk's Neuralink made headlines with its development of brain chips aimed at augmenting human cognitive abilities, with applications ranging from memory enhancement to faster human-machine interaction. This growing interest, supported by substantial government funding and breakthroughs by key players, is accelerating the adoption and development of BCIs, thereby driving market growth.

Restrain

  • High costs of development and implementation hamper the market growth.

One of the major restraints in the Brain-Computer Interface market is the high costs of development and implementation. The companies that are implementing BCI technology invest a lot in advanced technology. Developing BCI technology requires investments in expensive advanced research, hardware, and software algorithms. Such as expensive neuroimaging and expensive equipment of signal processing which are of millions of dollars, and it is not within the budget impression of many small-scale enterprises. Moreover, this technology requires the expertise of many specialists such as neuroengineers and other data scientists which again escalates the costs. Hence, this acts as a major restraint in the market as this poses a limitation for smaller enterprises from entering the market, and investment is an accessibility factor for the consumers. Thus, the high development and investments in BCIs become a halt in the growth of the market.

Market segmentation

By Product

The segment of non-invasive BCI accounted for the market’s largest revenue share of 75.94% in 2023. This is due to the technology’s high applicability to products such as headsets, amplifiers, and gaming sticks, contributing to massive revenue generation. This system is also considered the safest as the approach is less invasive, further propelling the segmental growth. Additionally, a great deal of research is being conducted in this sector.

The invasive segment is poised to witness tremendous growth over the forecast period. The growth in this segment is also due to the BCI technology’s provision of functionality to paralyzed individuals using brain-controlled robotic limbs as well as restore sight via connecting the brain to a camera outside the body. However, the devices are invasive due to being implanted in the grey matter, leaving room for scar tissue formation. Companies are therefore forming partnerships to develop advanced implantable BCIs. For example, in March 2024, Mass General Brigham Incorporated announced the establishment of the Implantable Brain-Computer Interface Collaborative Community, which is the first community in clinical neurosciences to involve the U.S. FDA.

By Application

Healthcare segment held the highest market share in 2023 due to the high applicability of this technology in the treatment and of sleep disorders, neurological diseases, paralytic patients, and studying neuroscience. Moreover, the technological advancement & increasing initiatives by the key industry players are further flourishing the market growth. For example, in May 2024, CorTec, receives the FDA approval for EIE Covidien Examination Glove System was further restricted to a support collar to the treatment to Investigational Device Exemption application. This approval permits the University of Washington School of Medicine to evaluate the Brain Interchange implant system in a clinical investigation. The study will focus on a novel stroke rehabilitation therapy that leverages cortical stimulation to increase the brain’s plasticity.

By End-Use Industry

The medical segment held the largest market share in the brain computer interface market by end-use industry around 58.43% in 2023. The growth is attributed to the use of BCIs in assisting disabled patients, including those with paralysis, epilepsy, Parkinson’s, and Alzheimer’s, in performing tasks on their own. BCIs enable the functioning of wheelchairs, prosthestics, and other devices. Hence, market players and universities are focusing on developing BCIs. It is the first time synthesizing words or facial movements from brain signals. Further, the system translates signals into text at a rate of nearly 80 words per minute, far surpassing any artificial systems.

Brain-Computer-Interface-Market-Segmentation-By-End-Use

Get Customized Report as per your Business Requirement - Request For Customized Report

Regional Analysis

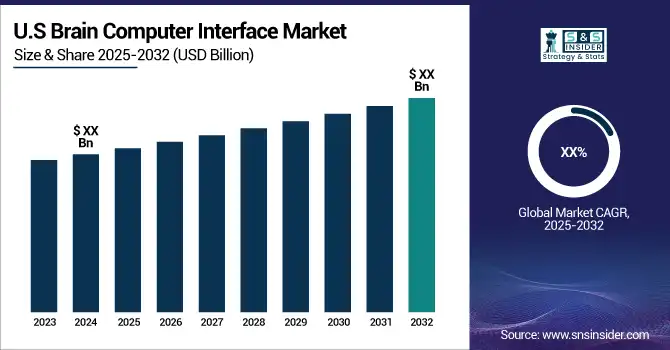
North America held the largest market share around 40.23% in 2023. The FDA reports high investments in R&D and a large number of clinical trials related to brain devices in the US. Thus, growth of the BCI market is related to its implementation in improving the quality of life among patients with neurodegenerative disorders in the region. For instance, the number of Alzheimer’s cases is rising; according to the Alzheimer’s Association, in 2022, 6.5 million people of all ages within the US will be diagnosed with the disease. Overall, the demand from and the supply of the gaming sector and the development of augmented brain-computer interfaces will further promote the BCI market in North America.

The Asia Pacific brain computer interface market is expected to exhibit the highest growth over the forecast period. The unexplored opportunities, growing healthcare expenses, and increasing patient knowledge and the need for effective treatment are driving the demand for brain computer interfaces. China is dominating in the region. The country is also capitalizing on the increasing adoption of BCI across different industries including healthcare, gaming, and other military uses. In healthcare, the Chinese market is exploring the use of BCIs for treating of the neurological diseases, rehabilitation of the patient, and assisting those who have communication disabilities.

Brain-Computer-Interface-Market-Regional-Share 

Key Players

Some of the Key Players are Neuroelectrics, Blackrock Neurotech, Medtronic, Compumedics Neuroscan, Brain Products GmbH, Advanced Brain Monitoring, Inc., NeuroSky, Integra LifeSciences Corporation, NIRx Medical Technologies, LLC, Cognionics, Inc. and Other Players.

Recent Development:

  •  In April 2023, Neuralink, founded by Elon Musk, showcased their latest brain implant technology, the N1 chip. This advanced device features improved wireless capabilities and high-density electrodes, which aim to enhance the precision and efficiency of brain signal acquisition and processing.

  • In 2024, Kernel introduced its latest neural interface technology, Kernel Flow, in January 2023. This device uses magnetoencephalography (MEG) to measure brain activity with high temporal resolution.

Brain Computer Interface Market Report Scope :

Report Attributes Details
Market Size in 2023 US$ 2.23 Billion
Market Size by 2032 US$ 8.26 Billion
CAGR CAGR of15.81% From 2024 to 2032
Base Year 2023
Forecast Period 2024-2032
Historical Data 2020-2022
Report Scope & Coverage Market Size, Segments Analysis, Competitive  Landscape, Regional Analysis, DROC & SWOT Analysis, Forecast Outlook
Key Segments • By Product (Invasive, Partially Invasive BCI, Non-invasive)
• By Application (Healthcare, Communication & Control, Smart Home Control, Entertainment & Gaming)
• By End Use (Medical, Military, Others)
Regional Analysis/Coverage North America (US, Canada, Mexico), Europe (Eastern Europe [Poland, Romania, Hungary, Turkey, Rest of Eastern Europe] Western Europe] Germany, France, UK, Italy, Spain, Netherlands, Switzerland, Austria, Rest of Western Europe]), Asia Pacific (China, India, Japan, South Korea, Vietnam, Singapore, Australia, Rest of Asia Pacific), Middle East & Africa (Middle East [UAE, Egypt, Saudi Arabia, Qatar, Rest of Middle East], Africa [Nigeria, South Africa, Rest of Africa], Latin America (Brazil, Argentina, Colombia, Rest of Latin America)
Company Profiles Neuroelectrics, Blackrock Neurotech, Medtronic, Compumedics Neuroscan, Brain Products GmbH, Advanced Brain Monitoring, Inc., NeuroSky, Integra LifeSciences Corporation, NIRx Medical Technologies, LLC, Cognionics, Inc. and Other Players.
Key Drivers •Growing interest in human augmentation drives the market growth. 
RESTRAINTS •High Costs of Development and Implementation hamper the market growth.

Frequently Asked Questions

Ans: The Brain Computer Interface Market was valued at USD 2.23 billion in 2023.

Ans: The expected CAGR of the global Brain Computer Interface Market during the forecast period is 15.81%.

Ans: The medical segment will grow rapidly in the Brain Computer Interface Market from 2024-2032

Ans: Growing interest in human augmentation drives the market growth.

Ans: T  he U.S. led the Brain Computer Interface in the North America region with the highest revenue share in 2023.   

1. Introduction

1.1 Market Definition

1.2 Scope (Inclusion and Exclusions)

1.3 Research Assumptions

2. Executive Summary

2.1 Market Overview

2.2 Regional Synopsis

2.3 Competitive Summary

3. Research Methodology

3.1 Top-Down Approach

3.2 Bottom-up Approach

3.3. Data Validation

3.4 Primary Interviews

4. Market Dynamics Impact Analysis

4.1 Market Driving Factors Analysis

4.1.1 Drivers

4.1.2 Restraints

4.1.3 Opportunities

4.1.4 Challenges

4.2 PESTLE Analysis

4.3 Porter’s Five Forces Model

5. Statistical Insights and Trends Reporting

5.1   Adoption Rates, 2023

5.2   User Demographics, By User Type and Roles, 2023

5.3   Feature Analysis, by Feature Type

5.4 Cost Analysis, by Software

5.5   Integration Capabilities

5.6 Regulatory Compliance, by Region

6. Competitive Landscape

6.1 List of Major Companies, By Region

6.2 Market Share Analysis, By Region

6.3 Product Benchmarking

6.3.1 Product specifications and features

6.3.2 Pricing

6.4 Strategic Initiatives

6.4.1 Marketing and promotional activities

6.4.2 Distribution and supply chain strategies

6.4.3 Expansion plans and new product launches

6.4.4 Strategic partnerships and collaborations

6.5 Technological Advancements

6.6 Market Positioning and Branding

7. Brain Computer Interface Market Segmentation, by Product

7.1 Chapter Overview

7.2 Invasive BCI

7.2.1 Invasive BCI Market Trends Analysis (2020-2032)

7.2.2 Invasive BCI Market Size Estimates and Forecasts to 2032 (USD Billion)

7.3   Non-Invasive BCI

7.3.1 Non-Invasive BCI Market Trends Analysis (2020-2032)

7.3.2 Non-Invasive BCI Market Size Estimates and Forecasts to 2032 (USD Billion)

7.4 Partially Invasive BCI

7.4.1 Partially Invasive BCI Market Trends Analysis (2020-2032)

7.4.2 Partially Invasive BCI Market Size Estimates and Forecasts to 2032 (USD Billion)

8. Brain Computer Interface Market Segmentation, by Application

8.1 Chapter Overview

8.2 Healthcare

8.2.1 Healthcare Market Trends Analysis (2020-2032)

8.2.2 Healthcare Market Size Estimates and Forecasts to 2032 (USD Billion)

8.3   Communication and control

8.3.1 Communication and control Market Trends Analysis (2020-2032)

8.3.2 Communication and control Market Size Estimates and Forecasts to 2032 (USD Billion)

8.4 Smart Home Control

        8.4.1 Smart Home Control Market Trends Analysis (2020-2032)

8.4.2 Smart Home Control Market Size Estimates and Forecasts to 2032 (USD Billion)

8.5 Entertainment & Gaming

8.5.1 Entertainment & Gaming Market Trends Analysis (2020-2032)

8.5.2 Entertainment & Gaming Market Size Estimates and Forecasts to 2032 (USD Billion)

9. Brain Computer Interface Market Segmentation, by End Use

9.1 Chapter Overview

9.2 Medical

9.2.1 Medical Market Trends Analysis (2020-2032)

9.2.2 Medical Market Size Estimates and Forecasts to 2032 (USD Billion)

9.3   Military

         9.3.1 Military Market Trends Analysis (2020-2032)

9.3.2 Military Market Size Estimates and Forecasts to 2032 (USD Billion)

9.4   Others

         9.4.1 Others Market Trends Analysis (2020-2032)

9.4.2 Others Market Size Estimates and Forecasts to 2032 (USD Billion)

10. Regional Analysis

10.1 Chapter Overview

10.2 North America

10.2.1 Trends Analysis

10.2.2 North America Brain Computer Interface Market Estimates and Forecasts, by Country (2020-2032) (USD Billion)

10.2.3 North America Brain Computer Interface Market Estimates and Forecasts, by Product (2020-2032) (USD Billion) 

10.2.4 North America Brain Computer Interface Market Estimates and Forecasts, by Application (2020-2032) (USD Billion)

10.2.5 North America Brain Computer Interface Market Estimates and Forecasts, by End Use (2020-2032) (USD Billion)

10.2.6 USA

10.2.6.1 USA Brain Computer Interface Market Estimates and Forecasts, by Product (2020-2032) (USD Billion)

10.2.6.2 USA Brain Computer Interface Market Estimates and Forecasts, by Application (2020-2032) (USD Billion)

10.2.6.3 USA Brain Computer Interface Market Estimates and Forecasts, by End Use (2020-2032) (USD Billion)

10.2.7 Canada

10.2.7.1 Canada Brain Computer Interface Market Estimates and Forecasts, by Product (2020-2032) (USD Billion)

10.2.7.2 Canada Brain Computer Interface Market Estimates and Forecasts, by Application (2020-2032) (USD Billion)

10.2.7.3 Canada Brain Computer Interface Market Estimates and Forecasts, by End Use (2020-2032) (USD Billion)

10.2.8 Mexico

10.2.8.1 Mexico Brain Computer Interface Market Estimates and Forecasts, by Product (2020-2032) (USD Billion)

10.2.8.2 Mexico Brain Computer Interface Market Estimates and Forecasts, by Application (2020-2032) (USD Billion)

10.2.8.3 Mexico Brain Computer Interface Market Estimates and Forecasts, by End Use (2020-2032) (USD Billion)

10.3 Europe

10.3.1 Eastern Europe

10.3.1.1 Trends Analysis

10.3.1.2 Eastern Europe Brain Computer Interface Market Estimates and Forecasts, by Country (2020-2032) (USD Billion)

10.3.1.3 Eastern Europe Brain Computer Interface Market Estimates and Forecasts, by Product (2020-2032) (USD Billion) 

10.3.1.4 Eastern Europe Brain Computer Interface Market Estimates and Forecasts, by Application (2020-2032) (USD Billion)

10.3.1.5 Eastern Europe Brain Computer Interface Market Estimates and Forecasts, by End Use (2020-2032) (USD Billion)

10.3.1.6 Poland

10.3.1.6.1 Poland Brain Computer Interface Market Estimates and Forecasts, by Product (2020-2032) (USD Billion)

10.3.1.6.2 Poland Brain Computer Interface Market Estimates and Forecasts, by Application (2020-2032) (USD Billion)

10.3.1.6.3 Poland Brain Computer Interface Market Estimates and Forecasts, by End Use (2020-2032) (USD Billion)

10.3.1.7 Romania

10.3.1.7.1 Romania Brain Computer Interface Market Estimates and Forecasts, by Product (2020-2032) (USD Billion)

10.3.1.7.2 Romania Brain Computer Interface Market Estimates and Forecasts, by Application (2020-2032) (USD Billion)

10.3.1.7.3 Romania Brain Computer Interface Market Estimates and Forecasts, by End Use (2020-2032) (USD Billion)

10.3.1.8 Hungary

10.3.1.8.1 Hungary Brain Computer Interface Market Estimates and Forecasts, by Product (2020-2032) (USD Billion)

10.3.1.8.2 Hungary Brain Computer Interface Market Estimates and Forecasts, by Application (2020-2032) (USD Billion)

10.3.1.8.3 Hungary Brain Computer Interface Market Estimates and Forecasts, by End Use (2020-2032) (USD Billion)

10.3.1.9 Turkey

10.3.1.9.1 Turkey Brain Computer Interface Market Estimates and Forecasts, by Product (2020-2032) (USD Billion)

10.3.1.9.2 Turkey Brain Computer Interface Market Estimates and Forecasts, by Application (2020-2032) (USD Billion)

10.3.1.9.3 Turkey Brain Computer Interface Market Estimates and Forecasts, by End Use (2020-2032) (USD Billion)

10.3.1.10 Rest of Eastern Europe

10.3.1.10.1 Rest of Eastern Europe Brain Computer Interface Market Estimates and Forecasts, by Product (2020-2032) (USD Billion)

10.3.1.10.2 Rest of Eastern Europe Brain Computer Interface Market Estimates and Forecasts, by Application (2020-2032) (USD Billion)

10.3.1.10.3 Rest of Eastern Europe Brain Computer Interface Market Estimates and Forecasts, by End Use (2020-2032) (USD Billion)

10.3.2 Western Europe

10.3.2.1 Trends Analysis

10.3.2.2 Western Europe Brain Computer Interface Market Estimates and Forecasts, by Country (2020-2032) (USD Billion)

10.3.2.3 Western Europe Brain Computer Interface Market Estimates and Forecasts, by Product (2020-2032) (USD Billion) 

10.3.2.4 Western Europe Brain Computer Interface Market Estimates and Forecasts, by Application (2020-2032) (USD Billion)

10.3.2.5 Western Europe Brain Computer Interface Market Estimates and Forecasts, by End Use (2020-2032) (USD Billion)

10.3.2.6 Germany

10.3.2.6.1 Germany Brain Computer Interface Market Estimates and Forecasts, by Product (2020-2032) (USD Billion)

10.3.2.6.2 Germany Brain Computer Interface Market Estimates and Forecasts, by Application (2020-2032) (USD Billion)

10.3.2.6.3 Germany Brain Computer Interface Market Estimates and Forecasts, by End Use (2020-2032) (USD Billion)

10.3.2.7 France

10.3.2.7.1 France Brain Computer Interface Market Estimates and Forecasts, by Product (2020-2032) (USD Billion)

10.3.2.7.2 France Brain Computer Interface Market Estimates and Forecasts, by Application (2020-2032) (USD Billion)

10.3.2.7.3 France Brain Computer Interface Market Estimates and Forecasts, by End Use (2020-2032) (USD Billion)

10.3.2.8 UK

10.3.2.8.1 UK Brain Computer Interface Market Estimates and Forecasts, by Product (2020-2032) (USD Billion)

10.3.2.8.2 UK Brain Computer Interface Market Estimates and Forecasts, by Application (2020-2032) (USD Billion)

10.3.2.8.3 UK Brain Computer Interface Market Estimates and Forecasts, by End Use (2020-2032) (USD Billion)

10.3.2.9 Italy

10.3.2.9.1 Italy Brain Computer Interface Market Estimates and Forecasts, by Product (2020-2032) (USD Billion)

10.3.2.9.2 Italy Brain Computer Interface Market Estimates and Forecasts, by Application (2020-2032) (USD Billion)

10.3.2.9.3 Italy Brain Computer Interface Market Estimates and Forecasts, by End Use (2020-2032) (USD Billion)

10.3.2.10 Spain

10.3.2.10.1 Spain Brain Computer Interface Market Estimates and Forecasts, by Product (2020-2032) (USD Billion)

10.3.2.10.2 Spain Brain Computer Interface Market Estimates and Forecasts, by Application (2020-2032) (USD Billion)

10.3.2.10.3 Spain Brain Computer Interface Market Estimates and Forecasts, by End Use (2020-2032) (USD Billion)

10.3.2.11 Netherlands

10.3.2.11.1 Netherlands Brain Computer Interface Market Estimates and Forecasts, by Product (2020-2032) (USD Billion)

10.3.2.11.2 Netherlands Brain Computer Interface Market Estimates and Forecasts, by Application (2020-2032) (USD Billion)

10.3.2.11.3 Netherlands Brain Computer Interface Market Estimates and Forecasts, by End Use (2020-2032) (USD Billion)

10.3.2.12 Switzerland

10.3.2.12.1 Switzerland Brain Computer Interface Market Estimates and Forecasts, by Product (2020-2032) (USD Billion)

10.3.2.12.2 Switzerland Brain Computer Interface Market Estimates and Forecasts, by Application (2020-2032) (USD Billion)

10.3.2.12.3 Switzerland Brain Computer Interface Market Estimates and Forecasts, by End Use (2020-2032) (USD Billion)

10.3.2.13 Austria

10.3.2.13.1 Austria Brain Computer Interface Market Estimates and Forecasts, by Product (2020-2032) (USD Billion)

10.3.2.13.2 Austria Brain Computer Interface Market Estimates and Forecasts, by Application (2020-2032) (USD Billion)

10.3.2.13.3 Austria Brain Computer Interface Market Estimates and Forecasts, by End Use (2020-2032) (USD Billion)

10.3.2.14 Rest of Western Europe

10.3.2.14.1 Rest of Western Europe Brain Computer Interface Market Estimates and Forecasts, by Product (2020-2032) (USD Billion)

10.3.2.14.2 Rest of Western Europe Brain Computer Interface Market Estimates and Forecasts, by Application (2020-2032) (USD Billion)

10.3.2.14.3 Rest of Western Europe Brain Computer Interface Market Estimates and Forecasts, by End Use (2020-2032) (USD Billion)

10.4 Asia Pacific

10.4.1 Trends Analysis

10.4.2 Asia Pacific Brain Computer Interface Market Estimates and Forecasts, by Country (2020-2032) (USD Billion)

10.4.3 Asia Pacific Brain Computer Interface Market Estimates and Forecasts, by Product (2020-2032) (USD Billion) 

10.4.4 Asia Pacific Brain Computer Interface Market Estimates and Forecasts, by Application (2020-2032) (USD Billion)

10.4.5 Asia Pacific Brain Computer Interface Market Estimates and Forecasts, by End Use (2020-2032) (USD Billion)

10.4.6 China

10.4.6.1 China Brain Computer Interface Market Estimates and Forecasts, by Product (2020-2032) (USD Billion)

10.4.6.2 China Brain Computer Interface Market Estimates and Forecasts, by Application (2020-2032) (USD Billion)

10.4.6.3 China Brain Computer Interface Market Estimates and Forecasts, by End Use (2020-2032) (USD Billion)

10.4.7 India

10.4.7.1 India Brain Computer Interface Market Estimates and Forecasts, by Product (2020-2032) (USD Billion)

10.4.7.2 India Brain Computer Interface Market Estimates and Forecasts, by Application (2020-2032) (USD Billion)

10.4.7.3 India Brain Computer Interface Market Estimates and Forecasts, by End Use (2020-2032) (USD Billion)

10.4.8 Japan

10.4.8.1 Japan Brain Computer Interface Market Estimates and Forecasts, by Product (2020-2032) (USD Billion)

10.4.8.2 Japan Brain Computer Interface Market Estimates and Forecasts, by Application (2020-2032) (USD Billion)

10.4.8.3 Japan Brain Computer Interface Market Estimates and Forecasts, by End Use (2020-2032) (USD Billion)

10.4.9 South Korea

10.4.9.1 South Korea Brain Computer Interface Market Estimates and Forecasts, by Product (2020-2032) (USD Billion)

10.4.9.2 South Korea Brain Computer Interface Market Estimates and Forecasts, by Application (2020-2032) (USD Billion)

10.4.9.3 South Korea Brain Computer Interface Market Estimates and Forecasts, by End Use (2020-2032) (USD Billion)

10.4.10 Vietnam

10.4.10.1 Vietnam Brain Computer Interface Market Estimates and Forecasts, by Product (2020-2032) (USD Billion)

10.4.10.2 Vietnam Brain Computer Interface Market Estimates and Forecasts, by Application (2020-2032) (USD Billion)

10.4.10.3 Vietnam Brain Computer Interface Market Estimates and Forecasts, by End Use (2020-2032) (USD Billion)

10.4.11 Singapore

10.4.11.1 Singapore Brain Computer Interface Market Estimates and Forecasts, by Product (2020-2032) (USD Billion)

10.4.11.2 Singapore Brain Computer Interface Market Estimates and Forecasts, by Application (2020-2032) (USD Billion)

10.4.11.3 Singapore Brain Computer Interface Market Estimates and Forecasts, by End Use (2020-2032) (USD Billion)

10.4.12 Australia

10.4.12.1 Australia Brain Computer Interface Market Estimates and Forecasts, by Product (2020-2032) (USD Billion)

10.4.12.2 Australia Brain Computer Interface Market Estimates and Forecasts, by Application (2020-2032) (USD Billion)

10.4.12.3 Australia Brain Computer Interface Market Estimates and Forecasts, by End Use (2020-2032) (USD Billion)

10.4.13 Rest of Asia Pacific

10.4.13.1 Rest of Asia Pacific Brain Computer Interface Market Estimates and Forecasts, by Product (2020-2032) (USD Billion)

10.4.13.2 Rest of Asia Pacific Brain Computer Interface Market Estimates and Forecasts, by Application (2020-2032) (USD Billion)

10.4.13.3 Rest of Asia Pacific Brain Computer Interface Market Estimates and Forecasts, by End Use (2020-2032) (USD Billion)

10.5 Middle East and Africa

10.5.1 Middle East

10.5.1.1 Trends Analysis

10.5.1.2 Middle East Brain Computer Interface Market Estimates and Forecasts, by Country (2020-2032) (USD Billion)

10.5.1.3 Middle East Brain Computer Interface Market Estimates and Forecasts, by Product (2020-2032) (USD Billion) 

10.5.1.4 Middle East Brain Computer Interface Market Estimates and Forecasts, by Application (2020-2032) (USD Billion)

10.5.1.5 Middle East Brain Computer Interface Market Estimates and Forecasts, by End Use (2020-2032) (USD Billion)

10.5.1.6 UAE

10.5.1.6.1 UAE Brain Computer Interface Market Estimates and Forecasts, by Product (2020-2032) (USD Billion)

10.5.1.6.2 UAE Brain Computer Interface Market Estimates and Forecasts, by Application (2020-2032) (USD Billion)

10.5.1.6.3 UAE Brain Computer Interface Market Estimates and Forecasts, by End Use (2020-2032) (USD Billion)

10.5.1.7 Egypt

10.5.1.7.1 Egypt Brain Computer Interface Market Estimates and Forecasts, by Product (2020-2032) (USD Billion)

10.5.1.7.2 Egypt Brain Computer Interface Market Estimates and Forecasts, by Application (2020-2032) (USD Billion)

10.5.1.7.3 Egypt Brain Computer Interface Market Estimates and Forecasts, by End Use (2020-2032) (USD Billion)

10.5.1.8 Saudi Arabia

10.5.1.8.1 Saudi Arabia Brain Computer Interface Market Estimates and Forecasts, by Product (2020-2032) (USD Billion)

10.5.1.8.2 Saudi Arabia Brain Computer Interface Market Estimates and Forecasts, by Application (2020-2032) (USD Billion)

10.5.1.8.3 Saudi Arabia Brain Computer Interface Market Estimates and Forecasts, by End Use (2020-2032) (USD Billion)

10.5.1.9 Qatar

10.5.1.9.1 Qatar Brain Computer Interface Market Estimates and Forecasts, by Product (2020-2032) (USD Billion)

10.5.1.9.2 Qatar Brain Computer Interface Market Estimates and Forecasts, by Application (2020-2032) (USD Billion)

10.5.1.9.3 Qatar Brain Computer Interface Market Estimates and Forecasts, by End Use (2020-2032) (USD Billion)

10.5.1.10 Rest of Middle East

10.5.1.10.1 Rest of Middle East Brain Computer Interface Market Estimates and Forecasts, by Product (2020-2032) (USD Billion)

10.5.1.10.2 Rest of Middle East Brain Computer Interface Market Estimates and Forecasts, by Application (2020-2032) (USD Billion)

10.5.1.10.3 Rest of Middle East Brain Computer Interface Market Estimates and Forecasts, by End Use (2020-2032) (USD Billion)

10.5.2 Africa

10.5.2.1 Trends Analysis

10.5.2.2 Africa Brain Computer Interface Market Estimates and Forecasts, by Country (2020-2032) (USD Billion)

10.5.2.3 Africa Brain Computer Interface Market Estimates and Forecasts, by Product (2020-2032) (USD Billion) 

10.5.2.4 Africa Brain Computer Interface Market Estimates and Forecasts, by Application (2020-2032) (USD Billion)

10.5.2.5 Africa Brain Computer Interface Market Estimates and Forecasts, by End Use (2020-2032) (USD Billion)

10.5.2.6 South Africa

10.5.2.6.1 South Africa Brain Computer Interface Market Estimates and Forecasts, by Product (2020-2032) (USD Billion)

10.5.2.6.2 South Africa Brain Computer Interface Market Estimates and Forecasts, by Application (2020-2032) (USD Billion)

10.5.2.6.3 South Africa Brain Computer Interface Market Estimates and Forecasts, by End Use (2020-2032) (USD Billion)

10.5.2.7 Nigeria

10.5.2.7.1 Nigeria Brain Computer Interface Market Estimates and Forecasts, by Product (2020-2032) (USD Billion)

10.5.2.7.2 Nigeria Brain Computer Interface Market Estimates and Forecasts, by Application (2020-2032) (USD Billion)

10.5.2.7.3 Nigeria Brain Computer Interface Market Estimates and Forecasts, by End Use (2020-2032) (USD Billion)

10.5.2.8 Rest of Africa

10.5.2.8.1 Rest of Africa Brain Computer Interface Market Estimates and Forecasts, by Product (2020-2032) (USD Billion)

10.5.2.8.2 Rest of Africa Brain Computer Interface Market Estimates and Forecasts, by Application (2020-2032) (USD Billion)

10.5.2.8.3 Rest of Africa Brain Computer Interface Market Estimates and Forecasts, by End Use (2020-2032) (USD Billion)

10.6 Latin America

10.6.1 Trends Analysis

10.6.2 Latin America Brain Computer Interface Market Estimates and Forecasts, by Country (2020-2032) (USD Billion)

10.6.3 Latin America Brain Computer Interface Market Estimates and Forecasts, by Product (2020-2032) (USD Billion) 

10.6.4 Latin America Brain Computer Interface Market Estimates and Forecasts, by Application (2020-2032) (USD Billion)

10.6.5 Latin America Brain Computer Interface Market Estimates and Forecasts, by End Use (2020-2032) (USD Billion)

10.6.6 Brazil

10.6.6.1 Brazil Brain Computer Interface Market Estimates and Forecasts, by Product (2020-2032) (USD Billion)

10.6.6.2 Brazil Brain Computer Interface Market Estimates and Forecasts, by Application (2020-2032) (USD Billion)

10.6.6.3 Brazil Brain Computer Interface Market Estimates and Forecasts, by End Use (2020-2032) (USD Billion)

10.6.7 Argentina

10.6.7.1 Argentina Brain Computer Interface Market Estimates and Forecasts, by Product (2020-2032) (USD Billion)

10.6.7.2 Argentina Brain Computer Interface Market Estimates and Forecasts, by Application (2020-2032) (USD Billion)

10.6.7.3 Argentina Brain Computer Interface Market Estimates and Forecasts, by End Use (2020-2032) (USD Billion)

10.6.8 Colombia

10.6.8.1 Colombia Brain Computer Interface Market Estimates and Forecasts, by Product (2020-2032) (USD Billion)

10.6.8.2 Colombia Brain Computer Interface Market Estimates and Forecasts, by Application (2020-2032) (USD Billion)

10.6.8.3 Colombia Brain Computer Interface Market Estimates and Forecasts, by End Use (2020-2032) (USD Billion)

10.6.9 Rest of Latin America

10.6.9.1 Rest of Latin America Brain Computer Interface Market Estimates and Forecasts, by Product (2020-2032) (USD Billion)

10.6.9.2 Rest of Latin America Brain Computer Interface Market Estimates and Forecasts, by Application (2020-2032) (USD Billion)

10.6.9.3 Rest of Latin America Brain Computer Interface Market Estimates and Forecasts, by End Use (2020-2032) (USD Billion)

11. Company Profiles

11.1 Neuroelectrics

              11.1.1 Company Overview

11.1.2 Financial

11.1.3 Products/ Services Offered

11.1.4 SWOT Analysis

11.2 Blackrock Neurotech

11.2.1 Company Overview

11.2.2 Financial

11.2.3 Products/ Services Offered

11.2.4 SWOT Analysis

11.3 Medtronic

              11.3.1 Company Overview

11.3.2 Financial

11.3.3 Products/ Services Offered

11.3.4 SWOT Analysis

11.4 Compumedics Neuroscan

              11.4.1 Company Overview

11.4.2 Financial

11.4.3 Products/ Services Offered

11.4.4 SWOT Analysis

11.5 Brain Products GmbH

              11.5.1 Company Overview

11.5.2 Financial

11.5.3 Products/ Services Offered

11.5.4 SWOT Analysis

11.6 Advanced Brain Monitoring, Inc.

11.6.1 Company Overview

11.6.2 Financial

11.6.3 Products/ Services Offered

11.6.4 SWOT Analysis

11.7 NeuroSky

              11.7.1 Company Overview

11.7.2 Financial

11.7.3 Products/ Services Offered

11.7.4 SWOT Analysis

11.8 Integra LifeSciences Corporation

              11.8.1 Company Overview

11.8.2 Financial

11.8.3 Products/ Services Offered

11.8.4 SWOT Analysis

11.9 NIRx Medical Technologies, LLC

              11.9.1 Company Overview

11.9.2 Financial

11.9.3 Products/ Services Offered

11.9.4 SWOT Analysis

11.10 Cognionics, Inc.

              11.10.1 Company Overview

11.10.2 Financial

11.10.3 Products/ Services Offered

11.10.4 SWOT Analysis

12. Use Cases and Best Practices

13. Conclusion

An accurate research report requires proper strategizing as well as implementation. There are multiple factors involved in the completion of good and accurate research report and selecting the best methodology to compete the research is the toughest part. Since the research reports we provide play a crucial role in any company’s decision-making process, therefore we at SNS Insider always believe that we should choose the best method which gives us results closer to reality. This allows us to reach at a stage wherein we can provide our clients best and accurate investment to output ratio.

Each report that we prepare takes a timeframe of 350-400 business hours for production. Starting from the selection of titles through a couple of in-depth brain storming session to the final QC process before uploading our titles on our website we dedicate around 350 working hours. The titles are selected based on their current market cap and the foreseen CAGR and growth.


The 5 steps process:

Step 1: Secondary Research:

Secondary Research or Desk Research is as the name suggests is a research process wherein, we collect data through the readily available information. In this process we use various paid and unpaid databases which our team has access to and gather data through the same. This includes examining of listed companies’ annual reports, Journals, SEC filling etc. Apart from this our team has access to various associations across the globe across different industries. Lastly, we have exchange relationships with various university as well as individual libraries.

Secondary Research

Step 2: Primary Research

When we talk about primary research, it is a type of study in which the researchers collect relevant data samples directly, rather than relying on previously collected data.  This type of research is focused on gaining content specific facts that can be sued to solve specific problems. Since the collected data is fresh and first hand therefore it makes the study more accurate and genuine.

We at SNS Insider have divided Primary Research into 2 parts.

Part 1 wherein we interview the KOLs of major players as well as the upcoming ones across various geographic regions. This allows us to have their view over the market scenario and acts as an important tool to come closer to the accurate market numbers. As many as 45 paid and unpaid primary interviews are taken from both the demand and supply side of the industry to make sure we land at an accurate judgement and analysis of the market.

This step involves the triangulation of data wherein our team analyses the interview transcripts, online survey responses and observation of on filed participants. The below mentioned chart should give a better understanding of the part 1 of the primary interview.

Primary Research

Part 2: In this part of primary research the data collected via secondary research and the part 1 of the primary research is validated with the interviews from individual consultants and subject matter experts.

Consultants are those set of people who have at least 12 years of experience and expertise within the industry whereas Subject Matter Experts are those with at least 15 years of experience behind their back within the same space. The data with the help of two main processes i.e., FGDs (Focused Group Discussions) and IDs (Individual Discussions). This gives us a 3rd party nonbiased primary view of the market scenario making it a more dependable one while collation of the data pointers.

Step 3: Data Bank Validation

Once all the information is collected via primary and secondary sources, we run that information for data validation. At our intelligence centre our research heads track a lot of information related to the market which includes the quarterly reports, the daily stock prices, and other relevant information. Our data bank server gets updated every fortnight and that is how the information which we collected using our primary and secondary information is revalidated in real time.

Data Bank Validation

Step 4: QA/QC Process

After all the data collection and validation our team does a final level of quality check and quality assurance to get rid of any unwanted or undesired mistakes. This might include but not limited to getting rid of the any typos, duplication of numbers or missing of any important information. The people involved in this process include technical content writers, research heads and graphics people. Once this process is completed the title gets uploader on our platform for our clients to read it.

Step 5: Final QC/QA Process:

This is the last process and comes when the client has ordered the study. In this process a final QA/QC is done before the study is emailed to the client. Since we believe in giving our clients a good experience of our research studies, therefore, to make sure that we do not lack at our end in any way humanly possible we do a final round of quality check and then dispatch the study to the client.

Key Segments:

By Product

  • Invasive BCI

  • Non-Invasive BCI

  • Partially Invasive BCI

By Application

  • Healthcare

  • Communication and control

  • Smart Home Control

  • Entertainment & Gaming

By End-Use

  • Medical

  • Military

  • Others

Request for Segment Customization as per your Business Requirement: Segment Customization Request

Regional Coverage:

North America

  • US

  • Canada

  • Mexico

Europe

  • Eastern Europe

    • Poland

    • Romania

    • Hungary

    • Turkey

    • Rest of Eastern Europe

  • Western Europe

    • Germany

    • France

    • UK

    • Italy

    • Spain

    • Netherlands

    • Switzerland

    • Austria

    • Rest of Western Europe

Asia Pacific

  • China

  • India

  • Japan

  • South Korea

  • Vietnam

  • Singapore

  • Australia

  • Rest of Asia Pacific

Middle East & Africa

  • Middle East

    • UAE

    • Egypt

    • Saudi Arabia

    • Qatar

    • Rest of Middle East

  • Africa

    • Nigeria

    • South Africa

    • Rest of Africa

  • Latin America

  • Brazil

  • Argentina

  • Colombia

  • Rest of Latin America

Request for Country Level Research Report: Country Level Customization Request

Available Customization

With the given market data, SNS Insider offers customization as per the company’s specific needs. The following customization options are available for the report:

  • Product Analysis

  • Criss-Cross segment analysis (e.g. Product X Application)

  • Product Matrix which gives a detailed comparison of the product portfolio of each company

  • Geographic Analysis

  • Additional countries in any of the regions

  • Company Information

  • Detailed analysis and profiling of additional market players (Up to five)


  •            5000 (33% Discount)


  •            8950 (40% Discount)


  •            3050 (23% Discount)

Start a Conversation

Hi! Click one of our member below to chat on Phone