Bot Services Market Report & Scope overview:
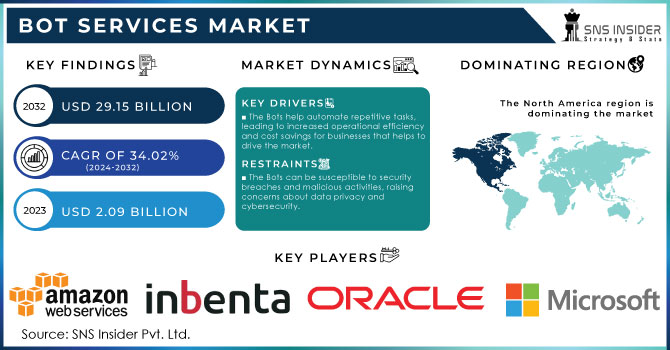
The Bot Services Market Size was valued at USD 1.66 Billion in 2023 and is expected to reach USD 20.21 Billion by 2032 and grow at a CAGR of 32.04% over the forecast period 2024-2032.
Get More Information on Bot Services Market - Request Sample Report
In the Bot Services market user engagement metrics, reflecting the frequency and depth of user interaction, are a critical component of the Bot Services market, indicating the ability of bots to keep users engaged. Bot efficiency analyzes the efficiency of the bot in executing the tasks assigned to it. It mainly tracks the response times and whether the issues are resolved or not. CSAT is feedback used to evaluate the quality of bot interactions and it is a metric that correlates with retention and trust. The availability and uptime of the bot play an important role in providing a service without any outages or faults.
Market Dynamics
Key Drivers:
-
Driving Market Growth with Automation in Customer Service Across BFSI Retail and Healthcare Industries
The major driver that is accelerating the market growth is the increasing demand for automation within customer service across many industries such as BFSI, retail, and healthcare, where businesses strive to improve efficiency as well as the overall experience of their customers. AI chatbots and virtual assistants are rapidly embraced to minimize operational costs by taking over everyday activities, such as customer inquiries, claims processing, and order management.
Restrain:
-
Overcoming Challenges of Accuracy and Reliability in Bot Services for Complex Use Cases and Industries
The uncertainty of performance, accuracy, and reliability across different use cases is one of the significant restraints in the Bot Services market. The bots are good for ordinary things, but for difficult customer queries and unstructured data, the bots may encounter issues, which could lead to a misunderstandings or frustration. Bot effectiveness can also be hindered by the limitations of natural language processing (NLP) and machine learning (ML) algorithms that struggle to interpret context and sentiment, especially in industries like healthcare or finance where accuracy is paramount.
Opportunity:
-
Unlocking Growth Opportunities with AI Bots in Healthcare Retail Media and Government Sectors
The growing need for AI-powered automation across the healthcare, media, and government sectors is the potential hidden gem. Similarly, healthcare bots can assist telemedicine, patient involvement, and administrative duties, and are witnessing considerable growth prospects. Moreover, continued efforts of organizations to improve customer experience driven by 24/7 support have increased the demand for intelligent bots across retail and eCommerce verticals. Bots have the potential to help organizations process high-value information quickly and enable multi-channel communication, piquing the interest of numerous verticals for innovation and growth.
Challenges:
-
Navigating Security Challenges and Privacy Risks in Deploying AI Bots Across Sensitive Sectors
The security and privacy concerns related to deploying AI-powered bots, especially in sectors such as healthcare and BFSI, are another challenge. Bots need to access large amounts of data, so keeping this data safe is a major challenge. Further, the process of integrating bots with existing legacy systems is both challenging and time-consuming, impeding the speed of deployment. Challenges from data exposure to the risks of leaking specific AI models and satisfying rigid regulations such as GDPR have only multiplied the fears, leading businesses to be bound to secure the necessary security and legal provisions on the deployment of board solutions.
Segment Analysis
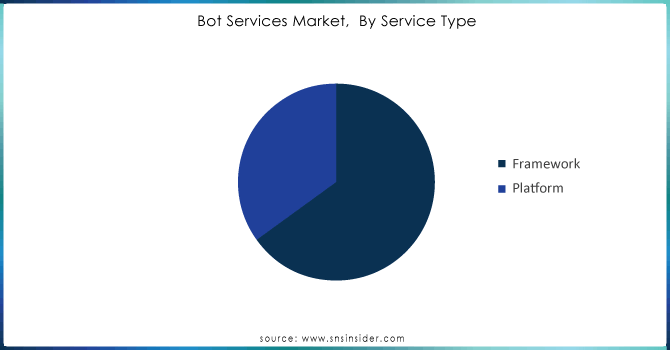
By Service Type
In 2023, the Framework segment held the largest market share of 63.3%, and it is expected to continue dominating the market as the framework is widely adopted by developers in building personalized bot solutions. Businesses can utilize a framework to create customized bots like customer support bots, sales bots, IT automation bots, etc. They provide more flexibility and control so that companies can build bots directly into their workflows and integrate them with their existing systems.
The platform segment is anticipated to witness the highest CAGR during the period 2024 – 2032. Such platforms allow the developers of businesses to produce and implement bots without much technological comprehension, particularly small and medium enterprises (SMEs). As adaptation of automation becomes ubiquitous, enterprise platforms, with their scalability, operationalized simplicity, and reduced time-to-market, are being targeted for a much larger segment of the enterprise base.
By Deployment Type
The Cloud segment dominated the Bot Services market with a 65.1% market share in 2023 and is expected to grow at the fastest CAGR from 2024 to 2032. The deployment model using the cloud has grown to be the most fundamental preference of the organization because of its scale, cost-effectiveness & flexibility. With Cloud platforms, organizations can quickly set up and manage their bot services without heavy on-premises infrastructure. The Cloud solutions market is on an upward trend through an increasing need for automation, efficiency, and customer engagement. Cloud-based bots provide organizations with specialized AI technology to seamlessly connect with other cloud services to enable omnichannel support on multiple channels such as websites, mobile apps, and social media amongst others.
By Organization Size
In 2023, Large Enterprises held the Bot Services market share of 61.7%, and are expected to grow with the highest CAGR during the forecast years (2024-2032). These organizations typically have more budget to implement automation and are early adopters of emerging technologies such as AI-based bots. Bots in large enterprises have a huge area of operations be it customer service, HR management, IT operations, helping enterprise-level organizations optimize their processes and making them more efficient. With the global trend of automation becoming increasingly pressing for enterprises, larger corporations will remain the backbone of growth in the bot services market.
By Business Function
In 2023, Sales & Marketing led the Bot Services market with a 34.7% share of the market. This is because bots are being used widely to automate customer interaction, lead generation, targeted marketing, and sales. Bots are mainly used to improve customers' experience by augmenting conversions and providing 24/7 support. This is one of the prime reasons, that has led to the adoption of the bots by the businesses of market solutions and is predicted to gain a higher market share in the coming decades in the retail, eCommerce, and BFSI sectors.
The Human Resource (HR) segment is likely to grow with the highest CAGR during the forecast period 2024–2032, as organizations run automated bots to assist with administrative HR tasks such as recruitment, onboarding, and employee support, amongst others. Because of this increasing demand, chatbots are now being used to perform HR operations that are routine and will help bring operational efficiency in processes like payroll management, benefits enrollment, and responding to employee queries.
By Vertical
In 2023, the Bot Services market shares of BFSI (Banking, Financial Services, and Insurance) stood over 26.7%, primarily because there is a huge demand for automation in customer service, fraud detection, and financial management. Bots are widely used by banks and financial institutions in handling regular customer queries, processing transactions, and data analysis. Moreover, the need for regulatory compliance and security has led to the adoption of AI-powered bots for tasks such as account management, risk assessment, and fraud prevention, which has made the BFSI the most profitable sector for service deployment through bots.
Healthcare & Life Sciences is anticipated to record the fastest CAGR from 2024 to 2032 owing to an increase in the usage of bots for providing patient engagement solutions, appointment scheduling, administrative tasks, and telemedicine among organizations in the sector patient experience, cost-containment, and operational efficiency take center stage, bots are being deployed to facilitate the workflows. AI-powered bots assist healthcare providers in answering patient queries, personalized patient care, and healthcare administration, leading to a massive opportunity. With the growing need for automation and digital transformation in healthcare.
Get Customized Report as per Your Business Requirement - Request For Customized Report
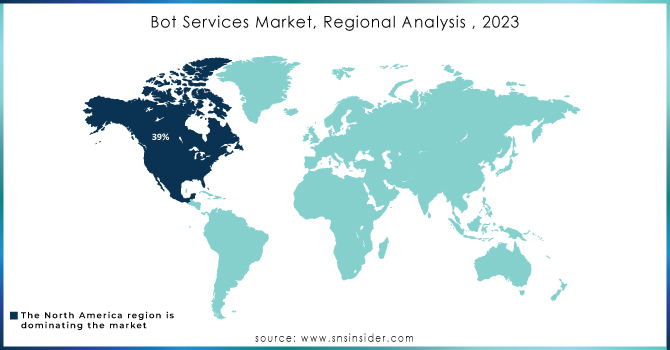
Regional Analysis
In 2023, North America accounted for the largest market share of 33.4% in terms of revenue in the bot services market, owing to the early adoption of automation technologies across different industries. Many tech giants in the region are creating AI-based bots. In domains like BFSI, retail, and customer service, organizations are using bots more and more to achieve operational efficiency, cost savings, and improved customer engagement. North America holds the largest market share in the bot services market with the examples of Bank of America as the banking service using the AI chatbot Erica and Lowe's using bots for customer support and product query.
The Asia Pacific is likely to witness the highest growth during 2024 – 2032 owing to increasing digitalization, technological advancements, and high investments in automation in various sectors such as healthcare, retail, and IT. Emerging markets like China and India are rapidly adopting AI-based bots due to their requirement for low-cost automation solutions. In India, HDFC Bank utilizes AI-based bots for banking inquiries and providing superior customer experience. Alibaba used bots for customer service on its eCommerce platforms in China, demonstrating the increasing acceptance of bot services in the Asia Pacific region.
Key players
Some of the major players in the Bot Services Market are:
-
OpenAI (ChatGPT, DALL·E 3)
-
Google DeepMind (Gemini, Bard)
-
Microsoft (Azure Bot Services, Microsoft Designer)
-
Amazon Web Services (AWS) (Lex, Polly)
-
IBM (Watson Assistant, Watson Discovery)
-
Meta (Llama, Meta AI)
-
Anthropic (Claude, Claude 3.5 Sonnet)
-
Alibaba (Qwen, Qwen2.5-Max)
-
Tencent (Hunyuan, WeChat AI)
-
Baidu (Ernie Bot, DuerOS)
-
ByteDance (Doubao, TikTok AI)
-
Moveworks (AI Platform, Employee Service Platform)
-
Haptik (Enterprise CX Platform, Life Insurance Chatbot)
-
Gupshup (Messaging Platform, Chatbot Development Services)
-
Mondly (Mondly App, Mondly VR)
-
DeepSeek (Janus Pro, AI Models)
-
StepFun (Chatbot Arena, AI Models)
-
Moonshot AI (Kimi Chatbot, k1.5 Model)
-
MiniMax (Talkie Chatbot, Lightning Attention Models)
-
Zhipu (Chatbot, Ying Model)
Recent Trends
-
In January 2025, OpenAI launched ChatGPT Gov, an AI chatbot tailored for U.S. government agencies to enhance productivity and efficiency.
-
In December 2024, Apptronik partnered with Google DeepMind to enhance humanoid robots using advanced AI. This collaboration aims to integrate DeepMind’s AI with Apptronik’s robotics hardware for smarter, more versatile robots.
-
In December 2024, Amazon Connect launched a simplified process for creating conversational AI bots, enabling businesses to design and deploy self-service experiences without coding.
| Report Attributes | Details |
|---|---|
| Market Size in 2023 | USD 17.24 Billion |
| Market Size by 2032 | USD 43.03 Billion |
| CAGR | CAGR of 10.73% From 2024 to 2032 |
| Base Year | 2023 |
| Forecast Period | 2024-2032 |
| Historical Data | 2020-2022 |
| Report Scope & Coverage | Market Size, Segments Analysis, Competitive Landscape, Regional Analysis, DROC & SWOT Analysis, Forecast Outlook |
| Key Segments | • By Solution (Software, Mediation, Services) • By Deployment Type (On-Premises, Cloud) • By Telecom Operator (Mobile Operators, Internet Service Providers (ISPs)) |
| Regional Analysis/Coverage | North America (US, Canada, Mexico), Europe (Eastern Europe [Poland, Romania, Hungary, Turkey, Rest of Eastern Europe] Western Europe] Germany, France, UK, Italy, Spain, Netherlands, Switzerland, Austria, Rest of Western Europe]), Asia Pacific (China, India, Japan, South Korea, Vietnam, Singapore, Australia, Rest of Asia Pacific), Middle East & Africa (Middle East [UAE, Egypt, Saudi Arabia, Qatar, Rest of Middle East], Africa [Nigeria, South Africa, Rest of Africa], Latin America (Brazil, Argentina, Colombia, Rest of Latin America) |
| Company Profiles | Informatica, Oracle, IBM, Collibra, Alation, SAP, Atlan, Erwin, Alex Solutions, Data3Sixty, Infogix, Adaptive, Orion Governance, Dataedo, Microsoft, Talend, Alteryx, Trifacta, MANTA, OvalEdge. |
