image

BMX Bike Market Size:

BMX Bike Market,Revenue Analysis

Get More Information on BMX Bike Market - Request Sample Report

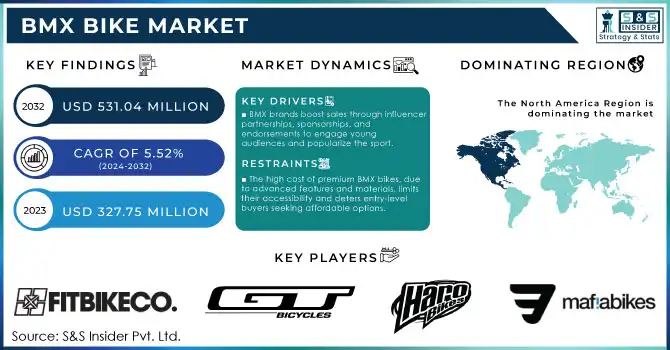
The BMX Bike Market size was estimated at USD 327.75 Million in 2023 and is expected to reach USD 531.04 Million by 2032 at a CAGR of 5.52% during the forecast period of 2024-2032.

The BMX bike market has seen impressive growth, driven by increasing global interest in extreme sports, particularly among younger demographics. BMX biking, known for its unique mix of adrenaline-driven stunts, competitive events, and freestyle skills, has cultivated a dedicated following, which has propelled the market's expansion. The rise in BMX competitions at national and international levels, along with its inclusion in events like the Olympics, has further fueled this growth by enhancing the sport's visibility and attracting a broader audience. Additionally, the popularity of social media platforms, where BMX enthusiasts and influencers share high-energy, visually engaging content, has contributed to raising awareness and excitement around the sport. This online presence not only expands the sport’s fan base but also encourages new riders to adopt BMX biking as a recreational or fitness pursuit, which in turn boosts the demand for BMX bikes. The influence of digital media and an active online community, combined with high-profile sponsorships and endorsements from well-known brands, has solidified BMX biking’s status as a prominent extreme sport.

Furthermore, governments in various countries are increasingly investing in sports infrastructure, such as skate parks and bike parks, which has created more opportunities for BMX riders to practice and perform. These initiatives support community engagement in extreme sports, fostering an environment conducive to the growth of BMX biking. The market also benefits from advancements in bike materials and designs, catering to both recreational users and professional riders, which has broadened BMX's appeal across various skill levels. The BMX bike market is positioned for continued growth due to these influential factors, especially as the sport continues to capture a loyal, youthful audience that values active, adventurous lifestyle. The increased accessibility and promotion of BMX biking through competitive events, media coverage, and supportive infrastructure are expected to keep driving demand, with a robust market expansion forecasted in the coming years.


Feature Description Commercial Products
Durability Built to withstand rigorous use, shocks, and impacts, ensuring longevity under tough riding conditions. Mongoose Legion L100, Redline Flight Pro BMX Bike
Lightweight Frame Made from lightweight yet durable materials for optimal performance during tricks and stunts. SE Racing Big Ripper, Diamondback Grind Pro
Enhanced Grip Equipped with tires that provide better traction on ramps, dirt, and street surfaces. Kenda Kontender BMX Tires, Odyssey Path Pro Tires
Adjustable Handlebars Allows riders to customize the height and angle for comfort and control. Sunday Bikes Pro Series, Fly Bikes Electron Bars
Impact Resistance Designed to absorb high-impact forces from jumps and landings, preventing frame damage. Fit Bike Co. Aitken Frame, Eastern Bikes Thor BMX
Customizable Components Offers a range of customizable parts like wheels, pedals, and grips to suit individual rider needs. S&M Bikes Holmes Complete, Haro Leucadia BMX Bike
Advanced Suspension Features suspension systems that enhance stability and shock absorption during aggressive riding. GT Pro Series Freestyle, BMX bikes with RST Dirt Fork
Aerodynamic Design Optimized for high-speed racing with a streamlined frame that reduces air resistance. Redline MX-24, Supercross BMX NSX Pro Frame
Safety Features Includes safety measures like durable brake systems and reinforced handlebars for rider protection. Shimano DXR Brake Kit, Tektro BMX Brakes
Versatility Designed for both freestyle tricks and competitive racing, offering multi-terrain performance. Kink BMX Complete Bikes, Specialized Fuse BMX Bike

MARKET DYNAMICS

DRIVERS

  • Advancements in materials like carbon fiber and lightweight alloys, along with improved bike designs, are boosting BMX bikes' durability and performance, attracting new riders and driving market growth.

Innovation in BMX bike design and materials is propelling the market, driven by advancements in carbon fiber, lightweight alloys, and frame geometry. Carbon fiber, known for its strength-to-weight ratio, allows BMX bikes to withstand high-impact activities while remaining light enough for improved maneuverability. Likewise, lightweight alloys, such as aluminum and titanium, contribute to reduced weight, enhancing speed and ease of handling. These materials not only improve performance but also increase the lifespan of BMX bikes, making them more appealing to both new users and seasoned riders looking for upgrades. Additionally, innovations in frame design focus on optimizing ergonomics and control, giving riders an edge in competitive sports and extreme biking environments. More compact frame geometries improve balance and handling, appealing to BMX stunt riders and those engaged in high-stakes performances. This trend boosts demand as riders seeks the latest models to gain a competitive edge or improve their recreational experience.

The BMX bike market is experiencing robust growth, with increased participation in biking sports and an expanding consumer base, especially among younger demographics drawn to the adventurous appeal of BMX biking. The industry also benefits from a surge in bike-sharing programs and urban biking initiatives, fueling interest in BMX bikes for leisure and commuting purposes. These factors collectively drive market expansion, as technological advancements in materials and design continue to reshape consumer expectations and encourage both new purchases and model upgrades.

  • BMX brands boost sales by partnering with influencers and athletes to appeal to young audiences, using sponsorships and endorsements to enhance the sport's popularity.

Youth-oriented marketing and sponsorships play a crucial role in shaping the BMX bike market. BMX brands increasingly leverage partnerships with social media influencers and professional athletes, creating targeted promotions that resonate with younger audiences. These collaborations bring BMX culture to social media platforms, where it gains visibility among teenagers and young adults who are attracted to the sport’s dynamic and rebellious image. As a result, social media has become a powerful tool for brands to engage with a wider, more diverse audience that values authenticity and style, central themes in BMX culture.

Sponsorships and endorsements have a significant impact on the market by fueling the aspirational aspects of the sport. When prominent athletes endorse a particular BMX brand, it boosts the brand's credibility and appeal. This can lead to spikes in demand as young riders seek to emulate their favorite athletes, helping the market expand in tandem with increased participation in BMX sports. According to research, there’s been a steady rise in BMX sports’ global visibility due to high-profile competitions and BMX’s inclusion in major sports events, including the Olympics. Youth interest in extreme sports has surged by approximately 20% over the past five years, and the demand for BMX bikes reflects this trend. With sustained brand engagement, strategic sponsorships, and active promotion across social media, the BMX bike market continues to thrive, fueled by a vibrant youth culture that aligns with the sport's high-energy lifestyle.

RESTRAIN

  • The high cost of premium BMX bikes, due to advanced features and materials, limits their accessibility and deters entry-level buyers seeking affordable options.

The high cost of high-end BMX bikes is a significant restraint on the market. Premium BMX bikes, often made from advanced materials like carbon fiber or lightweight aluminum, come equipped with specialized features such as custom-built frames, top-tier suspension systems, and high-performance wheels. These bikes can cost several hundred to over a thousand dollars, making them unaffordable for many potential buyers, particularly those in the entry-level segment or those looking for more budget-friendly options. While these advanced models offer superior durability, speed, and handling, their high prices limit their accessibility to a broader audience, especially among younger or recreational riders who may not prioritize professional-level features.

The cost factor is especially pertinent in markets where consumers may already be hesitant to invest in niche sports equipment like BMX bikes. According to research, while cycling is popular, the most common price range for bikes purchased by individuals is between USD 400 and USD 700, which is well below the price point of high-end BMX bikes. This price disparity can create a gap between what is desired by enthusiasts and what is feasible for the average consumer, ultimately hindering the widespread adoption of premium BMX models. Additionally, this high price tag can affect the repeat purchase rate, as many riders may opt for more affordable models that still meet their recreational or beginner-level needs.

KEY SEGMENTATION ANALYSIS

By Application

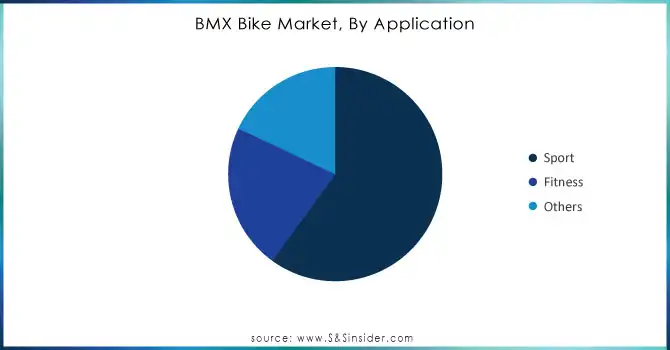
The Sports segment dominated the market with 60% of market share in 2023 and is anticipated to maintain its lead in the coming years. This dominance is primarily driven by the extensive use of BMX bikes in bicycle motocross racing and off-road sports, which remain the core applications for these bikes. BMX racing, in particular, has gained significant traction globally, with more countries promoting competitive events and fostering youth participation. As the sport continues to grow in popularity, particularly in regions with emerging BMX cultures, the demand for high-performance bikes designed for racing and off-road activities is expected to rise. Additionally, the increasing interest in outdoor and adventure sports, coupled with rising awareness of the health benefits of cycling, further supports the segment's growth. 
BMX-Bike-Market-By-Application

Need Any Customization Research On BMX Bike Market - Inquiry Now

By Distribution Channel

In 2023, the online segment dominated with over 37% of the market share. The growth of e-commerce and direct-to-consumer sales has significantly reshaped the way BMX bikes are sold. Online platforms offer brands a global reach, enabling them to tap into markets beyond their physical presence. Consumers increasingly prefer the convenience of shopping from home, where they can compare prices, explore a wide range of options, and read reviews before making a purchase. Additionally, online retailers often provide competitive pricing, promotions, and discounts that attract budget-conscious buyers. The ease of browsing through various brands and models from the comfort of one's home further boosts online sales, making it the leading distribution channel in the BMX bike market. 

KEY REGIONAL ANALYSIS

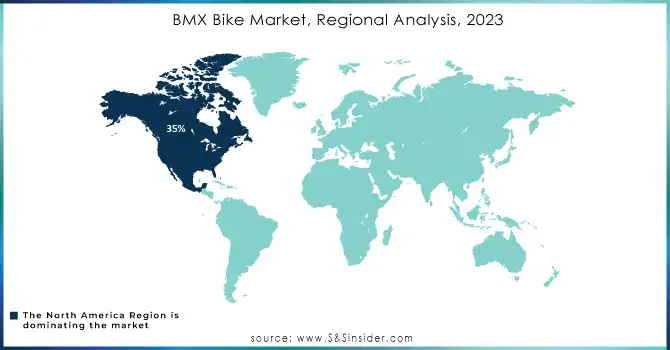
In 2023, North America segment dominated the market with 35% of the market share, largely driven by strong consumer demand for outdoor recreational activities like cycling, paddle surfing, and bike riding, particularly in the U.S. and Canada. The region’s deep cultural affinity for cycling and its well-established outdoor sports infrastructure have been key contributors to this dominance. As more consumers embrace these activities, the demand for BMX bikes continues to rise, boosting market revenue. North America also benefits from a high level of disposable income, making it easier for consumers to invest in recreational equipment. This, combined with a growing trend of outdoor fitness and adventure sports, is expected to sustain and even expand BMX bike sales in the region.

Asia Pacific holds the largest market share in the BMX bike market and is expected to grow at the highest CAGR during the forecast period. This growth is driven by rising disposable incomes and the increasing popularity of BMX biking. Additionally, the region benefits from a youthful, active population, particularly in countries like China and India, where awareness of BMX biking is rising.
BMX-Bike-Market-Regional-Analysis-2023

Some of the major key players of BMX Bike Market

  • Elite BMX (U.S.) – BMX frames, bikes, and components.

  • Fitbikeco (U.S.) – BMX bikes, frames, forks, handlebars, and parts.

  • G.T. Bicycle (U.S.) – BMX bikes, frames, and parts.

  • Haro Bicycle Corporation (U.S.) – BMX bikes, frames, handlebars, and accessories.

  • KINK BMX (U.S.) – BMX bikes, frames, parts, and accessories.

  • Mafiabike (U.K.) – BMX bikes, frames, and parts.

  • Pacific Cycle, Inc. (U.S.) – BMX bikes, frames, and parts.

  • Redline Bicycles (U.S.) – BMX bikes, frames, and components.

  • Stolen BMX (U.S.) – BMX bikes, frames, and parts.

  • Sunday Bikes (U.S.) – BMX bikes, frames, forks, and components.

  • DK Bicycles (U.S.) – BMX bikes, frames, handlebars, and accessories.

  • WeThePeople (Germany) – BMX bikes, frames, and parts.

  • Sunday Bikes (U.S.) – BMX bikes, components, and parts.

  • Subrosa Brand (U.S.) – BMX bikes, frames, wheels, and accessories.

  • Animal Bikes (U.S.) – BMX bikes, frames, parts, and accessories.

  • Trek Bicycle Corporation (U.S.) – BMX bikes and accessories.

  • Eastern Bikes (U.S.) – BMX bikes, frames, wheels, and accessories.

  • Cult BMX (U.S.) – BMX bikes, frames, and parts.

  • Se Bikes (U.S.) – BMX bikes, frames, and parts.

  • Felt Bicycles (U.S.) – BMX bikes and parts.

These suppliers supply BMX bikes and related components to riders around the world, catering to both entry-level enthusiasts and professional BMX riders of BMX Bike Market

  • Haro Bikes

  • Mongoose

  • GT Bicycles

  • Redline Bicycles

  • Kink BMX

  • DK Bicycles

  • WeThePeople

  • Fit Bike Co.

  • SE Bikes

  • Subrosa Brand

RECENT DEVELOPMENT

In October 2023: Haro Bikes announced plans to bring a new line of electric BMX bikes to the North American market. The lineup will feature a variety of models, including freestyle, racing, and street-focused electric BMX bikes. With an emphasis on sustainability and performance, Haro Bikes aims to meet the rising demand for eco-friendly transportation options in urban areas.

In February 2024: Chimera BMX introduced an affordable steel version of its highly sought-after titanium e-BMX. The Los Angeles-based startup unveiled a hand-built, all-black steel 24" electric BMX, featuring a powerful 3800-watt motor, reaching top speeds of 35 mph, while maintaining a lightweight design of just 45 lbs.

In February 2024: Evolve Skateboards launched its first electric bike, Project BMX, in the U.K. Staying true to the BMX style, Evolve integrated the battery within the saddle and incorporated a Bafang M560 Mid Drive Motor into the frame. This innovative model blends electric technology with traditional BMX geometry, offering a distinct option for personal electric mobility.

BMX Bike Market Report Scope:

Report Attributes Details
Market Size in 2023 USD 327.75 Million 
Market Size by 2032 USD 531.04 Million 
CAGR CAGR of 5.52% From 2024 to 2032
Base Year 2023
Forecast Period 2024-2032
Historical Data 2020-2022
Report Scope & Coverage Market Size, Segments Analysis, Competitive  Landscape, Regional Analysis, DROC & SWOT Analysis, Forecast Outlook
Key Segments • By Application (Sport, Fitness, Others)
• By Distribution Channel (Online, Offline)
• By Top Tube Length (Less than 18 Inches, 18 - 20 Inches, 20 - 22 Inches, 22 Inches & Above)
• By Category (Street, Dirt)
Regional Analysis/Coverage North America (US, Canada, Mexico), Europe (Eastern Europe [Poland, Romania, Hungary, Turkey, Rest of Eastern Europe] Western Europe] Germany, France, UK, Italy, Spain, Netherlands, Switzerland, Austria, Rest of Western Europe]), Asia Pacific (China, India, Japan, South Korea, Vietnam, Singapore, Australia, Rest of Asia Pacific), Middle East & Africa (Middle East [UAE, Egypt, Saudi Arabia, Qatar, Rest of Middle East], Africa [Nigeria, South Africa, Rest of Africa], Latin America (Brazil, Argentina, Colombia, Rest of Latin America)
Company Profiles Elite BMX (U.S.), Fitbikeco (U.S.), G.T. Bicycle (U.S.), Haro Bicycle Corporation (U.S.), KINK BMX (U.S.), Mafiabike (U.K.), Pacific Cycle, Inc. (U.S.), Redline Bicycles (U.S.), Stolen BMX (U.S.), Sunday Bikes (U.S.), DK Bicycles (U.S.), WeThePeople (Germany), Subrosa Brand (U.S.), Animal Bikes (U.S.), Trek Bicycle Corporation (U.S.), Eastern Bikes (U.S.), Cult BMX (U.S.), Se Bikes (U.S.), Felt Bicycles (U.S.).
Key Drivers • BMX biking's inclusion in the Summer Olympics has boosted its global popularity, driving increased demand for bikes, particularly among youth and competitive athletes.
• As health-conscious consumers increasingly prioritize physical activity, cycling, including BMX biking, is gaining popularity, particularly in urban areas as a recreational choice.
Restraints • The high cost of premium BMX bikes, due to advanced features and materials, limits their accessibility and deters entry-level buyers seeking affordable options

Frequently Asked Questions

Ans:  The BMX Bike Market is expected to grow at a CAGR of 5.52% during 2024-2032.

Ans: The BMX Bike Market was USD 327.75 Million in 2023 and is expected to Reach USD 531.04 Million by 2032.

Ans: BMX biking's inclusion in the Summer Olympics has boosted its global popularity, driving increased demand for bikes, particularly among youth and competitive athletes.

Ans: The “Sports” segment dominated the BMX Bike Market.

Ans: North America dominated the BMX Bike Market in 2023.

Table of Contents

1. Introduction

1.1 Market Definition

1.2 Scope (Inclusion and Exclusions)

1.3 Research Assumptions

2. Executive Summary

2.1 Market Overview

2.2 Regional Synopsis

2.3 Competitive Summary

3. Research Methodology

3.1 Top-Down Approach

3.2 Bottom-up Approach

3.3. Data Validation

3.4 Primary Interviews

4. Market Dynamics Impact Analysis

4.1 Market Driving Factors Analysis

4.1.1 Drivers

4.1.2 Restraints

4.1.3 Opportunities

4.1.4 Challenges

4.2 PESTLE Analysis

4.3 Porter’s Five Forces Model

5. Statistical Insights and Trends Reporting

5.1 Vehicle Production and Sales Volumes, 2020-2032, by Region

5.2 Vehicle Technology Adoption, by Region

5.3 Consumer Preferences, by Region

5.4 Aftermarket Trends (Data on vehicle maintenance, parts, and services)

6. Competitive Landscape

6.1 List of Major Companies, By Region

6.2 Market Share Analysis, By Region

6.3 Product Benchmarking

6.3.1 Product specifications and features

6.3.2 Pricing

6.4 Strategic Initiatives

6.4.1 Marketing and promotional activities

6.4.2 Distribution and supply chain strategies

6.4.3 Expansion plans and new product launches

6.4.4 Strategic partnerships and collaborations

6.5 Technological Advancements

6.6 Market Positioning and Branding

7. BMX Bike Market Segmentation, By Application

7.1 Chapter Overview

7.2 Sport

7.2.1 Sport Market Trends Analysis (2020-2032)

7.2.2 Sport Market Size Estimates and Forecasts to 2032 (USD Million)

7.3 Fitness

7.3.1 Fitness t Market Trends Analysis (2020-2032)

7.3.2 Fitness Market Size Estimates and Forecasts to 2032 (USD Million)

7.4 Others

7.4.1 Others Market Trends Analysis (2020-2032)

7.4.2 Others Market Size Estimates and Forecasts to 2032 (USD Million)

8. BMX Bike Market Segmentation, By Distribution Channel

8.1 Chapter Overview

     8.2 Online

8.2.1 Online Market Trends Analysis (2020-2032)

8.2.2 Online Market Size Estimates and Forecasts to 2032 (USD Million)

8.3 Offline

8.3.1 Offline Market Trends Analysis (2020-2032)

8.3.2 Offline Market Size Estimates and Forecasts to 2032 (USD Million)

9. BMX Bike Market Segmentation, By Top Tube Length

9.1 Chapter Overview

9.2 Less than 18 Inches

9.2.1 Less than 18 Inches Market Trends Analysis (2020-2032)

9.2.2 Less than 18 Inches Market Size Estimates and Forecasts to 2032 (USD Million)

9.3 18 - 20 Inches

9.3.1 18 - 20 Inches Market Trends Analysis (2020-2032)

9.3.2 18 - 20 Inches Market Size Estimates and Forecasts to 2032 (USD Million)

9.4 20 - 22 Inches

9.4.1 20 - 22 Inches Market Trends Analysis (2020-2032)

9.4.2 20 - 22 Inches Market Size Estimates and Forecasts to 2032 (USD Million)

9.5 22 Inches & Above

9.5.1 22 Inches & Above Market Trends Analysis (2020-2032)

9.5.2 22 Inches & Above Market Size Estimates and Forecasts to 2032 (USD Million)

10. BMX Bike Market Segmentation, By Category

10.1 Chapter Overview

10.2 Street

10.2.1 Street Market Trends Analysis (2020-2032)

10.2.2 Street Market Size Estimates and Forecasts to 2032 (USD Million)

10.3 Dirt

10.3.1 Dirt Market Trends Analysis (2020-2032)

10.3.2 Dirt Market Size Estimates and Forecasts to 2032 (USD Million)

11. Regional Analysis

11.1 Chapter Overview

11.2 North America

11.2.1 Trends Analysis

11.2.2 North America BMX Bike Market Estimates and Forecasts, by Country (2020-2032) (USD Million)

11.2.3 North America BMX Bike Market Estimates and Forecasts, By Application (2020-2032) (USD Million)  

11.2.4 North America BMX Bike Market Estimates and Forecasts, By Distribution Channel (2020-2032) (USD Million)

11.2.5 North America BMX Bike Market Estimates and Forecasts, By Top Tube Length (2020-2032) (USD Million)

11.2.6 North America BMX Bike Market Estimates and Forecasts, By Category (2020-2032) (USD Million)

11.2.7 USA

11.2.7.1 USA BMX Bike Market Estimates and Forecasts, By Application (2020-2032) (USD Million)

11.2.7.2 USA BMX Bike Market Estimates and Forecasts, By Distribution Channel (2020-2032) (USD Million)

11.2.7.3 USA BMX Bike Market Estimates and Forecasts, By Top Tube Length (2020-2032) (USD Million)

11.2.7.4 USA BMX Bike Market Estimates and Forecasts, By Category (2020-2032) (USD Million)

11.2.8 Canada

11.2.8.1 Canada BMX Bike Market  Estimates and Forecasts, By Application (2020-2032) (USD Million)

11.2.8.2 Canada BMX Bike Market Estimates and Forecasts, By Distribution Channel (2020-2032) (USD Million)

11.2.8.3 Canada BMX Bike Market Estimates and Forecasts, By Top Tube Length (2020-2032) (USD Million)

11.2.8.4 Canada BMX Bike Market Estimates and Forecasts, By Category (2020-2032) (USD Million)

11.2.9 Mexico

11.2.9.1 Mexico BMX Bike Market Estimates and Forecasts, By Application (2020-2032) (USD Million)

11.2.9.2 Mexico BMX Bike Market Estimates and Forecasts, By Distribution Channel (2020-2032) (USD Million)

11.2.9.3 Mexico BMX Bike Market Estimates and Forecasts, By Top Tube Length (2020-2032) (USD Million)

11.2.9.4 Mexico BMX Bike Market Estimates and Forecasts, By Category (2020-2032) (USD Million)

11.3 Europe

11.3.1 Eastern Europe

11.3.1.1 Trends Analysis

11.3.1.2 Eastern Europe BMX Bike Market Estimates and Forecasts, by Country (2020-2032) (USD Million)

11.3.1.3 Eastern Europe BMX Bike Market Estimates and Forecasts, By Application (2020-2032) (USD Million)  

11.3.1.4 Eastern Europe BMX Bike Market Estimates and Forecasts, By Distribution Channel (2020-2032) (USD Million)

11.3.1.5 Eastern Europe BMX Bike Market Estimates and Forecasts, By Top Tube Length (2020-2032) (USD Million)

11.3.1.6 Eastern Europe BMX Bike Market Estimates and Forecasts, By Category (2020-2032) (USD Million)

11.3.1.7 Poland

11.3.1.7.1 Poland BMX Bike Market Estimates and Forecasts, By Application (2020-2032) (USD Million)

11.3.1.7.2 Poland BMX Bike Market Estimates and Forecasts, By Distribution Channel (2020-2032) (USD Million)

11.3.1.7.3 Poland BMX Bike Market Estimates and Forecasts, By Top Tube Length (2020-2032) (USD Million)

11.3.1.7.4 Poland BMX Bike Market Estimates and Forecasts, By Category (2020-2032) (USD Million)

11.3.1.8 Romania

11.3.1.8.1 Romania BMX Bike Market Estimates and Forecasts, By Application (2020-2032) (USD Million)

11.3.1.8.2 Romania BMX Bike Market Estimates and Forecasts, By Distribution Channel (2020-2032) (USD Million)

11.3.1.8.3 Romania BMX Bike Market Estimates and Forecasts, By Top Tube Length (2020-2032) (USD Million)

11.3.1.8.4 Romania BMX Bike Market Estimates and Forecasts, By Category (2020-2032) (USD Million)

11.3.1.9 Hungary

11.3.1.9.1 Hungary BMX Bike Market Estimates and Forecasts, By Application (2020-2032) (USD Million)

11.3.1.9.2 Hungary BMX Bike Market Estimates and Forecasts, By Distribution Channel (2020-2032) (USD Million)

11.3.1.9.3 Hungary BMX Bike Market Estimates and Forecasts, By Top Tube Length (2020-2032) (USD Million)

11.3.1.9.4 Hungary BMX Bike Market Estimates and Forecasts, By Category (2020-2032) (USD Million)

11.3.1.10 Turkey

11.3.1.10.1 Turkey BMX Bike Market Estimates and Forecasts, By Application (2020-2032) (USD Million)

11.3.1.10.2 Turkey BMX Bike Market Estimates and Forecasts, By Distribution Channel (2020-2032) (USD Million)

11.3.1.10.3 Turkey BMX Bike Market Estimates and Forecasts, By Top Tube Length (2020-2032) (USD Million)

11.3.1.10.4 Turkey BMX Bike Market Estimates and Forecasts, By Category (2020-2032) (USD Million)

11.3.1.11 Rest of Eastern Europe

11.3.1.11.1 Rest of Eastern Europe BMX Bike Market Estimates and Forecasts, By Application (2020-2032) (USD Million)

11.3.1.11.2 Rest of Eastern Europe BMX Bike Market Estimates and Forecasts, By Distribution Channel (2020-2032) (USD Million)

11.3.1.11.3 Rest of Eastern Europe BMX Bike Market Estimates and Forecasts, By Top Tube Length (2020-2032) (USD Million)

11.3.1.11.4 Rest of Eastern Europe BMX Bike Market Estimates and Forecasts, By Category (2020-2032) (USD Million)

11.3.2 Western Europe

11.3.2.1 Trends Analysis

11.3.2.2 Western Europe BMX Bike Market Estimates and Forecasts, by Country (2020-2032) (USD Million)

11.3.2.3 Western Europe BMX Bike Market Estimates and Forecasts, By Application (2020-2032) (USD Million)  

11.3.2.4 Western Europe BMX Bike Market Estimates and Forecasts, By Distribution Channel (2020-2032) (USD Million)

11.3.2.5 Western Europe BMX Bike Market Estimates and Forecasts, By Top Tube Length (2020-2032) (USD Million)

11.3.2.6 Western Europe BMX Bike Market Estimates and Forecasts, By Category (2020-2032) (USD Million)

11.3.2.7 Germany

11.3.2.7.1 Germany BMX Bike Market Estimates and Forecasts, By Application (2020-2032) (USD Million)

11.3.2.7.2 Germany BMX Bike Market Estimates and Forecasts, By Distribution Channel (2020-2032) (USD Million)

11.3.2.7.3 Germany BMX Bike Market Estimates and Forecasts, By Top Tube Length (2020-2032) (USD Million)

11.3.2.7.4 Germany BMX Bike Market Estimates and Forecasts, By Category (2020-2032) (USD Million)

11.3.2.8 France

11.3.2.8.1 France BMX Bike Market Estimates and Forecasts, By Application (2020-2032) (USD Million)

11.3.2.8.2 France BMX Bike Market Estimates and Forecasts, By Distribution Channel (2020-2032) (USD Million)

11.3.2.8.3 France BMX Bike Market Estimates and Forecasts, By Top Tube Length (2020-2032) (USD Million)

11.3.2.8.4 France BMX Bike Market Estimates and Forecasts, By Category (2020-2032) (USD Million)

11.3.2.9 UK

11.3.2.9.1 UK BMX Bike Market Estimates and Forecasts, By Application (2020-2032) (USD Million)

11.3.2.9.2 UK BMX Bike Market Estimates and Forecasts, By Distribution Channel (2020-2032) (USD Million)

11.3.2.9.3 UK BMX Bike Market Estimates and Forecasts, By Top Tube Length (2020-2032) (USD Million)

11.3.2.9.4 UK BMX Bike Market Estimates and Forecasts, By Category (2020-2032) (USD Million)

11.3.2.10 Italy

11.3.2.10.1 Italy BMX Bike Market Estimates and Forecasts, By Application (2020-2032) (USD Million)

11.3.2.10.2 Italy BMX Bike Market Estimates and Forecasts, By Distribution Channel (2020-2032) (USD Million)

11.3.2.10.3 Italy BMX Bike Market Estimates and Forecasts, By Top Tube Length (2020-2032) (USD Million)

11.3.2.10.4 Italy BMX Bike Market Estimates and Forecasts, By Category (2020-2032) (USD Million)

11.3.2.11 Spain

11.3.2.11.1 Spain BMX Bike Market Estimates and Forecasts, By Application (2020-2032) (USD Million)

11.3.2.11.2 Spain BMX Bike Market Estimates and Forecasts, By Distribution Channel (2020-2032) (USD Million)

11.3.2.11.3 Spain BMX Bike Market Estimates and Forecasts, By Top Tube Length (2020-2032) (USD Million)

11.3.2.11.4 Spain BMX Bike Market Estimates and Forecasts, By Category (2020-2032) (USD Million)

11.3.2.12 Netherlands

11.3.2.12.1 Netherlands BMX Bike Market Estimates and Forecasts, By Application (2020-2032) (USD Million)

11.3.2.12.2 Netherlands BMX Bike Market Estimates and Forecasts, By Distribution Channel (2020-2032) (USD Million)

11.3.2.12.3 Netherlands BMX Bike Market Estimates and Forecasts, By Top Tube Length (2020-2032) (USD Million)

11.3.2.12.4 Netherlands BMX Bike Market Estimates and Forecasts, By Category (2020-2032) (USD Million)

11.3.2.13 Switzerland

11.3.2.13.1 Switzerland BMX Bike Market Estimates and Forecasts, By Application (2020-2032) (USD Million)

11.3.2.13.2 Switzerland BMX Bike Market Estimates and Forecasts, By Distribution Channel (2020-2032) (USD Million)

11.3.2.13.3 Switzerland BMX Bike Market Estimates and Forecasts, By Top Tube Length (2020-2032) (USD Million)

11.3.2.13.4 Switzerland BMX Bike Market Estimates and Forecasts, By Category (2020-2032) (USD Million)

11.3.2.14 Austria

11.3.2.14.1 Austria BMX Bike Market Estimates and Forecasts, By Application (2020-2032) (USD Million)

11.3.2.14.2 Austria BMX Bike Market Estimates and Forecasts, By Distribution Channel (2020-2032) (USD Million)

11.3.2.14.3 Austria BMX Bike Market Estimates and Forecasts, By Top Tube Length (2020-2032) (USD Million)

11.3.2.14.4 Austria BMX Bike Market Estimates and Forecasts, By Category (2020-2032) (USD Million)

11.3.2.15 Rest of Western Europe

11.3.2.15.1 Rest of Western Europe BMX Bike Market Estimates and Forecasts, By Application (2020-2032) (USD Million)

11.3.2.15.2 Rest of Western Europe BMX Bike Market Estimates and Forecasts, By Distribution Channel (2020-2032) (USD Million)

11.3.2.15.3 Rest of Western Europe BMX Bike Market Estimates and Forecasts, By Top Tube Length (2020-2032) (USD Million)

11.3.2.15.4 Rest of Western Europe BMX Bike Market Estimates and Forecasts, By Category (2020-2032) (USD Million)

11.4 Asia Pacific

11.4.1 Trends Analysis

11.4.2 Asia Pacific BMX Bike Market Estimates and Forecasts, by Country (2020-2032) (USD Million)

11.4.3 Asia Pacific BMX Bike Market Estimates and Forecasts, By Application (2020-2032) (USD Million)  

11.4.4 Asia Pacific BMX Bike Market Estimates and Forecasts, By Distribution Channel (2020-2032) (USD Million)

11.4.5 Asia Pacific BMX Bike Market Estimates and Forecasts, By Top Tube Length (2020-2032) (USD Million)

11.4.6 Asia Pacific BMX Bike Market Estimates and Forecasts, By Category (2020-2032) (USD Million)

11.4.7 China

11.4.7.1 China BMX Bike Market Estimates and Forecasts, By Application (2020-2032) (USD Million)

11.4.7.2 China BMX Bike Market Estimates and Forecasts, By Distribution Channel (2020-2032) (USD Million)

11.4.7.3 China BMX Bike Market Estimates and Forecasts, By Top Tube Length (2020-2032) (USD Million)

11.4.7.4 China BMX Bike Market Estimates and Forecasts, By Category (2020-2032) (USD Million)

11.4.8 India

11.4.8.1 India BMX Bike Market Estimates and Forecasts, By Application (2020-2032) (USD Million)

11.4.8.2 India BMX Bike Market Estimates and Forecasts, By Distribution Channel (2020-2032) (USD Million)

11.4.8.3 India BMX Bike Market Estimates and Forecasts, By Top Tube Length (2020-2032) (USD Million)

11.4.8.4 India BMX Bike Market Estimates and Forecasts, By Category (2020-2032) (USD Million)

11.4.9 Japan

11.4.9.1 Japan BMX Bike Market Estimates and Forecasts, By Application (2020-2032) (USD Million)

11.4.9.2 Japan BMX Bike Market Estimates and Forecasts, By Distribution Channel (2020-2032) (USD Million)

11.4.9.3 Japan BMX Bike Market Estimates and Forecasts, By Top Tube Length (2020-2032) (USD Million)

11.4.9.4 Japan BMX Bike Market Estimates and Forecasts, By Category (2020-2032) (USD Million)

11.4.10 South Korea

11.4.10.1 South Korea BMX Bike Market Estimates and Forecasts, By Application (2020-2032) (USD Million)

11.4.10.2 South Korea BMX Bike Market Estimates and Forecasts, By Distribution Channel (2020-2032) (USD Million)

11.4.10.3 South Korea BMX Bike Market Estimates and Forecasts, By Top Tube Length (2020-2032) (USD Million)

11.4.10.4 South Korea BMX Bike Market Estimates and Forecasts, By Category (2020-2032) (USD Million)

11.4.11 Vietnam

11.4.11.1 Vietnam BMX Bike Market Estimates and Forecasts, By Application (2020-2032) (USD Million)

11.4.11.2 Vietnam BMX Bike Market Estimates and Forecasts, By Distribution Channel (2020-2032) (USD Million)

11.4.11.3 Vietnam BMX Bike Market Estimates and Forecasts, By Top Tube Length (2020-2032) (USD Million)

11.4.11.4 Vietnam BMX Bike Market Estimates and Forecasts, By Category (2020-2032) (USD Million)

11.4.12 Singapore

11.4.12.1 Singapore BMX Bike Market Estimates and Forecasts, By Application (2020-2032) (USD Million)

11.4.12.2 Singapore BMX Bike Market Estimates and Forecasts, By Distribution Channel (2020-2032) (USD Million)

11.4.12.3 Singapore BMX Bike Market Estimates and Forecasts, By Top Tube Length (2020-2032) (USD Million)

11.4.12.4 Singapore BMX Bike Market Estimates and Forecasts, By Category (2020-2032) (USD Million)

11.4.13 Australia

11.4.13.1 Australia BMX Bike Market Estimates and Forecasts, By Application (2020-2032) (USD Million)

11.4.13.2 Australia BMX Bike Market Estimates and Forecasts, By Distribution Channel (2020-2032) (USD Million)

11.4.13.3 Australia BMX Bike Market Estimates and Forecasts, By Top Tube Length (2020-2032) (USD Million)

11.4.13.4 Australia BMX Bike Market Estimates and Forecasts, By Category (2020-2032) (USD Million)

11.4.14 Rest of Asia Pacific

11.4.14.1 Rest of Asia Pacific BMX Bike Market Estimates and Forecasts, By Application (2020-2032) (USD Million)

11.4.14.2 Rest of Asia Pacific BMX Bike Market Estimates and Forecasts, By Distribution Channel (2020-2032) (USD Million)

11.4.14.3 Rest of Asia Pacific BMX Bike Market Estimates and Forecasts, By Top Tube Length (2020-2032) (USD Million)

11.4.14.4 Rest of Asia Pacific BMX Bike Market Estimates and Forecasts, By Category (2020-2032) (USD Million)

11.5 Middle East and Africa

11.5.1 Middle East

11.5.1.1 Trends Analysis

11.5.1.2 Middle East BMX Bike Market Estimates and Forecasts, by Country (2020-2032) (USD Million)

11.5.1.3 Middle East BMX Bike Market Estimates and Forecasts, By Application (2020-2032) (USD Million)  

11.5.1.4 Middle East BMX Bike Market Estimates and Forecasts, By Distribution Channel (2020-2032) (USD Million)

11.5.1.5 Middle East BMX Bike Market Estimates and Forecasts, By Top Tube Length (2020-2032) (USD Million)

11.5.1.6 Middle East BMX Bike Market Estimates and Forecasts, By Category (2020-2032) (USD Million)

11.5.1.7 UAE

11.5.1.7.1 UAE BMX Bike Market Estimates and Forecasts, By Application (2020-2032) (USD Million)

11.5.1.7.2 UAE BMX Bike Market Estimates and Forecasts, By Distribution Channel (2020-2032) (USD Million)

11.5.1.7.3 UAE BMX Bike Market Estimates and Forecasts, By Top Tube Length (2020-2032) (USD Million)

11.5.1.7.4 UAE BMX Bike Market Estimates and Forecasts, By Category (2020-2032) (USD Million)

11.5.1.8 Egypt

11.5.1.8.1 Egypt BMX Bike Market Estimates and Forecasts, By Application (2020-2032) (USD Million)

11.5.1.8.2 Egypt BMX Bike Market Estimates and Forecasts, By Distribution Channel (2020-2032) (USD Million)

11.5.1.8.3 Egypt BMX Bike Market Estimates and Forecasts, By Top Tube Length (2020-2032) (USD Million)

11.5.1.8.4 Egypt BMX Bike Market Estimates and Forecasts, By Category (2020-2032) (USD Million)

11.5.1.9 Saudi Arabia

11.5.1.9.1 Saudi Arabia BMX Bike Market Estimates and Forecasts, By Application (2020-2032) (USD Million)

11.5.1.9.2 Saudi Arabia BMX Bike Market Estimates and Forecasts, By Distribution Channel (2020-2032) (USD Million)

11.5.1.9.3 Saudi Arabia BMX Bike Market Estimates and Forecasts, By Top Tube Length (2020-2032) (USD Million)

11.5.1.9.4 Saudi Arabia BMX Bike Market Estimates and Forecasts, By Category (2020-2032) (USD Million)

11.5.1.10 Qatar

11.5.1.10.1 Qatar BMX Bike Market Estimates and Forecasts, By Application (2020-2032) (USD Million)

11.5.1.10.2 Qatar BMX Bike Market Estimates and Forecasts, By Distribution Channel (2020-2032) (USD Million)

11.5.1.10.3 Qatar BMX Bike Market Estimates and Forecasts, By Top Tube Length (2020-2032) (USD Million)

11.5.1.10.4 Qatar BMX Bike Market Estimates and Forecasts, By Category (2020-2032) (USD Million)

11.5.1.11 Rest of Middle East

11.5.1.11.1 Rest of Middle East BMX Bike Market Estimates and Forecasts, By Application (2020-2032) (USD Million)

11.5.1.11.2 Rest of Middle East BMX Bike Market Estimates and Forecasts, By Distribution Channel (2020-2032) (USD Million)

11.5.1.11.3 Rest of Middle East BMX Bike Market Estimates and Forecasts, By Top Tube Length (2020-2032) (USD Million)

11.5.1.11.4 Rest of Middle East BMX Bike Market Estimates and Forecasts, By Category (2020-2032) (USD Million)

11.5.2 Africa

11.5.2.1 Trends Analysis

11.5.2.2 Africa BMX Bike Market Estimates and Forecasts, by Country (2020-2032) (USD Million)

11.5.2.3 Africa BMX Bike Market Estimates and Forecasts, By Application (2020-2032) (USD Million)  

11.5.2.4 Africa BMX Bike Market Estimates and Forecasts, By Distribution Channel (2020-2032) (USD Million)

11.5.2.5 Africa BMX Bike Market Estimates and Forecasts, By Top Tube Length (2020-2032) (USD Million)

11.5.2.6 Africa BMX Bike Market Estimates and Forecasts, By Category (2020-2032) (USD Million)

11.5.2.7 South Africa

11.5.2.7.1 South Africa BMX Bike Market Estimates and Forecasts, By Application (2020-2032) (USD Million)

11.5.2.7.2 South Africa BMX Bike Market Estimates and Forecasts, By Distribution Channel (2020-2032) (USD Million)

11.5.2.7.3 South Africa BMX Bike Market Estimates and Forecasts, By Top Tube Length (2020-2032) (USD Million)

11.5.2.7.4 South Africa BMX Bike Market Estimates and Forecasts, By Category (2020-2032) (USD Million)

11.5.2.8 Nigeria

11.5.2.8.1 Nigeria BMX Bike Market Estimates and Forecasts, By Application (2020-2032) (USD Million)

11.5.2.8.2 Nigeria BMX Bike Market Estimates and Forecasts, By Distribution Channel (2020-2032) (USD Million)

11.5.2.8.3 Nigeria BMX Bike Market Estimates and Forecasts, By Top Tube Length (2020-2032) (USD Million)

11.5.2.8.4 Nigeria BMX Bike Market Estimates and Forecasts, By Category (2020-2032) (USD Million)

11.5.2.9 Rest of Africa

11.5.2.9.1 Rest of Africa BMX Bike Market Estimates and Forecasts, By Application (2020-2032) (USD Million)

11.5.2.9.2 Rest of Africa BMX Bike Market Estimates and Forecasts, By Distribution Channel (2020-2032) (USD Million)

11.5.2.9.3 Rest of Africa BMX Bike Market Estimates and Forecasts, By Top Tube Length (2020-2032) (USD Million)

11.5.2.9.4 Rest of Africa BMX Bike Market Estimates and Forecasts, By Category (2020-2032) (USD Million)

11.6 Latin America

11.6.1 Trends Analysis

11.6.2 Latin America BMX Bike Market Estimates and Forecasts, by Country (2020-2032) (USD Million)

11.6.3 Latin America BMX Bike Market Estimates and Forecasts, By Application (2020-2032) (USD Million)  

11.6.4 Latin America BMX Bike Market Estimates and Forecasts, By Distribution Channel (2020-2032) (USD Million)

11.6.5 Latin America BMX Bike Market Estimates and Forecasts, By Top Tube Length (2020-2032) (USD Million)

11.6.6 Latin America BMX Bike Market Estimates and Forecasts, By Category (2020-2032) (USD Million)

11.6.7 Brazil

11.6.7.1 Brazil BMX Bike Market Estimates and Forecasts, By Application (2020-2032) (USD Million)

11.6.7.2 Brazil BMX Bike Market Estimates and Forecasts, By Distribution Channel (2020-2032) (USD Million)

11.6.7.3 Brazil BMX Bike Market Estimates and Forecasts, By Top Tube Length (2020-2032) (USD Million)

11.6.7.4 Brazil BMX Bike Market Estimates and Forecasts, By Category (2020-2032) (USD Million)

11.6.8 Argentina

11.6.8.1 Argentina BMX Bike Market Estimates and Forecasts, By Application (2020-2032) (USD Million)

11.6.8.2 Argentina BMX Bike Market Estimates and Forecasts, By Distribution Channel (2020-2032) (USD Million)

11.6.8.3 Argentina BMX Bike Market Estimates and Forecasts, By Top Tube Length (2020-2032) (USD Million)

11.6.8.4 Argentina BMX Bike Market Estimates and Forecasts, By Category (2020-2032) (USD Million)

11.6.9 Colombia

11.6.9.1 Colombia BMX Bike Market Estimates and Forecasts, By Application (2020-2032) (USD Million)

11.6.9.2 Colombia BMX Bike Market Estimates and Forecasts, By Distribution Channel (2020-2032) (USD Million)

11.6.9.3 Colombia BMX Bike Market Estimates and Forecasts, By Top Tube Length (2020-2032) (USD Million)

11.6.9.4 Colombia BMX Bike Market Estimates and Forecasts, By Category (2020-2032) (USD Million)

11.6.10 Rest of Latin America

11.6.10.1 Rest of Latin America BMX Bike Market Estimates and Forecasts, By Application (2020-2032) (USD Million)

11.6.10.2 Rest of Latin America BMX Bike Market Estimates and Forecasts, By Distribution Channel (2020-2032) (USD Million)

11.6.10.3 Rest of Latin America BMX Bike Market Estimates and Forecasts, By Top Tube Length (2020-2032) (USD Million)

11.6.10.4 Rest of Latin America BMX Bike Market Estimates and Forecasts, By Category (2020-2032) (USD Million)

12. Company Profiles

12.1 Elite BMX (U.S.)

12.1.1 Company Overview

12.1.2 Financial

12.1.3 Products/ Services Offered

12.1.4 SWOT Analysis

12.2 Fitbikeco (U.S.)

12.2.1 Company Overview

12.2.2 Financial

12.2.3 Products/ Services Offered

12.2.4 SWOT Analysis

12.3 G.T. Bicycle (U.S.)

12.3.1 Company Overview

12.3.2 Financial

12.3.3 Products/ Services Offered

12.3.4 SWOT Analysis

12.4 Haro Bicycle Corporation (U.S.)

12.4.1 Company Overview

12.4.2 Financial

12.4.3 Products/ Services Offered

12.4.4 SWOT Analysis

12.5 KINK BMX (U.S.)

12.5.1 Company Overview

12.5.2 Financial

12.5.3 Products/ Services Offered

12.5.4 SWOT Analysis

12.6 Mafiabike (U.K.)

12.6.1 Company Overview

12.6.2 Financial

12.6.3 Products/ Services Offered

12.6.4 SWOT Analysis

12.7 Pacific Cycle, Inc. (U.S.)

12.7.1 Company Overview

12.7.2 Financial

12.7.3 Products/ Services Offered

12.7.4 SWOT Analysis

12.8 Redline Bicycles (U.S.)

12.8.1 Company Overview

12.8.2 Financial

12.8.3 Products/ Services Offered

12.8.4 SWOT Analysis

12.9 Stolen BMX (U.S.)

12.9.1 Company Overview

12.9.2 Financial

12.9.3 Products/ Services Offered

12.9.4 SWOT Analysis

12.10 Sunday Bikes (U.S.)

12.10.1 Company Overview

12.10.2 Financial

12.10.3 Products/ Services Offered

12.10.4 SWOT Analysis

13. Use Cases and Best Practices

14. Conclusion

An accurate research report requires proper strategizing as well as implementation. There are multiple factors involved in the completion of good and accurate research report and selecting the best methodology to compete the research is the toughest part. Since the research reports we provide play a crucial role in any company’s decision-making process, therefore we at SNS Insider always believe that we should choose the best method which gives us results closer to reality. This allows us to reach at a stage wherein we can provide our clients best and accurate investment to output ratio.

Each report that we prepare takes a timeframe of 350-400 business hours for production. Starting from the selection of titles through a couple of in-depth brain storming session to the final QC process before uploading our titles on our website we dedicate around 350 working hours. The titles are selected based on their current market cap and the foreseen CAGR and growth.


The 5 steps process:

Step 1: Secondary Research:

Secondary Research or Desk Research is as the name suggests is a research process wherein, we collect data through the readily available information. In this process we use various paid and unpaid databases which our team has access to and gather data through the same. This includes examining of listed companies’ annual reports, Journals, SEC filling etc. Apart from this our team has access to various associations across the globe across different industries. Lastly, we have exchange relationships with various university as well as individual libraries.

Secondary Research

Step 2: Primary Research

When we talk about primary research, it is a type of study in which the researchers collect relevant data samples directly, rather than relying on previously collected data.  This type of research is focused on gaining content specific facts that can be sued to solve specific problems. Since the collected data is fresh and first hand therefore it makes the study more accurate and genuine.

We at SNS Insider have divided Primary Research into 2 parts.

Part 1 wherein we interview the KOLs of major players as well as the upcoming ones across various geographic regions. This allows us to have their view over the market scenario and acts as an important tool to come closer to the accurate market numbers. As many as 45 paid and unpaid primary interviews are taken from both the demand and supply side of the industry to make sure we land at an accurate judgement and analysis of the market.

This step involves the triangulation of data wherein our team analyses the interview transcripts, online survey responses and observation of on filed participants. The below mentioned chart should give a better understanding of the part 1 of the primary interview.

Primary Research

Part 2: In this part of primary research the data collected via secondary research and the part 1 of the primary research is validated with the interviews from individual consultants and subject matter experts.

Consultants are those set of people who have at least 12 years of experience and expertise within the industry whereas Subject Matter Experts are those with at least 15 years of experience behind their back within the same space. The data with the help of two main processes i.e., FGDs (Focused Group Discussions) and IDs (Individual Discussions). This gives us a 3rd party nonbiased primary view of the market scenario making it a more dependable one while collation of the data pointers.

Step 3: Data Bank Validation

Once all the information is collected via primary and secondary sources, we run that information for data validation. At our intelligence centre our research heads track a lot of information related to the market which includes the quarterly reports, the daily stock prices, and other relevant information. Our data bank server gets updated every fortnight and that is how the information which we collected using our primary and secondary information is revalidated in real time.

Data Bank Validation

Step 4: QA/QC Process

After all the data collection and validation our team does a final level of quality check and quality assurance to get rid of any unwanted or undesired mistakes. This might include but not limited to getting rid of the any typos, duplication of numbers or missing of any important information. The people involved in this process include technical content writers, research heads and graphics people. Once this process is completed the title gets uploader on our platform for our clients to read it.

Step 5: Final QC/QA Process:

This is the last process and comes when the client has ordered the study. In this process a final QA/QC is done before the study is emailed to the client. Since we believe in giving our clients a good experience of our research studies, therefore, to make sure that we do not lack at our end in any way humanly possible we do a final round of quality check and then dispatch the study to the client.

By Application

  • Sport

  • Fitness

  • Others

By Distribution Channel

  • Online

  • Offline

By Top Tube Length

  • Less than 18 Inches

  • 18 - 20 Inches

  • 20 - 22 Inches

  • 22 Inches & Above

By Category

  • Street

  • Dirt

Request for Segment Customization as per your Business Requirement: Segment Customization Request

Regional Coverage

North America

  • US

  • Canada

  • Mexico

Europe

  • Eastern Europe

    • Poland

    • Romania

    • Hungary

    • Turkey

    • Rest of Eastern Europe

  • Western Europe

    • Germany

    • France

    • UK

    • Italy

    • Spain

    • Netherlands

    • Switzerland

    • Austria

    • Rest of Western Europe

Asia Pacific

  • China

  • India

  • Japan

  • South Korea

  • Vietnam

  • Singapore

  • Australia

  • Rest of Asia Pacific

Middle East & Africa

  • Middle East

    • UAE

    • Egypt

    • Saudi Arabia

    • Qatar

    • Rest of the Middle East

  • Africa

    • Nigeria

    • South Africa

    • Rest of Africa

Latin America

  • Brazil

  • Argentina

  • Colombia

  • Rest of Latin America

Request for Country Level Research Report: Country Level Customization Request

Available Customization

With the given market data, SNS Insider offers customization as per the company’s specific needs. The following customization options are available for the report:

  • Product Analysis

  • Criss-Cross segment analysis (e.g. Product X Application)

  • Product Matrix which gives a detailed comparison of product portfolio of each company

  • Geographic Analysis

  • Additional countries in any of the regions

  • Company Information

  • Detailed analysis and profiling of additional market players (Up to five)


  •            5000 (33% Discount)


  •            8950 (40% Discount)


  •            3050 (23% Discount)

Start a Conversation

Hi! Click one of our member below to chat on Phone